Aircraft Design: Synthesis and Analysis - part 4 potx
Bạn đang xem bản rút gọn của tài liệu. Xem và tải ngay bản đầy đủ của tài liệu tại đây (8.79 MB, 57 trang )
Fuselage Effect on Induced Drag
One may estimate the drag associated with fuselage interference in the following manner:
If the flow were axially symmetric and the fuselage were long, then mass conservation leads to:
b'
2
= b
2
- d
2
.
For minimum drag with fixed lift, the downwash in the far wake should be constant, so the wake
vorticity is just like that associated with an elliptical wing with no fuselage of span, b'. The lift on the
wing-fuselage system is computable from the far-field vorticity, so the span efficiency is:
e = 1 - d
2
/ b
2
.
In practice, one does not achieve this much lift on the fuselage. Assuming a long circular fuselage and
computing the lift based on images, the resulting induced drag increment is about twice the simple
theoretical value, so:
s = 1 - 2 d
2
/b
2
.
Transonic Compressibility Drag
This section deals with the effect of Mach number on drag from subsonic speeds through transonic
speeds. We concentrate on some of the basic physics of compressible flow in order to estimate the
incremental drag associated with Mach number.
The chapter is divided into the following sections:
● Introduction
● Predicting M
div
and M
cc
● 3-D Effects and Sweep
● Predicting C
Dc
Notation for this chapter:
C
L
Airplane lift coefficient
∆C
D
c
Incremental drag coefficient due to compressibility
M
cc
Crest critical Mach number, the flight Mach number at which the velocities at the crest of the wing
in a direction normal to the isobars becomes sonic
M
0
The flight Mach number
β
Prandtl-Glauert Factor (1-M
0
)
1/2
t/c Average thickness to chord ratio, in the freestream direction, for the exposed part of the wing
V
0
The flight speed
∆V
Surface perturbation velocity
Λ
c/4
Wing quarter-chord sweepback angle, degrees
Λ
c
Sweepback angle of isobars at wing crest, degrees
γ
Ratio of specific heats, 1.40 for air.
Compressibility Drag: Introduction
The low speed drag level is often defined at a Mach number of 0.5, below which the airplane drag
coefficient at a given lift coefficient is generally invariant with Mach number. The increase in the
airplane drag coefficient at higher Mach numbers is called compressibility drag. The compressibility drag
includes any variation of the viscous and vortex drag with Mach number, shock-wave drag, and any drag
due to shock-induced separations. The incremental drag coefficient due to compressibility is designated
C
D
c
.
In exploring compressibility drag, we will first limit the discussion to unswept wings. The effect of
sweepback will then be introduced. For aspect ratios above 3.5 to 4.0, the flow over much of the wing
span can be considered to be similar to two-dimensional flow. Therefore, we will be thinking at first in
terms of flow over two-dimensional airfoils.
When a wing is generating lift, velocities on the upper surface of the wing are higher than the freestream
velocity. As the flight speed of an airplane approaches the speed of sound, i.e., M>0.65, the higher local
velocities on the upper surface of the wing may reach and even substantially exceed M= 1.0. The
existence of supersonic local velocities on the wing is associated with an increase of drag due to a
reduction in total pressure through shockwaves and due to thickening and even separation of the
boundary layer due to the local but severe adverse pressure gradients caused by the shock waves. The
drag increase is generally not large, however, until the local speed of sound occurs at or behind the 'crest'
of the airfoil, or the 'crestline' which is the locus of airfoil crests along the wing span. The crest is the
point on the airfoil upper surface to which the freestream is tangent, Figure 1. The occurrence of
substantial supersonic local velocities well ahead of the crest does not lead to significant drag increase
provided that the velocities decrease below sonic forward of the crest.
Fig. 1 Definition of the Airfoil Crest
A shock wave is a thin sheet of fluid across which abrupt changes occur in p, ρ, V and M. In general, air
flowing through a shock wave experiences a jump toward higher density, higher pressure and lower
Mach number. The effective Mach number approaching the shock wave is the Mach number of the
component of velocity normal to the shock wave. This component Mach number must be greater than 1.0
for a shock to exist. On the downstream side, this normal component must be less than 1.0. In a two-
dimensional flow, a shock is usually required to bring a flow with M > 1.0 to M < 1.0. Remember that
the velocity of a supersonic flow can be decreased by reducing the area of the channel or streamtube
through which it flows, When the velocity is decreased to M = 1.0 at a minimum section and the channel
then expands, the flow will generally accelerate and become supersonic again. A shock just beyond the
minimum section will reduce the Mach number to less than 1.0 and the flow will be subsonic from that
point onward.
Whenever the local Mach number becomes greater than 1.0 on the surface of a wing or body in a
subsonic freestream, the flow must be decelerated to a subsonic speed before reaching the trailing edge.
If the surface could be shaped so that the surface Mach number is reduced to 1.0 and then decelerated
subsonically to reach the trailing edge at the surrounding freestream pressure, there would be no shock
wave and no shock drag. This ideal is theoretically attainable only at one unique Mach number and angle
of attack. In general, a shock wave is always required to bring supersonic flow back to M< 1.0. A major
goal of transonic airfoil design is to reduce the local supersonic Mach number to as close to M = 1.0 as
possible before the shock wave. Then the fluid property changes through the shock will be small and the
effects of the shock may be negligible. When the Mach number just ahead of the shock becomes
increasingly larger than 1.0, the total pressure losses across the shock become greater, the adverse
pressure change through the shock becomes larger, and the thickening of the boundary layer increases.
Near the nose of a lifting airfoil, the streamtubes close to the surface are sharply contracted signifying
high velocities. This is a region of small radius of curvature of the surface, Figure 1, and the flow, to be
in equilibrium, responds like a vortex flow, i.e. the velocity drops off rapidly as the distance from the
center of curvature is increased. Thus the depth, measured perpendicular to the airfoil surface, of the flow
with M > 1.0 is small. Only a small amount of fluid is affected by a shock wave in this region and the
effects of the total pressure losses caused by the shock are, therefore, small. Farther back on the airfoil,
the curvature is much less, the radius is larger and a high Mach number at the surface persists much
further out in the stream. Thus, a shock affects much more fluid. Furthermore, near the leading edge the
boundary layer is thin and has a full, healthy, velocity profile. Toward the rear of the wing, the boundary
layer is thicker, its lower layers have a lower velocity and it is less able to keep going against the adverse
pressure jump of a shock. Therefore, it is more likely to separate.
For the above reasons supersonic regions can be carried on the forward part of an airfoil almost without
drag. Letting higher supersonic velocities create lift forward allows the airfoil designer to reduce the
velocity at and behind the crest for any required total lift and this is the crucial factor in avoiding
compressibility drag on the wing.
The unique significance of the crest in determining compressibility drag is largely an empirical matter
although many explanations have been advanced. One is that the crest divides the forward facing portion
of the airfoil from the aft facing portion. Supersonic flow, and the resulting low pressures (suction) on
the aft facing surface would contribute strongly to drag. Another explanation is that the crest represents a
minimum section when the flow between the airfoil upper surface and the undisturbed streamlines some
distance away is considered, figure 2. Thus, if M= >1.0 at crest, the flow will accelerate in the diverging
channel behind the crest, this leads to a high supersonic velocity, a strong suction and a strong shock.
Fig. 2 One View of the Airfoil Crest
The freestream Mach number at which the local Mach number on the airfoil first reaches 1.0 is known as
the critical Mach number. The freestream Mach number at which M= 1.0 at the airfoil crest is called the
crest critical Mach number, Mcc The locus of the airfoil crests from the root to the tip of the wing is
known as the crestline.
Empirically it is found that the drag of conventional airfoils rises abruptly at 2 to 4% higher Mach
number than that at which M= 1.0 at the crest (supercritical airfoil are a bit different as discussed briefly
later). The Mach number at which this abrupt drag rise starts is called the drag divergence Mach number,
M
Div
. This is a major design parameter for all high speed aircraft. The lowest cost cruising speed is either
at or slightly below M
Div
depending upon the cost of fuel.
Since C
p
at the crest increases with C
L
, M
Div
generally decreases at higher C
L
. At very low C
L
, the lower
surface becomes critical and M
Div
decreases, as shown in Figure 3.
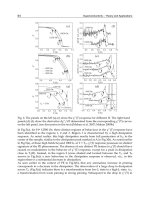
Fig. 3 Typical Variation of Airfoil M
Div
with C
L
The drag usually rises slowly somewhat below M
Div
due to the increasing strength of the forward,
relatively benign shocks and to the gradual thickening of the boundary layer. The latter is due to the
shocks and the higher adverse pressure gradients resulting from the increase in airfoil pressures because
C
p
at each point rises with (1-M
0
2
)
-1/2
. The nature of the early drag rise is shown in Figure 4.
Figure 4. Typical Variation Of C
D
c
with Mach Number
There is also one favorable drag factor to be considered as Mach number is increased. The skin friction
coefficient decreases with increasing Mach number as shown in figure 5. Below Mach numbers at which
waves first appear and above about M= 0.5, this reduction just about increased drag from the higher
adverse pressure gradient due to Mach Therefore, the net effect on drag coefficient due to increasing
Mach M = 0.5 is usually negligible until some shocks occur on the wing or favorable effect of Mach
number on skin friction is very significant sonic Mach number, however.
Figure 5. The Ratio of the Skin Friction Coefficient in Compressible Turbulent Flow to the
Incompressible Value at the Same Reynolds Number
Compressibility Drag: M
Div
Since M
Div
is 2 to 4% above M
cc
(we shall see that the '2 to 4%' is dependent on wing sweepback angle),
we can predict the drag rise Mach number, M
Div
if we can predict M
cc
. If we can identify the pressure
drop or more conveniently the local pressure coefficient, C
p
, required on an airfoil to accelerate the flow
locally to exactly the speed of sound, measured or calculated crest pressures can be used to determine the
freestream Mach numbers at which M= 1.0 at the crest. If p is the pressure at a point on an airfoil of an
unswept wing, the pressure coefficient is
The C
p
may be expressed in terms of the local and freestream Mach numbers. Under the assumption of
adiabatic flow:
By definition, when local Mach number M= 1.0 , C
p
= C
p
*, the critical pressure coefficient. Thus,
Here is a simple calculator that provides C
p
*
given a value for freestream Mach number using these
equations.
Freestream Mach:
Cp*:
A graph of this equation is shown in figure 6. If the C
p
at the crest is known, the value of M
0
for which
the speed of sound occurs at the crest can be immediately determined. The above discussion applies to
unswept wings and must be modified for wings with sweepback.
0.8
**
Compute
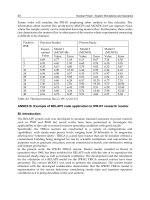
Figure 6. Variation of Pressure Coefficient at the Crest on a Modern Peaky Airfoil, t/c = 0.104, Re - 14.5
Million
It will be noted from Figure 6 that the airfoil information required is C
p
crest
versus M. In Figure 6, typical
wind tunnel airfoil crest C
p
variations with M are shown for several angles of attack. M
cc
occurs when
the C
p
crest
versus M curve for a given angle of attack intersects the curve of C
p
* versus M. A few percent
above this speed, the abrupt drag rise will start at M
Div
. The approximate relationship between M
Div
and
M
cc
is given in the next section.
If the airfoil pressure distribution is calculated by one of various complex theoretical methods at M = 0,
the value of the crest C
p
can be plotted versus M
0
using the Prandtl-Glauert approximation:
or the somewhat more involved Karman-Tsien relationship:
The value of C
p
at the crest is an important design characteristic of high speed airfoils. In general, C
p
crest
at a given C
L
is dependent upon the thickness ratio (ratio of the maximum airfoil thickness to the chord)
and the shape of the airfoil contour.
We have been describing a method of predicting M
cc
which is useful in evaluating a particular airfoil
design and in understanding the nature of the process leading to the occurrence of significant additional
drag on the wing. Often in an advanced design process the detailed airfoil pressure distribution is not
available. The airfoil is probably not even selected. It is still possible to closely estimate the M
cc
from
Figure 7. This graph displays M
cc
as a function of airfoil mean thickness ratio t/c and C
L
. It is based on
studies of the M
cc
of various airfoils representing the best state of the art for conventional 'Peaky' type
airfoils typical of all existing late model transport aircraft. The significance of the term 'peaky' is
discussed in the chapter on airfoils. Use of the chart assumes that the new aircraft will have a well
developed peaky airfoil and that the upper surface of the wing is critical for compressibility drag rise.
Implied in the latter assumption is a design that assures that elements other than the wing, i.e. fuselage,
nacelles, etc., have a higher M
div
than the wing. Up to design Mach numbers greater than .92 to .94 this
is attainable. Furthermore, it is assumed that the lower surface of the wing is not critical. This assumption
is always valid at the normal cruise lift coefficients but may not be true at substantially lower lift
coefficients. Here the wing twist or washout designed to approach elliptical loading at cruise and to avoid
first stalling at the wing tips, may lead to very low angles of attack on the outer wing panel. The highest
C
p
crest
may then occur on the lower surface, a condition not considered in developing figure 7. Thus the
chart may give optimistic values of M
cc
at lift coefficients more than 0.1 to 0.15 below the design cruise
lift coefficients.
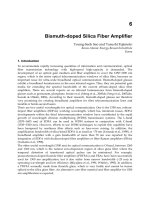
Figure 7 Crest Critical Mach Number vs. C
L
and t/c for a Family of Peaky Airfoil Sections
Figure 7 does not apply directly to airfoils with pressure distributions that look significantly different
from the peaky airfoil family. Modern supercritical airfoils, discussed in later chapters, can achieve
higher drag divergence Mach numbers than those suggested by the figure. Although the performance of
such airfoil families is often a closely guarded company secret, the effect can be approximated by adding
an increment to the value of M
cc
shown in the figure. A very aggressive supercritical section might
achieve a drag divergence Mach number increment of 0.06, while more typically the increment is 0.03 to
0.04 above the peaky sections.
Compressibility Drag: 3D Effects and
Sweep
The previously described method applies to two-dimensional airfoils, but can be used effectively in
estimating the drag rise Mach number of wings when the effects of sweep and other 3-D effects are
considered.
Average t/c
In Figure 7 the mean thickness ratio t/c is the average t/c of the exposed wing weighted for wing area
affected just as the mean aerodynamic chord, MAC , is the average chord of the wing weighted for wing
area affected. The mean thickness ratio of a trapezoidal wing with a linear thickness distribution is given
by:
t/c
avg
= (t
root
+ t
tip
) / (C
root
+ C
tip
)
This equation for t/c
avg
is based on a linear thickness (not linear t/c) distribution. This results from
straight line fairing on constant % chord lines between airfoils defined at root and tip. The same equation
is valid on a portion of wing correspondingly defined when the wing has more than two defining airfoils.
The entire wing t/c
avg
can then be determined by averaging the t/c
avg
of these portions, weighting each
t/c
avg
by the area affected. Note that C
root
and C
tip
are the root and tip chords while t
root
and t
tip
are the
root and tip thicknesses. b is the wing span and y is the distance from the centerline along the span.
Sweptback Wings
Almost all high speed subsonic and supersonic aircraft have sweptback wings. The amount of sweep is
measured by the angle between a lateral axis perpendicular to the airplane centerline and a constant
percentage chord line along the semi-span of the wing. The latter is usually taken as the quarter chord
line both because subsonic lift due to angle of attack acts at the quarter chord and because the crest is
usually close to the quarter chord.
Figure 8. Velocity Components Affecting a Sweptback Wing
Sweep increases M
cc
and M
Div
. The component of the freestream velocity parallel to the wing, V||, as
shown in figure 8 does not encounter the airfoil curvatures that produce increased local velocities,
reduced pressures, and therefore lift. Only the component perpendicular to the swept span, Vn , is
effective. Thus on a wing with sweep angle, Λ:
V
0eff
= V
0
cos Λ
M
0eff
= M
0
cos Λ
q
0eff
= q
0
cos
2
Λ
The meaningful crest critical Mach number, M
cc
, is the freestream Mach number at which the component
of the local Mach number at the crest, perpendicular to the isobars, first reaches 1.0. These isobars or
lines of constant pressure coincide closely with constant percent chord lines on a well-designed wing.
Since q
0effective
is reduced, the C
L
based on this q and the C
p
at the crest, also based on qo
effective
will
increase, and M
cc
and M
Div
will be reduced. Furthermore, the sweep effect discussion so far has assumed
that the thickness ratio is defined perpendicular to the quarter chord line. Usual industry practice is to
define thickness ratio parallel to the freestream. This corresponds to sweeping the wing by shearing in
planes parallel to the freestream rather than by rotating the wing about a pivot on the wing centerline.
When the wing is swept with constant freestream thickness ratio, the thickness ratio perpendicular to the
quarter chord line increases. The physical thickness is constant but the chord decreases. The result is a
further decrease in sweep effectiveness below the pure cosine variation. Thus, there are several opposing
effects, but the favorable one is dominant.
In addition to increasing M
cc
, sweepback slightly increases the speed increment between the occurance
of Mach 1.0 flow at the crest and the start of the abrupt increase in drag at M
Div
. Using a definition for
M
Div
as the Mach number at which the slope of the C
D
vs. M
0
curve is 0.05 (i.e. dC
D
/dM = 0.05), the
following empirical expression closely approximates M
Div
:
M
Div
= M
cc
[ 1.02 +.08 ( 1 - Cos Λ ) ]
Other 3-D Effects
The above analysis is based on two-dimensional sweep theory and applies exactly only to a wing of
infinite span. It also applies well to most wings of aspect ratio greater than four except near the root and
tip of the wing where significant interference effects occur.
The effect of the swept wing is to curve the streamline flow over the wing as shown in Figure 9. The
curvature is due to the deceleration and acceleration of the flow in the plane perpendicular to the quarter
chord line.
Figure 9. Stagnation Streamline with Sweep
Near the wing tip the flow around the tip from the lower to upper surface obviously alters the effect of
sweep. The effect is to unsweep the spanwise constant pressure lines known as isobars. To compensate,
the wing tip may be given additional structural sweep, Figure 10.
Figure 10. Highly Swept Wing Tip
It is at the wing root that the straight fuselage sides more seriously degrade,the sweep effect by
interfering with curved flow of figure 9. Airfoils are often modified near the root to change the basic
pressure distribution to compensate for the distortions to the swept wing flow. Since the fuselage effect is
to increase the effective airfoil camber, the modification is to reduce the root airfoil camber and in some
cases to use negative camber. The influence of the fuselage then changes the altered root airfoil pressures
back to the desired positive camber pressure distribution existing farther out along the wing span.
This same swept wing root compensation can be achieved by adjusting the fuselage shape to match the
natural swept wing streamlines. This introduces serious manufacturing and passenger cabin arrangement
problems so that the airfoil approach is used for transports. Use of large fillets or even fuselage shape
variations is appropriate for fighters. The designing of a fuselage with variable diameter for transonic
drag reasons is sometimes called 'coke-bottling'. At M= 1.0 and above, there is a definite procedure for
this minimization of shock wave drag. It is called the "area rule" and aims at arranging the airplane
components and the fuselage cross-sectional variation so that the total aircraft cross-sectional area, in a
plane perpendicular to the line of flight, has a smooth and prescribed variation in the longitudinal (flight)
direction. This is discussed further in the section on supersonic drag.
Figure 11. 'Coke-Bottled' Fuselage
The estimates provided by Figure 7 and the equation for M
Div
assume that the wing root intersection has
been designed to compensate for the 'unsweeping' effect of the fuselage either with airfoil or fuselage
fairing treatment. If this is not done, M
Div
will be reduced or there will be a substantial drag rise at Mach
numbers lower than M
Div
. For all aircraft there is some small increase in drag coefficient due to
compressibility at Mach numbers below M
Div
as illustrated in Figure 4.
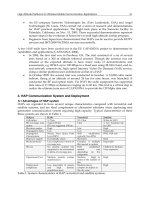
Compressibility Drag: Computing C
D
c
The increment in drag coefficient due to compressibility, C
D
c
, from its first appearance to well beyond
M
Div
can be estimated from Figure 12 where C
D
c
is normalized by dividing by cos
3
Λ and plotted against
the ratio of freestream Mach number, M
0
to M
cc
. Actual aircraft may have slightly less drag rise than
indicated by this method if very well designed. A poor design could easily have higher drag rise. The
differences arise from early shocks on some portion of the wing or other parts of the airplane. Figure 12
is an empirical average of existing transport aircraft data.
Figure 12 Incremental Drag Coefficient Due To Compressibility
In summary, the method for estimating compressibility drag is as follows:
1. Determine the crest critical Mach number for the values of lift coefficient being studied from figure 7
for the appropriate values of the wing quarter chord sweep angle and the average thickness ratio for the
exposed part of the wing.
2. Determine the incremental drag coefficient due to compressibility from figure 12 for the crest-critical
Mach numbers from step 1.
When this method is used, the following limitations should be kept in mind:
1. The method assumes that the dominant factor in the airplane compressibility drag characteristics at
cruising conditions is the wing. This means that the other components must have drag-divergence Mach
numbers higher than that of the wing and that interference must be kept to a minimum in order for this
method to be applicable.
2. The estimates for the crest critical Mach number in terms of the wing sweep angle, thickness ratio
measured in the freestream direction, and lift coefficient are based on peaky airfoil sections. This method
would not be reliable for significantly different types of airfoil sections.
One further note is in order. The expression "drag divergence Mach number" or M
Div
is the Mach
number at which the drag begins to rise abruptly. It is usually desirable to cruise close to M
Div
.
Numerous definitions of 'rise abruptly' have been used including:
a. M
Div
= M for C
D
c
= .0014, or some other value varying from .0010 to .0025
b. M
Div
= M for dCD/dM = .03 or .05 or 0.10
c. M
Div
= M at constant lift coefficient for M C
L
/C
D
, a term in the range expression, equals 99% of the
maximum M C
L
/C
D
Method (c) is most meaningful and corresponds approximately to (dC
D
/dM) = .03 and usually to C
D
c
=
.0012 to .0016.
The M
Div
for bodies can be related to the occurence of critical Mach number, or sonic velocity, at or
behind the longitudinal station of maximum cross-sectional area. This is analogous to the crest theory of
M for airfoils. Another factor is present on bodies, however, namely that the expanding forward portion
of the body tends to thin the boundary layer and make it less likely to separate. Generally the M
Div
of
bodies can be assumed to be about 3% above the Mach number at which sonic velocity occurs at the
maximum cross-sectional area.
Compressibility Drag Example
NACA 0012 Airfoil, CL = 0.5
The following figures show the development of the flow field around a two-dimensional NACA 0012
airfoil section in the Mach number range 0.50 - 0.90. The data was obtained with a two-dimensional
Euler flow solver. Since the program solves the Euler equations, only the compressibility drag due to the
presence of shock waves is accounted for. Other effects such as shock-induced separation cannot be
predicted with this model.
The different shades of color represent the changing values of Mach number in the flow domain. Red
represents regions of high Mach number (mostly on the upper surface where the flow is being
accelerated) and blue represents regions of low Mach number (mostly at the stagnation point regions in
the leading and trailing edge areas).
The sonic line (countour line where the Mach number is exactly 1.0) is shown as a faint white line when
sonic flow exists. The flow is presented for the following Mach numbers:
● Mach 0.50
● Mach 0.55
● Mach 0.60
● Mach 0.65
● Mach 0.70
● Mach 0.75
● Mach 0.80
● Mach 0.85
● Mach 0.90
The appearance of drag in the compressible regime is directly related to the existence of shock waves and
the consequent total pressure losses and entropy creation. This
image shows the entropy field for the
Mach 0.80 condition. As you can see, in an inviscid calculation, entropy is created at the shock and is
convected downstream with the flow. Ahead of the shock the dark blue color indicates that no entropy
has been generated and that the level of entropy there is that of the free stream. In a viscous calculation,
additional entropy would be generated in the boundary layer.
With an average angle of attach of 3.966 degrees for these flow solutionss, you can get an idea of the
location of the crest for this airfoil. The following two figures are plots of the coefficient of drag of the
airfoil vs. Mach number at two different scales. From theses plots and the images of the flow field, you
should be able to get an idea of the relationships between critical Mach number, Mc, crest critical Mach
number, Mcc, and divergence Mach number, Mdiv.
Notice that the scale in the following plot is quite large. Drag divergence occurs somewhere between
Mach 0.65 and 0.70 for this airfoil. For carefully designed supercritical airfoils Mdiv achieves a higher
value (around 0.80 - 0.85).
These results courtesy of: