Building the Data Warehouse Third Edition phần 8 ppsx
Bạn đang xem bản rút gọn của tài liệu. Xem và tải ngay bản đầy đủ của tài liệu tại đây (553.93 KB, 43 trang )
Some reasons for excluding derived data and DSS data from the corporate data
model and the midlevel model include the following:
■■
Derived data and DSS data change frequently.
■■
These forms of data are created from atomic data.
■■
They frequently are deleted altogether.
■■
There are many variations in the creation of derived data and DSS data.
Migration to the Architected Environment
279
2
1
existing
systems
environment
data
model
3
existing
systems
environment
data
model
“Best” data to represent the data model:
• most timely
• most accurate
• most complete
• nearest to the external source
• most structurally compatible
define the system of record
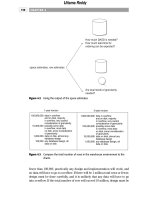
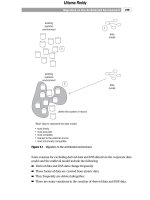
Figure 9.1 Migration to the architected environment.
Uttama Reddy
Because derived data and DSS data are excluded from the corporate data
model and the midlevel model, the data model does not take long to build.
After the corporate data model and the midlevel models are in place, the next
activity is defining the system of record. The system of record is defined in
terms of the corporation’s existing systems. Usually, these older legacy systems
are affectionately known as the “mess.”
The system of record is nothing more than the identification of the “best” data
the corporation has that resides in the legacy operational or in the Web-based
ebusiness environment. The data model is used as a benchmark for determin-
ing what the best data is. In other words, the data architect starts with the data
model and asks what data is in hand that best fulfills the data requirements
identified in the data model. It is understood that the fit will be less than per-
fect. In some cases, there will be no data in the existing systems environment or
the Web-based ebusiness environment that exemplifies the data in the data
model. In other cases, many sources of data in the existing systems environ-
ment contribute data to the systems of record, each under different circum-
stances.
The “best” source of existing data or data found in the Web-based ebusiness
environment is determined by the following criteria:
■■
What data in the existing systems or Web-based ebusiness environment is
the most complete?
■■
What data in the existing systems or Web-based ebusiness environment is
the most timely?
■■
What data in the existing systems or Web-based ebusiness environment is
the most accurate?
■■
What data in the existing systems or Web-based ebusiness environment is
the closest to the source of entry into the existing systems or Web-based
ebusiness environment?
■■
What data in the existing systems or Web-based ebusiness environment
conforms the most closely to the structure of the data model? In terms of
keys? In terms of attributes? In terms of groupings of data attributes?
Using the data model and the criteria described here, the analyst defines the sys-
tem of record. The system of record then becomes the definition of the source
data for the data warehouse environment. Once this is defined, the designer then
asks what are the technological challenges in bringing the system-of-record data
into the data warehouse. A short list of the technological challenges includes
the following:
■■
A change in DBMS. The system of record is in one DBMS, and the data
warehouse is in another DBMS.
CHAPTER 9
280
Uttama Reddy
■■
A change in operating systems. The system of record is in one operating
system, and the data warehouse is in another operating system,
■■
The need to merge data from different DBMSs and operating systems. The
system of record spans more than one DBMS and/or operating system.
System-of-record data must be pulled from multiple DBMSs and multiple
operating systems and must be merged in a meaningful way.
■■
The capture of the Web-based data in the Web logs. Once captured, how
can the data be freed for use within the data warehouse?
■■
A change in basic data formats. Data in one environment is stored in
ASCII, and data in the data warehouse is stored in EBCDIC, and so forth.
Another important technological issue that sometimes must be addressed is the
volume of data. In some cases, huge volumes of data will be generated in the
legacy environment. Specialized techniques may be needed to enter them into
the data warehouse. For example, clickstream data found in the Web logs needs
to be preprocessed before it can be used effectively in the data warehouse
environment.
There are other issues. In some cases, the data flowing into the data warehouse
must be cleansed. In other cases, the data must be summarized. A host of issues
relate to the mechanics of the bringing of data from the legacy environment into
the data warehouse environment.
After the system of record is defined and the technological challenges in bring-
ing the data into the data warehouse are identified, the next step is to design the
data warehouse, as shown in Figure 9.2.
If the data modeling activity has been done properly, the design of the data
warehouse is fairly simple. Only a few elements of the corporate data model
and the midlevel model need to be changed to turn the data model into a data
warehouse design. Principally, the following needs to be done:
■■
An element of time needs to be added to the key structure if one is not
already present.
■■
All purely operational data needs to be eliminated.
■■
Referential integrity relationships need to be turned into artifacts.
■■
Derived data that is frequently needed is added to the design.
The structure of the data needs to be altered when appropriate for the following:
■■
Adding arrays of data
■■
Adding data redundantly
■■
Further separating data under the right conditions
■■
Merging tables when appropriate
Migration to the Architected Environment
281
Uttama Reddy
Stability analysis of the data needs to be done. In stability analysis, data whose
content has a propensity for change is isolated from data whose content is very
stable. For example, a bank account balance usually changes its content very
frequently-as much as three or four times a day. But a customer address
changes very slowly-every three or four years or so. Because of the very dis-
parate stability of bank account balance and customer address, these elements
of data need to be separated into different physical constructs.
CHAPTER 9
282
4
existing
systems
environment
design the data warehouse
5
existing
systems
environment
design the data warehouse
extract
integrate
change time basis of data
condense data
efficiently scan data
Figure 9.2 Migration to the architected environment.
Uttama Reddy
The data warehouse, once designed, is organized by subject area. Typical sub-
ject areas are as follows:
■■
Customer
■■
Product
■■
Sale
■■
Account
■■
Activity
■■
Shipment
Within the subject area there will be many separate tables, each of which is con-
nected by a common key. All the customer tables will have CUSTOMER as a
key, for example.
One of the important considerations made at this point in the design of the data
warehouse is the number of occurrences of data. Data that will have very many
occurrences will have a different set of design considerations than data that has
very few occurrences. Typically, data that is voluminous will be summarized,
aggregated, or partitioned (or all of the above). Sometimes profile records are
created for voluminous data occurrences.
In the same vein, data that arrives at the data warehouse quickly (which is usu-
ally, but not always, associated with data that is voluminous) must be consid-
ered as well. In some cases, the arrival rate of data is such that special
considerations must be made to handle the influx of data. Typical design con-
siderations include staging the data, parallelization of the load stream, delayed
indexing, and so forth.
After the data warehouse is designed, the next step is to design and build the
interfaces between the system of record-in the operational environment-and
the data warehouses. The interfaces populate the data warehouse on a regular
basis.
At first glance, the interfaces appear to be merely an extract process, and it is
true that extract processing does occur. But many more activities occur at the
point of interface as well:
■■
Integration of data from the operational, application-oriented environment
■■
Alteration of the time basis of data
■■
Condensation of data
■■
Efficient scanning of the existing systems environment
Most of these issues have been discussed elsewhere in this book.
Note that the vast majority of development resources required to build a data
warehouse are consumed at this point. It is not unusual for 80 percent of the
Migration to the Architected Environment
283
Uttama Reddy
effort required to build a data warehouse to be spent here. In laying out the
development activities for building a data warehouse, most developers overes-
timate the time required for other activities and underestimate the time
required for designing and building the operational-to-data-warehouse inter-
face. In addition to requiring resources for the initial building of the interface
into the data warehouse, the ongoing maintenance of the interfaces must be
considered. Fortunately, ETL software is available to help build and maintain
this interface.
Once the interface programs are designed and built, the next activity is to start
the population of the first subject area, as shown in Figure 9.3. The population
CHAPTER 9
284
6
existing
systems
environment
Start to populate the
first subject area.
7
existing
systems
environment
Continue population
and encourage
data mart departmental
usage.
WARNING: If you wait for the
existing systems environment to
get “cleaned up” before building
the data warehouse, you will
NEVER build a data warehouse.
Figure 9.3 Iterative migration to the architected environment.
Uttama Reddy
is conceptually very simple. The first of the data is read in the legacy environ-
ment; then it is captured and transported to the data warehouse environment.
Once in the data warehouse environment the data is loaded, directories are
updated, meta data is created, and indexes are made. The first iteration of the
data is now ready for analysis in the data warehouse.
There are many good reasons to populate only a fraction of the data needed in
a data warehouse at this point. Changes to the data likely will need to be made.
Populating only a small amount of data means that changes can be made easily
and quickly. Populating a large amount of data greatly diminishes the flexibility
of the data warehouse. Once the end user has had a chance to look at the data
(even just a sample of the data) and give feedback to the data architect, then it
is safe to populate large volumes of data. But before the end user has a chance
to experiment with the data and to probe it, it is not safe to populate large vol-
umes of data.
End users operate in a mode that can be called the “discovery mode.” End users
don’t know what their requirements are until they see what the possibilities are.
Initially populating large amounts of data into the data warehouse is dangerous-
it is a sure thing that the data will change once populated. Jon Geiger says that
the mode of building the data warehouse is “build it wrong the first time.” This
tongue-in-cheek assessment has a strong element of truth in it.
The population and feedback processes continue for a long period (indefi-
nitely). In addition, the data in the warehouse continues to be changed. Of
course, over time, as the data becomes stable, it changes less and less.
A word of caution: If you wait for existing systems to be cleaned up, you will
never build a data warehouse. The issues and activities of the existing systems’
operational environment must be independent of the issues and activities of the
data warehouse environment. One train of thought says, “Don’t build the data
warehouse until the operational environment is cleaned up.” This way of think-
ing may be theoretically appealing, but in truth it is not practical at all.
One observation worthwhile at this point relates to the frequency of refresh-
ment of data into the data warehouse. As a rule, data warehouse data should be
refreshed no more frequently than every 24 hours. By making sure that there is
at least a 24-hour time delay in the loading of data, the data warehouse devel-
oper minimizes the temptation to turn the data warehouse into an operational
environment. By strictly enforcing this lag of time, the data warehouse serves
the DSS needs of the company, not the operational needs. Most operational
processing depends on data being accurate as of the moment of access (i.e.,
current-value data). By ensuring that there is a 24-hour delay (at the least), the
data warehouse developer adds an important ingredient that maximizes the
chances for success.
Migration to the Architected Environment
285
Uttama Reddy
In some cases, the lag of time can be much longer than 24 hours. If the data is
not needed in the environment beyond the data warehouse, then it may make
sense not to move the data into the data warehouse on a weekly, monthly, or
even quarterly basis. Letting the data sit in the operational environment allows
it to settle. If adjustments need to be made, then they can be made there with
no impact on the data warehouse if the data has not already been moved to the
warehouse environment.
The Feedback Loop
At the heart of success in the long-term development of the data warehouse is
the feedback loop between the data architect and the DSS analyst, shown in
Figure 9.4. Here the data warehouse is populated from existing systems. The
DSS analyst uses the data warehouse as a basis for analysis. On finding new
opportunities, the DSS analyst conveys those requirements to the data archi-
tect, who makes the appropriate adjustments. The data architect may add data,
delete data, alter data, and so forth based on the recommendations of the end
user who has touched the data warehouse.
CHAPTER 9
286
existing systems environment
data warehouse
data architect
DSS analyst
Figure 9.4 The crucial feedback loop between DSS analyst and data architect.
Uttama Reddy
A few observations about this feedback loop are of vital importance to the suc-
cess of the data warehouse environment:
■■
The DSS analyst operates—quite legitimately—in a “give me what I want,
then I can tell you what I really want” mode. Trying to get requirements
from the DSS analyst before he or she knows what the possibilities are is
an impossibility.
■■
The shorter the cycle of the feedback loop, the more successful the ware-
house effort. Once the DSS analyst makes a good case for changes to the
data warehouse, those changes need to be implemented as soon as possi-
ble.
■■
The larger the volume of data that has to be changed, the longer the feed-
back loop takes. It is much easier to change 10 gigabytes of data than 100
gigabytes of data.
Failing to implement the feedback loop greatly short-circuits the probability of
success in the data warehouse environment.
Strategic Considerations
Figure 9.5 shows that the path of activities that have been described addresses
the DSS needs of the organization. The data warehouse environment is
designed and built for the purpose of supporting the DSS needs of the organi-
zation, but there are needs other than DSS needs.
Figure 9.6 shows that the corporation has operational needs as well. In addi-
tion, the data warehouse sits at the hub of many other architectural entities,
each of which depends on the data warehouse for data.
In Figure 9.6, the operational world is shown as being in a state of chaos. There
is much unintegrated data and the data and systems are so old and so patched
they cannot be maintained. In addition, the requirements that originally shaped
the operational applications have changed into an almost unrecognizable form.
The migration plan that has been discussed is solely for the construction of the
data warehouse. Isn’t there an opportunity to rectify some or much of the oper-
ational “mess” at the same time that the data warehouse is being built? The
answer is that, to some extent, the migration plan that has been described pre-
sents an opportunity to rebuild at least some of the less than aesthetically pleas-
ing aspects of the operational environment.
One approach—which is on a track independent of the migration to the data
warehouse environment—is to use the data model as a guideline and make a
case to management that major changes need to be made to the operational
Migration to the Architected Environment
287
Uttama Reddy
CHAPTER 9
288
existing
systems
data mart
departmental/
individual
systems
system of
record
data warehouse
data
warehouse
interface
programs
DSS
data model
Figure 9.5 The first major path to be followed is DSS.
existing
systems
system of
record
DSS
data model
data mart
departmental/
individual
systems
data
warehouse
operational
agents of change:
• aging of systems
• aging of technology
• organizational upheaval
• drastically changed requirements
Figure 9.6 To be successful, the data architect should wait for agents of change to
become compelling and ally the efforts toward the architected environment
with the appropriate agents.
TEAMFLY
Team-Fly
®
Uttama Reddy
environment. The industry track record of this approach is dismal. The amount
of effort, the amount of resources, and the disruption to the end user in under-
taking a massive rewrite and restructuring of operational data and systems is
such that management seldom supports such an effort with the needed level of
commitment and resources.
A better ploy is to coordinate the effort to rebuild operational systems with
what are termed the “agents of change”:
■■
The aging of systems
■■
The radical changing of technology
■■
Organizational upheaval
■■
Massive business changes
When management faces the effects of the agents of change, there is no ques-
tion that changes will have to be made—the only question is how soon and at
what expense. The data architect allies the agents of change with the notion of
an architecture and presents management with an irresistible argument for the
purpose of restructuring operational processing.
The steps the data architect takes to restructure the operational environment—
which is an activity independent of the building of the data warehouse—are
shown in Figure 9.7.
First a “delta” list is created. The delta list is an assessment of the differences
between the operational environment and the environment depicted by the
data model. The delta list is simple, with very little elaboration.
The next step is the impact analysis. At this point an assessment is made of the
impact of each item on the delta list. Some items may have a serious impact;
other items may have a negligible impact on the running of the company.
Next, the resource estimate is created. This estimate is for the determination of
how many resources will be required to “fix” the delta list item.
Finally, all the preceding are packaged in a report that goes to information sys-
tems management. Management then makes a decision as to what work should
proceed, at what pace, and so forth. The decision is made in light of all the pri-
orities of the corporation.
Methodology and Migration
In the appendix of this book, a methodology for building a data warehouse is
described. The methodology is actually a much larger one in scope in that it not
only contains information about how to build a data warehouse but also
Migration to the Architected Environment
289
Uttama Reddy
describes how to use the data warehouse. In addition, the classical activities of
operational development are included to form what can be termed a data-
driven methodology.
The methodology described differs from the migration path in several ways.
The migration path describes general activities dynamically. The methodology
describes specific activities, deliverables from those activities, and the order
of the activities. The iterative dynamics of creating a warehouse are not
described, though. In other words, the migration plan describes a sketchy plan
in three dimensions, while the methodology describes a detailed plan in one
dimension. Together they form a complete picture of what is required to build
the data warehouse.
CHAPTER 9
290
existing
systems
system of
record
data model
1. delta list:
how the data model differs from
existing systems
2. impact analysis:
how each delta item makes
a difference
3. resource estimate:
how much will it cost to “fix”
the delta item
4. report to management:
• what needs to be fixed
• the estimate of resources required
• the order of work
• the disruption analysis
Figure 9.7 The first steps in creating the operational cleanup plan.
Uttama Reddy
A Data-Driven Development Methodology
Development methodologies are quite appealing to the intellect. After all,
methodology directs the developer down a rational path, pointing out what
needs to be done, in what order, and how long the activity should take. How-
ever, as attractive as the notion of a methodology is, the industry track record
has not been good. Across the board, the enthusiasm for methodologies (data
warehouse or any other) has met with disappointment on implementation.
Why have methodologies been disappointing? The reasons are many:
■■
Methodologies generally show a flat, linear flow of activities. In fact,
almost any methodology requires execution in terms of iterations. In other
words, it is absolutely normal to execute two or three steps, stop, and
repeat all or part of those steps again. Methodologies usually don’t recog-
nize the need to revisit one or more activities. In the case of the data ware-
house, this lack of support for iterations makes a methodology a very
questionable subject.
■■
Methodologies usually show activities as occurring once and only once.
Indeed, while some activities need to be done (successfully) only once,
others are done repeatedly for different cases (which is a different case
than reiteration for refinement).
■■
Methodologies usually describe a prescribed set of activities to be done.
Often, some of the activities don’t need to be done at all, other activities
need to be done that are not shown as part of the methodology, and so
forth.
■■
Methodologies often tell how to do something, not what needs to be done.
In describing how to do something, the effectiveness of the methodology
becomes mired in detail and in special cases.
■■
Methodologies often do not distinguish between the sizes of the systems
being developed under the methodology. Some systems are so small that a
rigorous methodology makes no sense. Some systems are just the right size
for a methodology. Other systems are so large that their sheer size and
complexity will overwhelm the methodology.
■■
Methodologies often mix project management concerns with design/devel-
opment activities to be done. Usually, project management activities
should be kept separate from methodological concerns.
Migration to the Architected Environment
291
Uttama Reddy
■■
Methodologies often do not make the distinction between operational and
DSS processing. The system development life cycles for operational and
DSS processing are diametrically opposed in many ways. A methodology
must distinguish between operational and DSS processing and develop-
ment in order to be successful.
■■
Methodologies often do not include checkpoints and stopping places in the
case of failure. “What is the next step if the previous step has not been
done properly?” is usually not a standard part of a methodology.
■■
Methodologies are often sold as solutions, not tools. When a methodology
is sold as a solution, inevitably it is asked to replace good judgment and
common sense, and this is always a mistake.
■■
Methodologies often generate a lot of paper and very little design. Design
and development activities are not legitimately replaced by paper.
Methodologies can be very complex, anticipating every possibility that may
ever happen. Despite these drawbacks, there still is some general appeal for
methodologies. A general-purpose methodology—applicable to the data-driven
environment—is described in the appendix, with full recognition of the pitfalls
and track record of methodologies. The data-driven methodology that is out-
lined owes much to its early predecessors. As such, for a much fuller explana-
tion of the intricacies and techniques described in the methodology, refer to the
books listed in the references in the back of this book.
One of the salient aspects of a data-driven methodology is that it builds on pre-
vious efforts—utilizing both code and processes that have already been devel-
oped. The only way that development on previous efforts can be achieved is
through the recognition of commonality. Before the developer strikes the first
line of code or designs the first database, he or she needs to know what already
exists and how it affects the development process. A conscious effort must be
made to use what is already in place and not reinvent the wheel. That is one of
the essences of data-driven development.
The data warehouse environment is built under what is best termed an iterative
development approach. In this approach a small part of the system is built to
completion, then another small part is completed, and so forth. That develop-
ment proceeds down the same path repeatedly makes the approach appear to
be constantly recycling itself. The constant recycling leads to the term “spiral”
development.
The spiral approach to development is distinct from the classical approach,
which can be called the “waterfall” approach. In this approach all of one activ-
ity is completed before the next activity can begin, and the results of one activ-
ity feed another. Requirements gathering is done to completion before analysis
and synthesization commence. Analysis and synthesization are done to com-
pletion before design begins. The results of analysis and synthesization feed the
CHAPTER 9
292
Uttama Reddy
process of design, and so forth. The net result of the waterfall approach is that
huge amounts of time are spent making any one step complete, causing the
development process to move at a glacial speed.
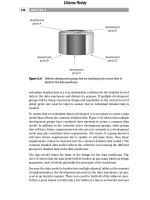
Figure 9.8 shows the differences between the waterfall approach and the spiral
approach.
Because the spiral development process is driven by a data model, it is often
said to be data driven.
Data-Driven Methodology
What makes a methodology data driven? How is a data-driven methodology any
different from any other methodology? There are at least two distinguishing
characteristics of a data-driven methodology.
A data-driven methodology does not take an application-by-application approach
to the development of systems. Instead, code and data that have been built pre-
viously are built on, rather than built around. To build on previous efforts, the
commonality of data and processing must be recognized. Once recognized, data
is built on if it already exists; if no data exists, data is constructed so that future
development may built on it. The key to the recognition of commonality is the
data model.
There is an emphasis on the central store of data—the data warehouse—as the
basis for DSS processing, recognizing that DSS processing has a very different
development life cycle than operational systems.
Migration to the Architected Environment
293
a classical waterfal development
approach to development
an iterative, or "spiral," approach to
development
Figure 9.8 The differences between development approaches, from a high level.
Uttama Reddy
System Development Life Cycles
Fundamentally, shaping the data-driven development methodology is the pro-
found difference in the system development life cycles of operational and DSS
systems. Operational development is shaped around a development life cycle
that begins with requirements and ends with code. DSS processing begins with
data and ends with requirements.
A Philosophical Observation
In some regards, the best example of methodology is the Boy Scout and Girl
Scout merit badge system, which is used to determine when a scout is ready to
pass to the next rank. It applies to both country- and city-dwelling boys and
girls, the athletically inclined and the intellectually inclined, and to all geo-
graphical areas. In short, the merit badge system is a uniform methodology for
the measurement of accomplishment that has stood the test of time.
Is there is any secret to the merit badge methodology? If so, it is this: The merit
badge methodology does not prescribe how any activity is to be accomplished;
instead, it merely describes what is to be done with parameters for the mea-
surement of the achievement. The how-to that is required is left up to the Boy
Scout or Girl Scout.
Philosophically, the approach to methodology described in the appendix of this
book takes the same perspective as the merit badge system. The results of what
must be accomplished and, generally speaking, the order in which things must
be done is described. How the results required are to be achieved is left entirely
up to the developer.
Operational Development/DSS Development
The data-driven methodology will be presented in three parts: METH 1, METH
2, and METH 3. The first part of the methodology, METH 1, is for operational
systems and processing. This part of the methodology will probably be most
familiar to those used to looking at classically structured operational method-
ologies. METH 2 is for DSS systems and processing—the data warehouse. The
essence of this component of the methodology is a data model as the vehicle
that allows the commonality of data to be recognized. It is in this section of the
appendix that the development of the data warehouse is described. The third
part of the methodology, METH 3, describes what occurs in the heuristic com-
CHAPTER 9
294
Uttama Reddy
ponent of the development process. It is in METH 3 that the usage of the ware-
house is described.
Summary
In this chapter, a migration plan and a methodology (found in the appendix)
were described. The migration plan addresses the issues of transforming data
out of the existing systems environment into the data warehouse environment.
In addition, the dynamics of how the operational environment might be orga-
nized were discussed.
The data warehouse is built iteratively. It is a mistake to build and populate
major portions of the data warehouse—especially at the beginning—because
the end user operates in what can be termed the “mode of discovery.” The end
user cannot articulate what he or she wants until the possibilities are known.
The process of integration and transformation of data typically consumes up to
80 percent of development resources. In recent years, ETL software has auto-
mated the legacy-to-data-warehouse interface development process.
The starting point for the design of the data warehouse is the corporate data
model, which identifies the major subject areas of the corporation. From the
corporate data model is created a lower-level “midlevel model.” The corporate
data model and the midlevel model are used as a basis for database design.
After the corporate data model and the midlevel model have been created, such
factors as the number of occurrences of data, the rate at which the data is used,
the patterns of usage of the data, and more are factored into the design.
The development approach for the data warehouse environment is said to be an
iterative or a spiral development approach. The spiral development approach is
fundamentally different from the classical waterfall development approach.
A general-purpose, data-driven methodology was also discussed. The general-
purpose methodology has three phases—an operational phase, a data ware-
house construction phase, and a data warehouse iterative usage phase.
The feedback loop between the data architect and the end user is an important
part of the migration process. Once the first of the data is populated into the
data warehouse, the data architect listens very carefully to the end user, mak-
ing adjustments to the data that has been populated. This means that the data
warehouse is in constant repair. During the early stages of the development,
repairs to the data warehouse are considerable. But as time passes and as the
data warehouse becomes stable, the number of repairs drop off.
Migration to the Architected Environment
295
Uttama Reddy
Uttama Reddy
The Data Warehouse
and the Web
CHAPTER
10
O
ne of the most widely discussed technologies is the Internet and its associated
environment-the World Wide Web. Embraced by Wall Street as the basis for the
new economy, Web technology enjoys wide popular support among business
people and technicians alike. Although not obvious at first glance, there is a
very strong affinity between the Web sites built by organizations and the data
warehouse. Indeed, data warehousing provides the foundation for the success-
ful operation of a Web-based ebusiness environment.
The Web environment is owned and managed by the corporation. In some
cases, the Web environment is outsourced. But in most cases the Web is a nor-
mal part of computer operations, and it is often used as a hub for the integration
of business systems. (Note that if the Web environment is outsourced, it
becomes much more difficult to capture, retrieve, and integrate Web data with
corporate processing.)
The Web environment interacts with corporate systems in two basic ways. One
interaction occurs when the Web environment creates a transaction that needs
to be executed-an order from a customer, for example. The transaction is for-
matted and shipped to corporate systems, where it is processed just like any
other order. In this regard, the Web is merely another source for transactions
entering the business.
297
Uttama Reddy
But the Web interacts with corporate systems another way as well—through
the collection of Web activity in a log. Figure 10.1 shows the capture of Web
activity and the placement of that activity in a log.
The Web log contains what is typically called clickstream data. Each time the
Internet user clicks to move to a different location, a clickstream record is cre-
ated. As the user looks at different corporate products, a record of what the
user has looked at, what the user has purchased, and what the user has thought
about purchasing is compiled. Equally important, what the Internet user has
not looked at and has not purchased can be determined. In a word, the click-
stream data is the key to understanding the stream of consciousness of the
Internet user. By understanding the mindset of the Internet user, the business
analyst can understand very directly how products, advertising, and promo-
tions are being received by the public, in a way much more quantified and much
more powerful than ever before.
But the technology required to make this powerful interaction happen is not
trivial. There are some obstacles to understanding the data that comes from the
Web environment. For example, Web-generated data is at a very low level of
detail-in fact, so low that it is not fit for either analysis or entry into the data
warehouse. To make the clickstream data useful for analysis and the ware-
house, the log data must be read and refined.
Figure 10.2 shows that Web log clickstream data is passed through software
that is called a Granularity Manager before entry into the data warehouse
environment.
A lot of processing occurs in the Granularity Manager, which reads clickstream
data and does the following:
■■
Edits out extraneous data
■■
Creates a single record out of multiple, related clickstream log records
CHAPTER 10
298
Figure 10.1 The activity of the Web environment is spun off into Web logs in records
called clickstream records.
TEAMFLY
Team-Fly
®
Uttama Reddy
■■
Edits out incorrect data
■■
Converts data that is unique to the Web environment, especially key data
that needs to be used in the integration with other corporate data
■■
Summarizes data
■■
Aggregates data
As a rule of thumb, about 90 percent of raw clickstream data is discarded or
summarized as it passes through the Granularity Manager. Once passed
through the manager into the data warehouse, the clickstream data is ready for
integration into the mainstream of corporate processing.
In summary, the process of moving data from the Web into the data warehouse
involves these steps:
■■
Web data is collected into a log.
■■
The log data is processed by passing through a Granularity Manager.
■■
The Granularity Manager then passes the refined data into the data
warehouse.
The way that data passes back into the Web environment is not quite as
straightforward. Simply stated, the data warehouse does not pass data directly
back into the Web environment. To understand why there is a less-than-straight-
forward access of data warehouse data, it is important to understand why the
Web environment needs data warehouse data in the first place.
The Web environment needs this type of data because it is in the data ware-
house that corporate information is integrated. For example, suppose there’s
The Data Warehouse and the Web
299
Data
Warehouse
GM
Figure 10.2 Data passes through the Granularity Manager before entering the data
warehouse.
Uttama Reddy
a Web site dedicated to selling clothes. Now suppose the business analyst
decides that it would be nice for a clothing customer become a customer for
other goods the business sells, such as gardening tools, sports gear, travel
accessories, and costume jewelry. The analyst might decide to initiate a spe-
cial promotion for fancy women’s dresses and upscale costume jewelry. But
where does the analyst turn to find which women customers have bought cos-
tume jewelry in the past? Why, naturally, he or she turns to the data ware-
house because that is where the historical information about customers is
found.
In another example, suppose the Web site is dedicated to selling cars. The ana-
lyst would really like to know who has purchased the brand of car the company
is selling. Where is the historical information of this variety found? In the data
warehouse, of course.
The data warehouse then provides a foundation of integrated historical infor-
mation that is available to the business analyst. This affinity between the data
warehouse and the Web is shown in Figure 10.3.
Figure 10.3 shows that data passes out of the data warehouse into the corporate
operational data store (ODS), where it is then available for direct access from
the Web. At first glance, it may seem odd that the ODS sits between the data
warehouse and the Web. There are some very good reasons for this positioning.
CHAPTER 10
300
Web environment
data warehouse
ODS
Figure 10.3 Data is passed to the ODS before it goes to the Web.
Uttama Reddy
The ODS is a hybrid structure that has some aspects of a data warehouse and
other aspects of an operational system. The ODS contains integrated data and
can support DSS processing. But the ODS can also support high-performance
transaction processing. It is this last characteristic of the ODS that makes it so
valuable to the Web.
When a Web site accesses the ODS, the Web environment knows that it will
receive a reply in a matter of milliseconds. This speedy response time makes it
possible for the Web to perform true transaction processing. If the Web were to
directly access the data warehouse, it could take minutes to receive a reply
from the warehouse. In the world of the Internet, where users are highly sensi-
tive to response time, this would be unacceptable. Clearly, the data warehouse
is not designed to support online response time. However, the ODS is designed
for that purpose. Therefore, the direct input into the Web environment is the
ODS, as seen by Figure 10.4.
At first glance it may seem that there is a lot of redundant data between the data
warehouse and the ODS. After all, the ODS is fed from the data warehouse.
(Note: The ODS being discussed here is a class IV ODS. For a complete descrip-
tion of the other classes of ODS, refer to my book Building the Operational
Data Store, Second Edition (Wiley, 1999).
But in truth there is very little overlap of data between the data warehouse and
the ODS. The data warehouse contains detailed transaction data, while the
ODS contains what can be termed “profile” data. To understand the differences
The Data Warehouse and the Web
301
Web environment
ODS
Figure 10.4 The ODS provides fast response time.
Uttama Reddy
be-tween profile data and detailed transaction data, consider the data seen in
Figure 10.5.
The data warehouse contains all sorts of transaction data about past interac-
tions between the customer and the business. Detailed transaction data includes
information about the following:
■■
Searches for men’s bicycles
■■
Searches for women’s red bathing suits
■■
Purchases of a women’s blue bathing suits
■■
Searches for Ray-Ban wraparounds
The data warehouse maintains a detailed log, by customer, of the transactional
interactions the customer has had with the business, regardless of the source of
the interaction. The interaction could have occurred on the Web, through a cat-
CHAPTER 10
302
Aug 13 entered as csmall, stayed 13 minutes
- looked at bicycles, mens
- looked at bathing suits, red
- looked at cat litter
Aug 15 entered as csmall, stayed 26 minutes
- looked at bathing suits, bikinis
- bought blue bathing suit
- looked at straw hats
- looked at sunglasses
Aug 15 entered as csmall, stayed 1 minute
- looked at Rayban wraparounds
Aug 21 entered as csmall, stayed 12 minutes
- looked at beach towels
- bought picnic basket
- looked at girls thong sandals
- looked at sun tan lotion
Aug 22 entered as csmall, stayed 24 minutes
- booked ticket to Bahamas
- sent flowers to significant other
last activity
Dec 13
activities
- surfing
- beach activities
- snorkeling
tastes
- bikinis
- Raybans
places
- Bahamas
- Hawaii
- Jamaica
marital status
- single
favorite stores
- Nordstroms
- Victoria's Secret
- GAP
profile data
historical data
ODS
data warehouse
Figure 10.5 The ODS and the data warehouse hold different kinds of data.
Uttama Reddy
alog order, through a purchase at a retail store, and so forth. Typically, the time
the interaction occurred, the place of the interaction, and the nature of the
transaction are recorded in the data warehouse.
In addition, the data warehouse contains historical data. The transactions that
are found in the data warehouse go back as far as the business analyst thinks is
useful-a year, two years, or whatever length of time makes sense. This integrated
historical data contains the raw transaction data with no intent to interpret the
data.
On the other hand, the ODS is full of interpretive data. Data has been read in the
data warehouse, analyzed, and turned into “profile” data, or profile records.
The profile records reside in the ODS. Figure 10.7 shows that a profile record
has been created based on reading all the historical, integrated data found in
the data warehouse. The profile record contains all sorts of information that is
created as a result of reading and interpreting the transaction data. For exam-
ple, for the customer shown for Figure 10.7, the profile record shows that the
customer is all of the following:
■■
A beach-oriented person, interested in surfing, sun bathing, and snorkeling
■■
Likely to travel to places like the Bahamas, Hawaii, and Jamaica
■■
Single
■■
An upscale shopper who is likely to frequent places such as Nordstrom,
Victoria’s Secret, and the Gap
In other words, the customer is likely to have the propensities and proclivities
shown in the profile record seen in Figure 10.7. Note that the customer may
never have been to Hawaii. Nevertheless, it is predicted that the customer
would like to go there.
To create the profile data from the transaction data, a certain amount of analy-
sis must be done. Figure 10.6 shows the reading of the transactional data in
order to produce profile data.
In Figure 10.6, the detailed integrated historical transaction data is read and
analyzed in order to produce the profile record. The analysis is done periodi-
cally, depending on the rate of change of data and the business purpose behind
the analysis. The frequency of analysis and subsequent update of the profile
record may occur as often as once a day or as infrequently as once a year. There
is wide variability in the frequency of analysis.
The analytical program is both interpretive and predictive. Based on the past
activity of the customer and any other information that the analytical program
can get, the analytical program assimilates the information to produce a very
The Data Warehouse and the Web
303
Uttama Reddy

