Báo cáo y học: "Autologous chondrocyte implantation for cartilage repair: monitoring its success by magnetic resonance imaging and histology" ppt
Bạn đang xem bản rút gọn của tài liệu. Xem và tải ngay bản đầy đủ của tài liệu tại đây (1.48 MB, 14 trang )
Arthritis Research and Therapy
Vol 5 No 1
Roberts et al.
Open Access
Research article
Autologous chondrocyte implantation for cartilage repair:
monitoring its success by magnetic resonance imaging and
histology
Sally Roberts1,2, Iain W McCall3,2, Alan J Darby4, Janis Menage1, Helena Evans1, Paul E Harrison5
and James B Richardson6,2
1Centre
for Spinal Studies, Robert Jones and Agnes Hunt Orthopaedic Hospital NHS Trust, Oswestry, Shropshire, UK
University, Keele, Staffordshire, UK
3Department of Diagnostic Imaging, Robert Jones and Agnes Hunt Orthopaedic Hospital NHS Trust, Oswestry, Shropshire, UK
4Department of Histopathology, Royal National Orthopaedic Hospital, Brockley Hill, Stanmore, Middlesex, UK
5Arthritis Research Centre, Robert Jones and Agnes Hunt Orthopaedic Hospital NHS Trust, Oswestry, Shropshire, UK
6Institute of Orthopaedics, Robert Jones and Agnes Hunt Orthopaedic Hospital NHS Trust, Oswestry, Shropshire, UK
2Keele
Corresponding author: S Roberts (e-mail: )
Received: 29 July 2002
Revisions received: 18 October 2002
Accepted: 23 October 2002
Published: 13 November 2002
Arthritis Res Ther 2003, 5:R60-R73 (DOI 10.1186/ar613)
© 2003 Roberts et al., licensee BioMed Central Ltd (Print ISSN 1478-6354; Online ISSN 1478-6362). This is an Open Access article: verbatim
copying and redistribution of this article are permitted in all media for any non-commercial purpose, provided this notice is preserved along with the
article's original URL.
Abstract
Autologous chondrocyte implantation is being used
increasingly for the treatment of cartilage defects. In spite of
this, there has been a paucity of objective, standardised
assessment of the outcome and quality of repair tissue formed.
We have investigated patients treated with autologous
chondrocyte implantation (ACI), some in conjunction with
mosaicplasty, and developed objective, semiquantitative
scoring schemes to monitor the repair tissue using MRI and
histology. Results indicate repair tissue to be on average
2.5 mm thick. It was of varying morphology ranging from
predominantly hyaline in 22% of biopsy specimens, mixed in
48%, through to predominantly fibrocartilage in 30%,
apparently improving with increasing time postgraft. Repair
tissue was well integrated with the host tissue in all aspects
viewed. MRI scans provide a useful assessment of properties
of the whole graft area and adjacent tissue and is a noninvasive
technique for long-term follow-up. It correlated with histology
(P = 0.02) in patients treated with ACI alone.
Keywords: cartilage repair, collagens, glycosaminoglycans histology, MRI
Introduction
There is a burgeoning interest in cartilage repair worldwide, with particular focus on tissue engineering and cellbased therapies. While much effort goes into developing
novel culture conditions and support mechanisms or scaffolds, autologous chondrocyte implantation (ACI) [1]
remains the most commonly used cell-based therapy for
the treatment of cartilage defects in young humans [2–4],
although no randomised trials have been completed as yet
[5]. Objective measures of the properties of the grafted
regions are necessary for long-term follow-up of this procedure and to evaluate how closely the treated region
resembles normal articular cartilage. Useful outcome mea-
R60
sures that assess the overall function, structure, and composition of chondral tissue [6] include mechanical properties or its appearance in arthroscopy, histology, and
magnetic resonance imaging (MRI), in addition to clinical
assessment of the patient. However, there has been little
standardisation of such outcome measures [7]. We have
therefore developed histological and MRI scoring
schemes and used them to assess the quality of repair
tissue at varying time points up to 34 months after the
grafting procedure. In addition, immunohistochemistry has
been used to assess whether the tissue in the grafted site
resembled normal articular cartilage, not only in its matrix
organisation but also in its chemical composition.
3D = three-dimensional; ACI = autologous chondrocyte implantation; H&E = haematoxylin and eosin; ICC = intraclass correlation; MOD = modified
O’Driscoll; MRI = magnetic resonance imaging; TE = echo time; TR = repetition time.
Available online />
Cartilage function reflects its biochemical composition
[8]. A small biopsy specimen such as is used for histochemical assessment can provide only limited information, as it is from a discrete location. MRI, in contrast,
can provide information on the whole area. In addition, it
is noninvasive and successive scans can be carried out,
so allowing longitudinal monitoring at different time
points. MR images have been shown to correlate with
biochemical composition in other tissues, in cartilage in
vivo, and even in engineered cartilage generated in a
bioreactor [9–11]. Thus in this study we have used both
forms of assessment of articular cartilage and correlated
them where they are available at the same time points
post-treatment. We have previously reported on the
immunohistochemical appearance of such biopsy specimens, but only on two individuals and at 12 months after
implantation [12]. Here we report on a much more extensive sample group, obtained up to 3 years after treatment, and compare histological assessments with those
obtained by MRI.
Materials and methods
Tissue biopsies
Patients receiving ACI in our centre undergo arthroscopic
assessment and biopsy of the treated region as part of
their routine follow-up at approximately 12 months postgraft. The taking of biopsies from grafted regions was
given ethical approval by Shropshire Research and Ethics
Committee and all patients gave fully informed consent.
Twenty-three full-depth cores of cartilage and subchondral bone were obtained from 20 patients (mean age
34.9 ± 9.2 years) who had undergone ACI [1,13]
between 9 and 34 months previously (mean 14.8 ±
6.9 months). Six of these patients had been treated with
ACI and mosaicplasty [osteochondral autologous transplantation (OATS)] combined, the rest with ACI alone. In
the majority of patients, the femoral condyle was treated
(11 medial, 6 lateral), in two the patella, and in one the
talus (Table 1). Cores (1.8 mm in diameter) were taken
from the centre of the graft region using a bone marrow
biopsy needle (Manatech, Stoke-on-Trent, UK). A
mapping system was used to ensure the correct location
[14]. The cores were taken as near to 90° to the articulating surface as possible. The exception was patient 2,
from whom the graft was taken obliquely in order to pass
through a mosaic plug. Cores were snap-frozen in liquidnitrogen-cooled hexane and stored in liquid nitrogen until
studied. ‘Control’ samples of articular cartilage and
underlying bone were obtained from three individuals, two
from ankles of patients (aged 10 and 13 years) with noncartilage pathologies and one from the hip (aged 6 years)
obtained at autopsy. Ideally, normal tissue would have
been taken that was matched for age and site, but unfortunately this was not available. In addition, meniscus from
a 74-year-old woman was examined as an example of
fibrocartilaginous tissue.
Magnetic resonance imaging
MRI was carried out before the follow-up arthroscopic
procedure during which the biopsy specimen was taken.
The following sequences were undertaken using a
Siemens Vision 1.5T scanner (Siemens, Erlangen,
Germany) with a gradient strength of 25 mT/m and
VB33A software:
1. T1 sagittal and coronal spin echo sequence. This provides information on the general anatomy of the joint, for
example, identifying abnormalities in the menisci, cruciate ligaments, or other joint components and the subchondral bone outline and underlying marrow signal
(repetition time [TR] = 722 ms; echo time [TE] = 20 ms;
field of view = 20 cm; slice thickness = 3/0.3 mm;
matrix 512 × 336; acquisition = 2).
2. A three-dimensional (3D) T1-weighted image with fat
saturation and a 30° flip angle. This provides information on the quality and thickness of the cartilage (TR =
50; TE = 11; flip angle = 30°; field of view = 18 cm;
matrix 256 × 192; number of excitations = 1; slab =
90 mm; partitions = 60 [i.e. each slice = 1.5 mm]).
3. A 3D dual excitation in the steady state sequence with
fat saturation. This demonstrates the surface characteristics of the cartilage and also highlights fluid in the joint
and oedema in the subchondral bone (TR = 58.6; TE =
9; flip angle = 40°; field of view = 18 cm; matrix 256 ×
192; number of excitations = 1; slab = 96 mm; partitions = 64 [i.e. each slice = 1.5 mm]; acquisition = 2).
The 3D images were acquired in the sagittal plane except
in the patients with patella grafts, when images were
acquired in the axial plane. These sequences allowed longitudinal study of the joint by comparison with previous
scans carried out preoperatively, when a more extensive
study also included obtaining a T2-weighted gradient echo
image in the sagittal and coronal planes and axial images
with spin echo sequences.
For the purpose of the present study, a semiquantitative
assessment has been developed, whereby each of four
features considered important to the quality of the repair
[15] are scored from the images. These can be seen in
Table 2, together with the scores attributed to each
feature. The scans were reviewed by one author, who was
unaware of the histological evaluation.
Histology
Frozen sections 7 µm thick were collected onto poly-Llysine-coated slides and stained with haematoxylin and
eosin (H&E) and safranin O (0.5% in 0.1-M sodium acetate,
pH 4.6, for 30 s) for general histology, measurement of cartilage thickness, and assessment of metachromasia. Cartilage thickness was measured as the perpendicular
distance between the articular surface and the junction
with the subchondral bone, thus eliminating errors that
could occur in tangential biopsies. Sections were viewed
R61
Arthritis Research and Therapy
Vol 5 No 1
Roberts et al.
Table 1
Details of individuals from whom biopsy specimens were obtained and their histology and MRI scores
Patient
and
sample
no.
Patient’s
age at
ACI
(years)
1
20
2
20
3
25
4
28
5
Sex
Interval
between
graft and
biopsy
(months)
M
Treatment
Location of
defect or
tissue
source
OsScore
(maximum
10)
MOD
score
(maximum
23)
MRI
score
(maximum
4)
Cartilage
type
Thickness
(mm)
11
M & ACI
MFC
9.5
21.2
1
H
3.2
F
11
M & ACI
LFC
7.0
18.3
1
H/F
1.4
M
16
ACI
LFC
4.7
14.3
0.5
F
6.2
M
12
ACI*
MFC
5.0
14.1
1
F
4.2
28
M
20
MFC
8.7
17.5
N/A
H/F
1.0
6
28
M
34
MFC
7.8
15.6
0
H
2.3
7
28
F
12
ACI
MFC
7.0
17.8
3
H/F
> 2.5
8
28
M
11
ACI
MFC
6.0
16.3
3.5
H/F
3.0
9
29
M
12
ACI
MFC
6.3
16.8
2
H/F
> 0.8
10
32
M
9
ACI
patella
4.0
7.2
2
F
1.8
11
32
M
12
ACI*
MFC
7.2
16.3
3
H/F
5.3
12
32
M
30
MFC
8.0
18.5
1.5
H/F
3.3
13
33
M
12
ACI
MFC
5.8
14.8
5
H/F
2.5
14
35
F
9
ACI
MFC
2.5
6.9
1
F
3.3
15
38
F
14
ACI
MFC
8.0
18.7
2
F
1.1
16
39
M
12
ACI
MFC
7.9
17.5
3
H/F
4.3
17
39
M
12
M & ACI
talus
9.7
20.2
0
H
>1.7
18
39
M
14
M & ACI
LFC
4.7
14.9
0
H/F
>1.0
19
41
M
12
ACI
LFC
5.8
16.2
2
F
1.1
20
42
F
12
M & ACI
LFC
7.6
17.9
3.5
H
1.6
21
45
F
12
M & ACI
patella
4.0
5.0
0
H/F
1.4
22
52
M
30
ACI*
LFC
9.7
18.1
2
H
1.6
23
53
F
12
ACI
MFC
5.2
14.8
4
F
2.0
24
6
F
n/a
Control
femoral head
9.2
18.6
H
2.3
25
10
F
n/a
Control calcaneocuboid
joint, ankle
9.3
21.0
H
1.5
26
13
M
n/a
Control
talonavicular
joint, ankle
9.8
22.8
H
1.5
27
74
F
n/a
Control
meniscus
F
*ACI carried out with cells grown in Carticel™; all others utilised OsCells, so-called because they were prepared in the laboratory in Oswestry.
ACI, autologous chondrocyte implantation; F, fibrocartilage-like; H, hyaline-like; LFC, lateral femoral condyle; M, mosaicplasty; MFC, medial femoral
condyle; MOD, modified O’Driscoll; MRI, magnetic resonance imaging; n/a not applicable; N/A not available.
with standard and polarised light and images captured and
digitised using a closed-circuit television and Image
Grabber software (Neotech Ltd, Hampshire, UK).
R62
A semiquantitative scoring system, the OsScore – so
called because it originated in the laboratory in Oswestry
(Table 3) – was devised, in which the following parame-
ters were assessed: the predominant cartilage type
present, the integrity and contour of the articulating
surface, the degree of metachromasia with safranin O
staining, the extent of chondrocyte cluster formation, the
presence of vascularisation or mineralisation in the repair
cartilage, and the integration with the calcified cartilage
and underlying bone. The scores attributed to each of
Available online />
Table 2
Features assessed for magnetic resonance image score
Feature
Score
Surface integrity and
contour
1 = normal or near normal, 0 = abnormal
Cartilage signal in
graft region
1 = normal or near normal, 0 = abnormal
Cartilage thickness
1 = normal or near normal, 0 = abnormal
5. Vascularisation and mineralisation are both included as
negative features, because they are not present in
normal articular cartilage, but there is concern that they
result from the periosteum used in the ACI procedure.
6. Integration to adjacent host tissue is of course an
important feature, and therefore ‘vertical’ integration to
the underlying bone is included.
Changes in underlying bone 1 = normal or near normal, 0 = abnormal
Maximum total possible
4
Table 3
Histological features measured for OsScore
Feature
Score
Tissue morphology
Hyaline = 3
Hyaline/fibrocartilage =2
Fibrocartilage =1
Fibrous tissue =0
Matrix staining
Near normal =1
Abnormal =0
Surface architecture
Near normal =2
Moderately irregular =1
Very irregular =0
Chondrocyte clusters
None =1
≤ 25% cells = 0.5
> 25% cells = 0
Mineral
Absent =1
Present = 0
Blood vessels
Absent = 1
Present = 0
Basal integration
Good = 1
Poor = 0
Maximum total possible
10
these parameters can be seen in Table 3. These properties were chosen for several reasons:
1. Morphology is thought to influence mechanical functioning of the tissue and is often of most interest to
observers.
2. A smooth surface is important for articulation and in
the transfer of incident loads throughout the underlying
cartilage.
3. Metachromasia relates to proteoglycan content and
hence load-bearing properties.
4. Clusters of chondrocytes in osteoarthritis are a negative feature associated with degeneration.
Tissue type was categorised as predominantly (i.e. > 60%)
hyaline cartilage, predominantly (> 60%) fibrocartilage,
mixed (when there was a significant proportion of both
hyaline and fibrocartilage present), or fibrous tissue. The
tissue was classified as hyaline when it had the following
properties: the extracellular matrix had a glassy appearance
when viewed with polarised light, and the cells had a chondrocytic morphology, i.e. were oval, often with a pericellular
capsule or lacuna apparent. In contrast, tissue was classified as fibrocartilage when bundles of collagen fibres were
randomly organised and the cells were more elongated and
often more numerous. Vascularisation and mineralisation
were identified on H&E-stained sections, mineralisation
being confirmed where necessary with von Kossa stain.
For comparison with the OsScore, sections were scored
using a modified O’Driscoll score (MOD; www.pathology.
unibe.ch/Forschung/osteoart/osteoart.htm#project3), selecting the properties that it was possible to measure on isolated
biopsy specimens. All samples were scored independently
by three observers for both scoring systems. In both
scoring systems, a high score indicates a good graft.
Immunohistochemistry
Immunostaining was carried out using monoclonal antibodies against collagens type I (clone no. I-8H5; ICN), II (CIICI,
Developmental Studies Hybridoma Bank, Ohio, USA), III
(clone no. IE7-D7; AMS Biotechnology Ltd, Abingdon, UK),
and X [16]. A polyclonal antibody to type VI collagen was
used [17]. Monoclonal antibodies against the glycosaminoglycans chondroitin-4-sulfate (2-B-6) [18], chondroitin-6sulfate (3-B-3 [19] and 7-D-4 [20]), and keratan sulfate
(5-D-4) [21] and against the hyaluronan-binding region on
the aggrecan core protein (1-C-6) [22] were used.
Before immunolabelling, sections were enzymatically
digested with hyaluronidase or chondroitinase ABC to
unmask the collagen and proteoglycan epitopes, respectively [23,24], except for the unusually sulfated chondroitin-6-sulfate epitopes, 3-B-3(–) and 7-D-4, which had
no pretreatment. Sections were fixed in 10% formalin
before incubation with the primary antibody (before the
enzyme digestion, in the case of the proteoglycan antibodies). Endogenous peroxidase was blocked with 0.3%
hydrogen peroxide in methanol. Labelling was visualised
with peroxidase and the chromagen diaminobenzidine as
the substrate, with avidin–biotin complex (Vector Laboratories, Peterborough, UK) being used to enhance labelling
of monoclonal antibodies.
R63
Arthritis Research and Therapy
Vol 5 No 1
Roberts et al.
Table 4
Summary of scores according to morphology of cartilage
Cartilage type
Number
Time point
post ACI (months)
Thickness
(mm)
OsScore
MOD score
MRI score
In graft patients
Hyaline-like
5
19.8 ± 11.2
2.1 ± 0.7
8.9 ± 1.1
18.6 ± 2.2
1.3 ± 1.5
H/F mixed
11
14.4 ± 5.8
2.4 ± 1.5
6.6 ± 1.4
15.8 ± 3.8
1.8 ± 1.1
Fibrocartilage-like
7
12.0 ± 2.5
2.8 ± 1.9
5.0 ± 1.7
13.2 ± 4.5
1.6 ± 1.6
1.8 ± 0.5
9.4 ± 0.3
20.8 ± 2.1
In controls
Hyaline-like (except fibrocartilage meniscus)
3
N/A
ACI, autologous chondrocyte implantation; H/F, hyaline/fibrocartilage; MOD, modified O’Driscoll; MRI, magnetic resonance imaging; N/A, not
available; OsScore, score devised in the laboratory in Oswestry.
Statistics
Nonparametric tests, the Mann–Whitney U test and
Spearman rank correlations, were carried out using the
Astute software package (Analyse-it Software Ltd, Leeds,
UK). Intraclass correlation coefficients (ICC 2,1) were calculated to assess the reproducibility of the histology
scoring systems by independent observers [25].
Results
Graft morphology and histology scores (Table 4)
The thickness of the cartilage in the patient biopsy specimens ranged from approximately 0.8 mm to 6.2 mm
(mean 2.5 ± 1.5 mm), whereas in the control samples it
was 1.8 ± 0.5 mm (range 1.1–2.1 mm). The cartilage
morphology was predominantly hyaline (> 90%) in five of
the biopsy specimens and predominantly fibrocartilage in
seven, and the remaining 11 biopsy specimens had areas
with both hyaline and fibrocartilage morphology (‘mixed’).
The controls, in contrast, were all of hyaline morphology
except for their fibrocartilaginous meniscus. The histology
scores ranged from 2.5 to 10 (OsScore) and from 6 to
22 (MOD), with the mean OsScores being 8.9, 6.6, and
5.0 for hyaline, mixed, and fibrocartilaginous morphologies, respectively (see Table 4). Mean MOD scores were
18.6, 15.8, and 13.2 for these groups. There was a correlation (r = 0.9, P < 0.001) between the two scoring
systems for all the 26 cartilage samples. Consistency of
scoring between the three observers was higher for the
OsScore (ICC = 0.77) than for the MOD score (ICC =
0.52) and the OsScore had an intraobserver error of 6%
coefficient of variance. The mean thicknesses for the
hyaline, mixed-morphology, and fibrocartilage cores were
2.1, 2.4, and 2.8 mm, respectively (see Table 4). The
mean interval between graft and biopsy for the three
groups ranged from 19.8 months to 12.0 months (see
Table 4).
R64
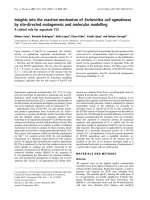
Integration of tissue in the grafted region with adjacent
tissue appeared complete as far as could be assessed.
Certainly ‘vertical integration’ looked good, with continuous fibres usually visible from the noncalcified cartilage
through the calcified cartilage to the underlying bone
(Fig. 1a,b). Lateral integration is more difficult to assess in
small biopsy specimens such as those used in this study.
However, in one patient treated with ACI and mosaicplasty combined, a specimen was taken obliquely. The
morphology of the core suggests that it included a transplanted mosaic plug that was clearly hyaline and adjacent
repair tissue that was fibrocartilaginous (Fig. 1c–g). The
interface between these two regions, however, was fully
integrated, as seen both in polarised light and on
immunostaining for collagens (Fig. 1c–g).
MRI
The mean time in days between biopsy and MRI scan was
15.5 ± 12.3 days, apart from two samples for which there
were intervals of 76 and 110 days.
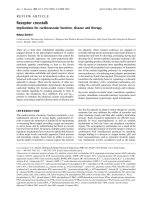
On MRI, the thickness of the graft cartilage appeared the
same as that of the adjacent cartilage in 68% of patients.
The surface of the articular cartilage was smooth in 26%
of patients (Fig. 2) and the remaining 74% showed some
unevenness, irregularity, or overgrowth at the surface.
Seven patients had subchondral cysts evident on their
MRI scans, two of them having been treated with mosaicplasty and ACI combined. The cyst in one patient was
obvious preoperatively and so was known to be unrelated
to the ACI procedure. Five of the six patients treated with
ACI and mosaicplasty combined scored 0 for the bone
parameter. In some patients, artefacts were visible, for
example, from previous interventions, but none affected
the assessment of the graft region in this study. There
were instances of all MRI scores possible (up to a
maximum of 4) but there was no general trend with
respect to cartilage morphology group (see Table 4).
When all the samples were considered together, there
was no significant correlation between the MRI score and
the histology scores obtained at the same (or similar) time
Available online />
Figure 1
Integration between repaired cartilage and underlying bone, seen particularly clearly when a section stained with H&E (a) is viewed with polarised
light (b) (sample 4). (c) An oblique section from the surface zone (S) through hyaline cartilage of the mosaic plug (H) to fibrocartilage matrix (F),
immunostained for type II collagen. (d) H&E-stained higher power of the junctional zone (B, underlying bone) and (e) the same section viewed with
polarised light. Full integration can be seen across this zone in sections immunostained for (f) type I and (g) type II collagen (sample 2).
H&E, haematoxylin and eosin.
point. However, if samples from patients with combined
ACI and mosaicplasty were excluded and only those from
patients treated with ACI alone were considered, there
was a significant correlation (r = 0.6021, P = 0.02,
n = 14) between their MRI scores and OsScores. The
individuals treated with ACI and mosaicplasty combined
had lower MRI scores (mean 0.9 ± 1.4) than those treated
with ACI alone (mean 2.0 ± 1.1), the overall mean for all
patients being 1.7 ± 1.2.
Immunohistochemistry
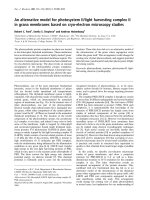
Staining for type II collagen was positive in all specimens
with hyaline morphology, although sometimes the uppermost layer (up to 300 µm) was negative. In most specimens with mixed or fibrocartilage morphology, 50% or
more of the matrix was positive (Fig. 3; Table 5). There
were few exceptions to this, with two fibrocartilage specimens being totally negative for type II collagen. Type I collagen immunostaining was seen in all samples but was
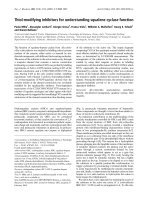
more variable than for type II collagen. In the fibrocartilagelike samples, the staining was widespread throughout the
matrix, whereas in those with hyaline morphology, its distribution was discrete and usually restricted to the very
uppermost region, approximately 250 µm thick for the
specimens from ACI-treated patients (Fig. 4). Staining for
type X collagen occurred in 62% of samples, but when
present it was only in small areas, usually in and around
cells in the deep zone, close to the calcified cartilage or
bone and the tidemark (Fig. 5). There was immunostaining
for collagen types III and VI in all samples studied except
for one, which was negative for type VI collagen. The distribution, however, differed markedly depending on the
morphology of the matrix. In fibrocartilage, staining for collagen types III and VI was homogeneous throughout,
whereas in hyaline cartilage it was clearly cell-associated,
staining the cell and pericellular matrix but not the interterritorial matrix (Fig. 6).
Of the proteoglycan components, the strongest staining
was for chondroitin-4-sulfate (with 2-B-6), which was
throughout virtually all the matrices. Staining for the
keratan sulfate epitope (with 5-D-4) was also common,
particularly in hyaline cartilage. For the chondroitin-6sulfate epitope (stained with 3-B-3), however, the distribution was often as for types III and VI collagens,
predominantly homogeneous in fibrocartilage but more
cell-associated in the hyaline cartilage. There was much
less staining for the unusually sulfated chondroitin-6sulfate epitopes, with 7-D-4 and, especially, 3-B-3(–),
which was seen only occasionally; when present, it tended
to be cell-associated in the hyaline regions (Fig. 7).
Hyaline ‘control’ cartilage was immunopositive virtually
throughout for type II collagen, negative regions, if any,
being restricted to a very thin strip (< 50 µm) at the
surface and the underlying bone (Fig. 8). The opposite
was true for type I collagen, being negative apart from the
bone and sometimes a very thin layer at the surface (see
Fig. 8). Staining for types III and VI collagens was cellassociated and for type X collagen was restricted to the
R65
Arthritis Research and Therapy
Vol 5 No 1
Roberts et al.
Figure 2
Use of MRI after ACI in joints. (a) The status of the whole knee (sample 7, sagittal T1-weighted spin echo, TR = 722, TE = 20, field of view =
20 cm). (b) Cartilage surface congruity and cartilage overgrowth (arrowhead, sample 3) and (c) cartilage filling a subchondral defect (arrowhead,
sample 7) can be identified on 3D T1-weighted images with fat suppression. Similarly, the images can demonstrate changes in the bone, whether
uneven bone profile (b) (dotted arrow), cysts in the underlying subchondral bone (d,e) (arrowheads), or artefacts (b) (asterisk). MRI is particularly
suitable for longitudinal study of grafts such as can be seen in (d) and (e), which were taken at, respectively, 6 and 30 months after ACI treatment
(sample 22, 3D dual excitation in the steady state with fat suppression). 3D, three-dimensional; ACI, autologous chondrocyte implantation;
MRI, magnetic resonance imaging; TE, echo time; TR, repetition time.
Figure 3
Immunohistochemical study of type II collagen after autologous chondrocyte implantation. Type II collagen is seen throughout most hyaline-like
repair tissue (c), as identified on an adjacent section stained with H&E (a) and viewed with polarised light (b), showing zonal matrix organisation
similar to that seen in normal adult articular cartilage in the surface (S), mid (M), and deep (D) zones (sample 22). In (c), note the lack of staining for
type II collagen both at the surface (N) and in the bone (B). Samples with a mixed morphology (d–f) (sample 16) and some with a fibrocartilage
morphology were mostly stained positively for type II collagen also, whereas a few fibrocartilagenous biopsy specimens (g) (sample 14) were
negative for type II collagen (h). H&E, haematoxylin and eosin.
R66
deep zone and tidemark, except in sample 24, which had
slight staining in the upper surface zone. The glycosaminoglycan epitopes that stained most strongly were keratan
sulfate and chondroitin-4-sulfate. Less staining was seen
for chondroitin-6-sulfate, with very slight staining for the
unusually sulfated epitope, demonstrated with 7-D-4. The
Available online />
Table 5
Summary of immunohistochemistry results demonstrating how the distribution of different epitopes varies with morphology,
ranging from normal articular cartilage through to fibrocartilage
Collagen or
glycosaminoglycan epitope
‘Normal’
articular
cartilage
Hyaline-like
repair
tissue
Hyaline/
fibrocartilage
repair
tissue
Fibrocartilagelike
repair
tissue
Meniscus
(fibrocartilage)
Collagen
I
–
–
–/+
+
++
II
++
++
+
+
+/–
III
+pc
+pc
+pc/+
+
++
VI
+pc
+pc
+pc/+
+
+pc
X
+pc
+pc
+pc/–
–
–
Chondroitin-4-sulfate: (2-B-6)
++
++
+
+
++
Chondroitin-6-sulfate: (3-B-3)
+
++pc
+pc/(+)
++
+
(+)/–
(+)/–
+/–
(+)/–
–
+
(+)
–/(+)
–
–
++
+(+)
+/(+)
+
(+)
Glycosaminoglycan
Chondroitin-6-sulfate: (3-B-3(–))
Chondroitin-6-sulfate: (7-D-4)
Keratan sulfate: (5D4)
– None or negligible (5% of section area); (+) slight; + some; ++strong; pc pericellular.
Figure 4
Immunostaining for type I collagen after autologous chondrocyte implantation.Type I collagen was restricted primarily to the upper region (arrow)
and bone (B) in hyaline-like cartilage (a) (sample 22) but was more widespread where the morphology was mixed (b) (sample 16) or particularly
when it was fibrocartilaginous (c) (sample 14).
meniscus, in contrast, had much staining for types I and III
collagens, patchy staining for type II collagen, and a little
for type VI collagen. Most glycosaminoglycan staining was
for chondroitin-4-sulfate, with less for keratan sulfate than
other samples, and no staining with antibodies 3-B-3(–) or
7-D-4 present.
Discussion
Although ACI has been carried out as a treatment for
cartilage defects for 14 years [26], there remains much
discussion about the efficacy of the procedure, despite
74–90% of patients having good to excellent results
clinically in a 2–10-year follow-up study of more than
200 patients [27]. Objective outcome measures are
required to assess any form of treatment and to date
there is a substantial lack of information on the biochemical nature of cartilage repair tissue [28]. We have used
MRI and histology as a means of assessing the quality of
repair tissue in patients treated with ACI, sometimes in
conjunction with mosaicplasty. In an attempt to render
the observations more objective and, to some extent,
quantitative, we have designed scoring systems specifically for patients who have had cartilage repair. Immunohistochemistry has been used to facilitate some
assessment of the biochemical components within the
repair tissue.
R67
Arthritis Research and Therapy
Vol 5 No 1
Roberts et al.
Figure 5
Immunostaining for type X collagen after autologous chondrocyte
implantation. Staining was typically seen around the cells in the deep
zone (arrows) and calcified cartilage (sample 16).
Many histological scoring systems have been published,
but these have primarily been designed for animal studies
of cartilage repair in rabbits [29–35] or dogs [36]. The
scores assess parameters such as cell and tissue morphology, degree of chondrocyte clustering, surface regularity, structural integrity, thickness, metachromasia,
bonding to adjacent cartilage, filling of the defect, and
degree of cellularity. Some of these parameters can be
assessed only on whole joints, which are commonly available in the animal models but not appropriate for humans.
Here, where histological examination is carried out on
biopsy specimens of the repair tissue, these specimens
must be as small as possible and usually obtained only at
one time point (thereby having certain inherent limitations,
e.g. only representing a small area at one location within
the treated area). Scoring systems for human tissue have
been published, but these have, in the main, been devised
for studies on osteoarthritis [37,38]. Hence many of the
parameters assessed, such as growth of pannus, may be
inappropriate for cartilage repair. Thus, in this study we
have devised a histology score specifically for small, discrete biopsy specimens obtained from human patients
undergoing treatment to induce repair of cartilage. We
have identified characteristics that, in our opinion, are
important to monitor and assess the quality of repair
tissue. These include features such as the presence of
blood vessels or mineralisation, in addition to the more
obvious parameters such as integration with the underlying bone and tissue morphology. Other features should
perhaps be considered for inclusion in the assessment
procedure, such as the predominant type of collagen
present or whether a higher degree of matrix organisation
is present; i.e. whether hyaline cartilage has developed the
zonal organisation typical of adult articular cartilage. While
the latter is easily identifiable and could be included in the
scoring scheme, the former is not necessarily routinely
available in all support laboratories.
Nonetheless, it was felt to be of some benefit to compare
the purpose-devised scoring system to one previously
devised and described in the literature. Therefore, a
scoring system used by many groups researching cartilage repair was chosen: the modified O’Driscoll (MOD)
score. This utilises parameters identified by O’Driscoll et
al. [29] in their study of periosteal grafts to treat cartilage
defects in rabbits. The correlation between the modified
Figure 6
Immunostaining for type III collagen after autologous chondrocyte implantation. The distribution of type III collagen was predominantly pericellular in
hyaline-like cartilage (a) (sample 22) and (b) (H) (sample 2), whereas in specimens with a more fibrocartilaginous morphology (b) (F) (sample 2)
and (c) (sample 15), it was predominantly homogeneous throughout the extracellular matrix.
R68
Available online />
Figure 7
Immunostaining for glycosaminoglycan epitopes after autologous chondrocyte implantation. Staining was stronger for chondroitin-4-sulfate (2-B-6)
(a), chondroitin-6-sulfate (3-B-3) (b), and keratan sulfate (5-D-4) (d) than for the abnormally sulfated chondroitin-6-sulfate epitopes, 3-B-3(–) (c)
(sample 6). C-4-S, chondroitin-4-sulfate; C-6-S, chondroitin-6-sulfate; K-S, keratan sulfate.
Figure 8
Typical staining and immunostaining patterns for control cartilage. Haematoxylin and eosin (a), type II collagen (b), type I collagen in the surface
zone (c) and the deep zone (d) and type X collagen (e). B, bone; CC, calcified cartilage.
O’Driscoll score (but restricted to the parameters that
could be assessed on small core biopsy specimens) and
the OsScore was reasonable (r = 0.91, P = 0.0001,
n = 26) and they could be deemed to achieve their
purpose, in that control samples of ‘normal’ hyaline tissue
scored 94 ± 3% of maximum for OsScore and 90 ± 9%
for the MOD score. However, all three observers found
the OsScore much easier, quicker, and more reproducible
to use.
Other workers have reported that hyaline cartilage is often
formed in people treated by ACI [26,27]. In the present
study, three of the five samples showing hyaline cartilage
morphology were from individuals treated with ACI and
mosaicplasty combined. If the biopsy specimen was taken
through a transplanted mosaic plug (which makes up
approximately 80% or more of the treated area), one
would expect it to be hyaline cartilage. The other two
specimens that were hyaline cartilage were both obtained
much longer after the ACI treatment (30 and 34 months)
than 16 of the 17 other cores. In addition, the average
time interval between graft and biopsy was greatest for
biopsies of hyaline morphology (19.8 months) and least
for those of fibrocartilage morphology (12.0 months). This
suggests that the cartilage that forms initially is often more
fibrocartilaginous but may transform with time to remodel
to form hyaline cartilage, possibly in response to loading.
The appearance of zonal organisation (sample 22) typi-
R69
Arthritis Research and Therapy
Vol 5 No 1
Roberts et al.
cally found in normal adult articular cartilage suggests that
this technique can indeed lead to regeneration of articular
cartilage and may not require the use of a scaffold as is
necessary in animal models [39].
The most ubiquitous type of collagen in normal adult articular cartilage is type II [40], both in calcified and uncalcified tissue [41]. The fact that this was commonly found in
all but two samples of repair tissue in the present study is
encouraging, even though production of type II collagen is
not exclusive to hyaline cartilage and is also produced by
some fibrocartilages such as the intervertebral disc [42].
The other collagen types examined in the present study
(types I, III, VI, and X) have all been described in normal
articular cartilage [40,43]. Collagen types III and VI are
typically pericellular, particularly in the deep zone [43,44]
as was found in hyaline cartilage in the biopsy specimens
in the present study. Type I collagen has also been
reported in articular cartilage: in the normal tissue it is
usually restricted to the upper surface layer and the bone,
similar to that found in the control samples (see Fig. 8).
Similarly, type X collagen has been found in normal articular cartilage, predominantly in the deep zone and sometimes in the surface layer [45]. All of these collagen types
– I, III, VI, and X – have been reported to occur at
increased levels in diseased cartilage such as osteoarthritis [44,46,47]. The presence of type X collagen is considered by some people to be undesirable as it is found in the
growth plate, for example, in the hypertrophic zone, which
goes on to calcify. However, it is also found in extracellular
matrices in cartilage [45] and intervertebral disc [48],
which do not often proceed to mineralisation.
Chondroitin sulfate and keratan sulfate glycosaminoglycans are typically found in both articular cartilage [49] and
fibrocartilage [50], their distribution and intensity varying
with age and stage of development. The presence of 7-D4 in ‘control’ hyaline cartilage seen here is likely to reflect
the youth of the control subjects, as other studies have
shown this and other abnormally sulfated chondroitin-6sulfate epitopes to be expressed in developing and
growing articular cartilage [51]. Lin et al. [52] found the
expression of 7-D-4 to be greatest of all the proteoglycan
epitopes in repair tissue in animal models of cartilage
repair. They found it was able to differentiate repair hyaline
tissue from both normal and fibrous repair tissue. Certainly
in the present study there was no staining with the antibody 7-D-4 in totally fibrocartilaginous samples (either the
ACI biopsy specimens or the meniscus).
R70
MRI is considered by some to be the optimal modality for
assessing articular cartilage [11,53], being able to evaluate the volume of repair tissue filling the cartilage defect,
the restoration of the surface contour, the integration of
the repair tissue to the subchondral plate, and the status
of the subchondral bone [11]. MRI can reliably detect
overgrowth or hypertrophy or graft delamination. It can
also detect oedema-like signal in the marrow underlying
the autologous chondrocyte repair. The significance of
these marrow changes has yet to be clarified, but persistent or increasing oedema-like signal may indicate that the
repair tissue is failing.
The use of MRI is limited to some extent, however, by the
lack of standardisation and consensus on which
sequences should be used [11]. 3D fat-suppressed echo
MRI sequences provide a high contrast-to-noise ratio
between cartilage and subchondral bone [54,55], thus
allowing the interface to be clearly assessed. MRI has
been shown previously to correlate with cartilage histology
[55]. 3D requires a gradient echo sequence and thus
there is an increase in the potential for susceptibility artefacts in the follow-up studies; consequently, there is a
compromise between the greater degree of resolution
obtained in such 3D sequences and the increase in
obvious postoperative artefacts. This is of particular relevance in this group of patients, because so many of them
have had previous surgical procedures.
The grading scheme used for the MR changes in this
study is at best only semiquantitative and may oversimplify
and lose information that could be obtained by more
sophisticated analysis. Fifty percent of patients had had
between one and five procedures on their knee before
undergoing ACI grafting. This will obviously influence the
MRIs of that joint, often rendering their interpretation more
difficult – for example, in defining the edge of the graft to
assess the degree of overgrowth or incorporation. The
fact that the MRI scores were lower for the patients
treated with ACI and mosaicplasty combined almost certainly reflects more interference within the joint for these
patients than occurred in patients treated using ACI only.
Patients with mosaicplasty as part of their treatment would
generally only score 75% of maximum, as they would
usually score zero on the subchondral bone parameter.
Several animal studies on ACI have shown that while relatively good cartilage forms initially, it often breaks down
and degenerates with time. For example, in dogs [36], the
remodelling phase at 3–6 months is followed by a
degradative phase, during which the repair tissue and surrounding cartilage appear to become progressively
damaged. Results from our studies suggest the opposite
may be true in humans treated with ACI, in whom the
repair tissue appears to ‘mature’ with increasing time and
tend more towards hyaline cartilage than fibrocartilage
[56]. This is similar to the impression obtained from clinical results in long-term follow-up of patients, up to
10 years after ACI [26]. Why there should be this apparent difference in progression between animals and
humans is unclear. One common finding in animal studies,
however, is delamination of repair tissue from the sur-
Available online />
rounding ‘native’ or original cartilage with time [57]. One
can imagine that if this occurs, it can only deteriorate
further with movement and may be the cause of the subsequent failure of the graft tissue. Observations on patients
treated with ACI in this study, and others within our
centre, indicate that there is good integration between
native and repair tissue. Certainly histological examination
demonstrates that the cartilage integrates fully with the
underlying bone. Lateral integration is not assessed routinely by the histological samples, because they are taken
from the centre of the graft region. However, in the single
case where a sample was taken obliquely in a patient
treated with ACI and mosaicplasty combined, this showed
complete integration across all regions of the sample (see
Fig. 1). Lateral integration appears to be good generally, at
least in the surface layers, when ascertained by its appearance and resistance to probing at arthroscopy (JB
Richardson, unpublished observation).
Why integration might be more successful in humans than
other species is unclear. Several factors may contribute,
such as the way certain aspects of the procedure are performed – for example, where and how the periosteum is
obtained or fixed in place. Alternatively, the type or amount
of loading and mobilisation post-treatment may prove to be
influential. For example, limited mobilisation, which may be
easier to control in patients than in animal models, may be
important immediately postoperation in allowing protection
of the surgical site in the early weeks. In addition, cells can
be mechanically induced to transfer from fibroblastic to
chondrocytic cells, at least in tendon [58], and synthesis of
proteins and proteoglycans by cartilage cells is inhibited by
static compression but not by intermittent loading [59].
Other, more basic, differences between animal species
and mankind may be important, such as variations in cartilage thickness, cellularity, or mechanical properties [6].
In summary, we have used histology and MR imaging in an
attempt to assess objectively the quality and hence
success of ACI in eliciting repair of articular cartilage.
Despite more than 6000 ACI procedures being carried
out worldwide, the understanding of the biology of cartilage repair remains poor. Further long-term study of
patients treated with ACI, together with the use of objective outcome measures, should improve this understanding, and is vital in allowing comparison of the long-term
success of this technique with others such as debridement and subchondral drilling for the treatment of cartilage
defects. It is only after true objective and scientific study
[7] or after the completion of randomised trials [5] that
informed judgements on the effectiveness of ACI can be
made. In addition, establishing objective, standarised
outcome measures will be important to compare and
assess future generations of treatment regimes incorporating scaffolds and support matrices, or other, more
advanced, tissue-engineered therapies.
Conclusion
Treatment of cartilage defects can result in repair tissue of
varying morphology, ranging from predominantly hyaline
(22% of biopsy specimens), through mixed (48%), to predominantly fibrocartilage (30% of specimens). Repair
tissue averaged 2.5 mm in thickness and appeared to
improve with increasing time postgraft. It was well integrated with the host tissue in all aspects viewed. In
patients treated with ACI alone, there was a correlation
between the histology and MRI scores (P = 0.02). We
suggest that MRI provides a useful assessment of properties of the whole graft area and adjacent tissue and is a
noninvasive technique for long-term follow-up.
Acknowledgements
We are grateful to Drs S Ayad, Manchester, and A Kwan, Cardiff, for the
provision of antibodies to collagen types VI and X, respectively; to Professor B Caterson, Cardiff, for all the proteoglycan antibodies; to Mrs
Janet Gardiner, Department of Diagnostic Imaging, Robert Jones and
Agnes Hunt Orthopaedic Hospital NHS Trust, Oswestry; to Dr J
Herman Kuiper for statistical advice; and to other members of OsCell (B
and IK Ashton, A Bailey, N Goodstone, D Rees, S Roberts, S Roberts,
R Spencer Jones, J Taylor, S Turner, L van Niekerk). The Arthritis
Research Campaign has generously provided financial support.
References
1.
2.
3.
4.
5.
6.
7.
8.
9.
10.
11.
12.
13.
14.
Brittberg M, Lindahl A, Nilsson A, Ohlsson C, Isaksson O, Peterson L: Treatment of deep cartilage defects in the knee with
autologous chondrocyte transplantation. N Engl J Med 1994,
331:889-895.
Bentley G, Minas T: Treating joint damage in young people.
BMJ 2000, 320:1585-1588.
Buckwalter JA: Articular cartilage: injuries and potential for
healing. J Orthop Sports Phys Ther 1998, 28:192-202.
Minas T, Nehrer S: Current concepts in the treatment of articular cartilage defects. Orthopedics 1997, 20:525-536.
Jobanputra P, Parry D, Fry-Smith A, Burls A: Effectiveness of
autologous chondrocyte transplantation for hyaline cartilage defects in knee. Health Technology Assessment 2001,
5:1-57.
Buckwalter J: Evaluating methods of restoring cartilaginous
articular surfaces. Clin Orthop 1999, 367(suppl):S224-S238.
Schneider U, Breusch SJ, von der Mark K: Aktueller Stellenwert
der autologen Chondrozytentransplantation. Z Orthop Ihre
Grenzgeb 1999,137:386-392.
Bader DL, Kempson GE, Egan J, Gilbey W, Barrett AJ: The
effects of selective matrix degradation on the short-term
compressive properties of adult human articular cartilage.
Biochim Biophys Acta 1992, 1116:147-154.
Pearce RH, Thompson JP, Bebault GM, Flak B: Magnetic resonance imaging reflects the chemical changes of aging degeneration in the human intervertebral disk. J Rheum 1991, 18:
42-43.
Potter K, Butler JJ, Horton WE, Spencer RGS: Response of
engineered cartilage tissue to biochemical agents as studied
by proton magnetic resonance microscopy. Arthritis Rheum
2000, 43:1580-1590.
Recht M, Bobic V, Burstein D, Disler D, Gold G, Gray M, Kramer
J, Lang P, McCauley T, Winalski C: Magnetic resonance
imaging of articular cartilage. Clin Orthop 2001, 391(suppl):
S379-S396.
Richardson JB, Caterson B, Evans EH, Ashton BA, Roberts S:
Repair of human articular cartilage after implantation of autologous chondrocytes. J Bone Joint Surg Br 1999, 81:10641068.
Harrison PE, Aston IK, Johnson WEB, Turner SL, Richardson JB,
Ashton BA: The in vitro growth of human chondrocytes. Cell
Tissue Banking 2000, 1:1-6.
Talkhani IS, Richardson JB: Knee diagram for the documentation of arthroscopic findings of the knee – cadaveric study.
Knee 1999, 6:95-101.
R71
Arthritis Research and Therapy
R72
Vol 5 No 1
Roberts et al.
15. Gold GE, Bergman AG, Pauly JM, Lang P, Butts RK, Beaulieu CF,
Hargreaves B, Frank L, Boutin RD, Macovski A, Resnick D: Magnetic resonance imaging of knee cartilage repair. Top Magn
Res Imaging 1998, 9:377-392.
16. Kwan APL, Dickson IR, Freemont AJ, Grant ME: Comparative
studies of type X collagen expression in normal and rachitic
chicken epiphyseal cartilage. J Cell Biol 1989, 109:1849-1856.
17. Poole CA, Ayad S, Schofield JR: Chondrons from articular cartilage: immunolocalisation of type VI collagen in the pericellular
capsule of isolated canine tibial chondrons. J Cell Sci 1988,
90:635-643.
18. Caterson B, Griffin J, Mahmoodian F, Sorrell JM: Monoclonal
antibodies against chondroitin sulphate isomers: their use as
probes for investigating proteoglycan metabolism. Biochem
Soc Trans 1990, 18:820-821.
19. Caterson B, Christner JE, Baker JR, Couchman JR: Production
and characterization of monoclonal antibodies directed
against connective tissue proteoglycans. Fed Proc 1985, 44:
386-393.
20. Sorrell JM, Mahmoodian F, Schafer IA, Davis B, Caterson B:
Identification of monoclonal antibodies that recognise novel epitopes in native chondrotin/dermatan sulfate glycosaminoglycan
chains. Their use in mapping functionally distinct domains of
human skin. J Histochem Cytochem 1990, 38:393-402.
21. Caterson B, Christner JE, Baker JR: Identification of a monoclonal antibody that specifically recognizes corneal and skeletal keratan sulfate. J Biol Chem 1983, 258:8848-8854.
22. Caterson B, Calabro T, Donohue PJ, Jahnke MR: Monoclonal
antibodies against cartilage proteoglycan and link protein. In
Articular Cartilage Biochemistry. Edited by Kuettner KE, Schleyerbach R, Hascall VC. New York: Raven Press; 1986: 59-73.
23. Roberts S, Menage J, Duance VC, Wotton S, Ayad S: Collagen
types around the cells of the intervertebral disc and cartilage
end plate: an immunolocalization study. Spine 1991, 16:10301038.
24. Roberts S, Caterson B, Evans EH, Eisenstein SM: Proteoglycan
components of the intervertebral disc and cartilage endplate:
an immunolocalization study of animal and human tissues.
Histochem J 1994, 26:402-411.
25. Shrout PE, Fleiss JL: Intraclass correlations: uses in assessing
rater reliabilty. Psychol Bull 1979, 86:420-428.
26. Peterson L, Minas T, Brittberg M, Nilsson A, Sjorgren-Jansson E,
Lindahl A: two- to 9- year outcome after autologous chondrocyte transplantation of the knee. Clin Orthop 2000, 374:212234.
27. Brittberg M, Tallheden T, Sjorgren-Jansson E, Lindahl A, Peterson
L: Autologous chondrocytes used for articular cartilage repair.
Clin Orthop 2001, 391(suppl):S337-S348.
28. Newman AP: Articular cartilage repair. Am J Sport Med 1998,
26:309-324.
29. O’Driscoll SW, Keeley FW, Salter RB: The chondrogenic potential of free autogenous periosteal grafts for biological resurfacing of major full-thickness defects in joint surfaces under
the influence of continuous passive motion. J Bone Joint Surg
Am 1986, 68:1017-1035.
30. O’Driscoll SW, Marx RG, Beaton DE, Miura Y, Gallay SH, Fitzsimmons JS: Validation of a simple histological, histochemical
cartilage scoring system. Tissue Eng 2001, 7:313-320.
31. Pineda S, Pollack A, Stevenson S, Goldberg V, Caplan A: A
semiquantative scale for histologic grading of articular cartilage repair. Acta Anat 1992, 143:335-340.
32. Wakitani S, Goto T, Pineda S, Young RG, Mansour JM, Caplan AI,
Goldberg VM: Mesenchymal cell-based repair of large, fullthickness defects of articular cartilage. J Bone Joint Surg Am
1994, 76:579-592.
33. Ben-Yishay A, Grande DA, Schwartz RE, Menche D, Pitman MD:
Repair of articular cartilage defects with collagen-chondrocyte allografts. Tissue Eng 1995, 1:119-133.
34. Caplan AI, Elyaderani M, Mochizuki Y, Wakitani S, Goldberg VM:
Principles of cartilage repair and regeneration. Clin Orthop
1997, 342:254-269.
35. Carranza-Bencano A, Perez-Tinao M, Ballesteros-Vazquez P,
Armas-Padron JR, Hevia-Alsono A, Martos Crespo F: Comparative study of the reconstruction of articular cartilage defects
with free costal perichondrial grafts and free tibial periosteal
grafts: an experimental study on rabbits. Calcif Tissue Int
1999, 65:402-407.
36. Breinan HA, Minas T, Barone L, Tubo R, Hsu H-P, Shortkroff S,
Nehrer S, Sledge CB, Spector M: Histological evaluation of the
course of healing of canine articular cartilage defects treated
with cultured autologous chondrocytes. Tissue Eng 1998, 4:
101-114.
37. Mankin HJ, Dorfman H, Lippiello L, Zarins A: Biochemical and
metabolic abnormalities in articular cartilage from osteoarthritic human hips. J Bone Joint Surg Am 1971, 53:523-537.
38. Ostergaard K, Andersen CB, Petersen J, Bendtzen K, Salter DM:
Validity of histopathological grading of articular cartilage
from osteoarthritic knee joints. Ann Rheum Dis 1999, 58:208213.
39. Grande DA, Breitbart AS, Mason J, Paulino C, Laser J, Schwartz
RE: Cartilage tissue engineering: current limitations and solutions. Clin Orthop 1999, 367(suppl):S167-S185.
40. Ratcliffe A, Mow VC: Articular cartilage. In Extracellular Matrix.
Volume 1, Tissue Function. Edited by Comper WD. Amsterdam:
Harwood Academic Press; 1996:234-302.
41. Roberts S: Collagen of the calcified layer of human articular
cartilage. Experientia 1985, 41:1138-1139.
42. Eyre DR, Muir H: Quantitative analysis of Types I and II collagens in human intervertebral discs at various ages. Biochim
Biophys Acta 1977, 492:29-42.
43. Wotton SF, Duance VC: Type III collagen in normal human
articular cartilage. Histochem J 1994, 26:412-416.
44. Pullig O, Weseloh G, Swoboda B: Expression of type VI collagen in normal and osteoarthritic human cartilage. Osteoarthritis Cartilage 1999, 7:191-202.
45. Rucklidge GJ, Milne G, Robins SP: Collagen type X: a component of the surface of normal human, pig and rat articular cartilage. Biochem Biophys Res Comm 1996, 224:297-302.
46. von der Mark K, Kirsch T, Nerlich A, Kuss A, Weseloh G, Glückert
K, Burkhardt HS: Type X collagen synthesis in human
osteoarthritic cartilage. Arthritis Rheum 1992, 35:806-811.
47. Wardale RJ, Duance VC: Characterization of articular and
growth plate cartilage collagens in porcine osteochondrosis. J
Cell Sci 1994, 107:47-59.
48. Roberts S, Bains MA, Kwan A, Menage J, Eisenstein SM: Type X
collagen in the human intervertebral disc: an indication of
repair or remodelling? Histochem J 1998, 30:89-95.
49. Takahashi I, Mizoguchi I, Sasano Y, Saitoh S, Ishida M, Kagayama
M, Mitani H: Age-related changes in the localization of glycosaminoglycans in condylar cartilage of the mandible in rats.
Anat Embryol 1996, 194:489-500.
50. Nakano T, Dodd CM, Scott PG: Glycosaminoglycans and proteoglycans from different zones of the porcine knee meniscus. J Orthop Res 1997, 15:213-222.
51. Caterson B, Mahmoodian F, Sorrell JM, Hardingham TE, Bayliss
MT, Ratcliffe A, Muir H: Modulation of native chondroitin sulphate structure in tissue development and in disease. J Cell
Sci 1990, 97:411-417.
52. Lin PP, Buckwater JA, Olmstead M, Caterson B: Expression of
proteoglycan epitopes in articular cartilage repair tissue. Iowa
Orthop J 1998, 18:12-18.
53. Chung CB, Frank LR, Resnick D: Magnetic resonance imaging:
state of the art. Cartilage imaging techniques. Current clinical
applications and state of the art imaging. Clin Orthop 2001,
391(suppl):S370-S376.
54. Disler DG, McCauley TR, Wirth CR, Fuchs MD: Detection of
knee hyaline cartilage defects using fat-supressed threedimensional spoiled gradient-echo MR imaging: comparison
with standard MR imaging and correlation with arthroscopy.
AJR Am J Roentgenol 1995, 165:377-382.
55. Trattnig S, Huber M, Breitenseher MJ, Trnka H-J, Rand T, Kaider
A, Helbich T, Imhof H, Resnick D: Imaging articular cartilage
defects with 3D fat-suppressed echo planar imaging: comparison with conventional 3D supressed gradient echo sequence
and correlation with histology. J Comput Assist Tomogr 1998,
22:8-14.
56. Roberts S, Hollander AP, Caterson B, Menage J, Richardson JB:
Matrix turnover in human cartilage repair tissue in autologous
chondrocyte implantation. Arthritis Rheum 2001, 44:25862598.
57. Nehrer S, Breinan HA, Ramappa A, Hsu H-P, Minas T, Shortkroff
S, Sledge CB, Yannas IV, Spector M: Chondrocyte-seeded collagen matrices implanted in a chondral defect in a canine
model. Biomaterials 1998, 19:2313-2328.
Available online />
58. Ehlers TW, Vogel KG: Proteoglycan synthesis by fibroblasts
from different regions of bovine tendon cultured in alginate
beads. Comp Biochem Physiol A Mol Integr Physiol 1998, 121:
355-363.
59. Burton-Wurster N, Vernier-Singer M, Farquhar T, Lust G: Effect of
compressive loading and unloading on the synthesis of total
protein, proteoglycan, and fibronectin by canine cartilage
explants. J Orthop Res 1993, 11:717-729.
Correspondence
S Roberts, Centre for Spinal Studies, Robert Jones and Agnes Hunt
Orthopaedic Hospital NHS Trust, Oswestry, Shropshire SY10 7AG,
UK. Tel: +44 1691 404664; fax: +44 1691 404054; e-mail:
R73