Báo cáo y học: "Microarray gene expression profiling of osteoarthritic bone suggests altered bone remodelling, WNT and transforming growth factor-β/bone morphogenic protein signalling" pot
Bạn đang xem bản rút gọn của tài liệu. Xem và tải ngay bản đầy đủ của tài liệu tại đây (574.58 KB, 21 trang )
Available online />
Research article
Open Access
Vol 9 No 5
Microarray gene expression profiling of osteoarthritic bone
suggests altered bone remodelling, WNT and transforming growth
factor-β/bone morphogenic protein signalling
Blair Hopwood1,2, Anna Tsykin3, David M Findlay2,4 and Nicola L Fazzalari1,2,5
1Division
of Tissue Pathology, Institute of Medical & Veterinary Science, Frome Road, Adelaide, South Australia, 5000, Australia
Institute, Frome Road, Adelaide, South Australia, 5000, Australia
3School of Mathematics, University of Adelaide, North Terrace, Adelaide, South Australia, 5005, Australia
4Discipline of Orthopaedics & Trauma, University of Adelaide, North Terrace, Adelaide, South Australia, 5005, Australia
5Discipline of Pathology, University of Adelaide, North Terrace, Adelaide, South Australia, 5005, Australia
2Hanson
Corresponding author: Nicola L Fazzalari,
Received: 11 Jul 2007 Revisions requested: 10 Aug 2007 Revisions received: 10 Sep 2007 Accepted: 27 Sep 2007 Published: 27 Sep 2007
Arthritis Research & Therapy 2007, 9:R100 (doi:10.1186/ar2301)
This article is online at: />© 2007 Hopwood et al.; licensee BioMed Central Ltd.
This is an open access article distributed under the terms of the Creative Commons Attribution License ( />which permits unrestricted use, distribution, and reproduction in any medium, provided the original work is properly cited.
Abstract
Osteoarthritis (OA) is characterized by alterations to
subchondral bone as well as articular cartilage. Changes to
bone in OA have also been identified at sites distal to the
affected joint, which include increased bone volume fraction and
reduced bone mineralization. Altered bone remodelling has
been proposed to underlie these bone changes in OA. To
investigate the molecular basis for these changes, we
performed microarray gene expression profiling of bone
obtained at autopsy from individuals with no evidence of joint
disease (control) and from individuals undergoing joint
replacement surgery for either degenerative hip OA, or fractured
neck of femur (osteoporosis [OP]). The OP sample set was
included because an inverse association, with respect to bone
density, has been observed between OA and the low bone
density disease OP. Compugen human 19K-oligo microarray
slides were used to compare the gene expression profiles of
OA, control and OP bone samples. Four sets of samples were
analyzed, comprising 10 OA-control female, 10 OA-control
male, 10 OA-OP female and 9 OP-control female sample pairs.
Print tip Lowess normalization and Bayesian statistical analyses
were carried out using linear models for microarray analysis,
which identified 150 differentially expressed genes in OA bone
with t scores above 4. Twenty-five of these genes were then
confirmed to be differentially expressed (P < 0.01) by real-time
PCR analysis. A substantial number of the top-ranking
differentially expressed genes identified in OA bone are known
to play roles in osteoblasts, osteocytes and osteoclasts. Many of
these genes are targets of either the WNT (wingless MMTV
integration) signalling pathway (TWIST1, IBSP, S100A4,
MMP25, RUNX2 and CD14) or the transforming growth factor
(TGF)-β/bone morphogenic protein (BMP) signalling pathway
(ADAMTS4, ADM, MEPE, GADD45B, COL4A1 and FST).
Other differentially expressed genes included WNT (WNT5B,
NHERF1, CTNNB1 and PTEN) and TGF-β/BMP (TGFB1,
SMAD3, BMP5 and INHBA) signalling pathway component or
modulating genes. In addition a subset of genes involved in
osteoclast function (GSN, PTK9, VCAM1, ITGB2, ANXA2,
GRN, PDE4A and FOXP1) was identified as being differentially
expressed in OA bone between females and males. Altered
expression of these sets of genes suggests altered bone
remodelling and may in part explain the sex disparity observed in
OA.
Introduction
than males, particularly after the menopause [1]. OA is characterized by changes to all components of the joint, with degeneration and loss of articular cartilage and changes to the
subchondral bone being constant factors in disease progres-
Osteoarthritis (OA) is a complex, multifactorial, age-dependent degenerative disease of the synovial joints. It affects the
knee and the hip most commonly, and females at a higher rate
AMF = Adelaide Microarray facility; BMP = bone morphogenic protein; CT = cycle threshold; IL = interleukin; IT = intertrochanteric; LEF = lymphoid
enhancer factor; LIMMA = linear models for microarray analysis; MMP = matrix metalloproteinase; OA = osteoarthritis; OP = osteoporosis; PCR =
polymerase chain reaction; RUNX = runt-related transcription factor; SD = standard deviation; TCF = T-cell factor; TGF = transforming growth factor;
WNT = wingless MMTV integration.
Page 1 of 21
(page number not for citation purposes)
Arthritis Research & Therapy
Vol 9 No 5
Hopwood et al.
sion [2]. Along with the breakdown of the cartilage and joint
space narrowing, there is thickening and sclerosis of subchondral bone, development of cysts and bony overgrowth at the
margins of the joint. Despite an increase in bone volume
fraction, the subchondral bone is mechanically weaker in OA
because of hypomineralization, increased collagen metabolism and altered bone remodelling [3,4]. Evidence from animal
models of OA suggests that the changes in the density and
metabolism of subchondral bone develop concomitantly with
the signs of cartilage damage [5-7]. In addition, there is now
evidence in animal OA models that antiresorptive agents,
which inhibit subchondral bone remodelling, also prevent the
bone changes and loss of cartilage seen in OA, thus reducing
joint damage [8,9]. A human trial of an antiresorptive agent
also showed clear trends toward improvement in both joint
structure and symptoms in patients with primary knee OA [10].
These findings are consistent with the hypothesis that OA is a
bone disease, rather than – or in addition to – a cartilage disease, and that the structural and compositional changes seen
in OA subchondral bone, brought about by altered bone
remodelling, contribute to the breakdown of the articular cartilage at the joint [11-14].
The structural and compositional changes seen in OA bone
are likely to have considerable genetic input because there is
a significant heritable component to OA, as judged by genetic
studies [27]. Interestingly, many of the candidate susceptibility
genes for OA identified by genetic screening approaches have
bone-related functions, further suggesting the involvement of
bone in OA. Primary OA candidate genes identified, with
bone-related functions, include COL1A1, VDR, ESR1, IGF1,
SFRP3, BMP5 and TGFB1 [27-30]. SFRP3 encodes a decoy
receptor for WNT (wingless MMTV integration) ligands and
plays a role in osteoblast differentiation [31]. The WNT signalling pathway is a major developmental pathway that is involved
in cell fate, differentiation and proliferation. This signalling
pathway has also been linked to skeletal development and
bone pathologies such as OP [32]. The identification of
TGFB1 and BMP5, a member of the transforming growth factor (TGF)-β superfamily, as OA susceptibility loci has implicated the TGF-β/BMP signalling pathway in OA pathogenesis.
The TGF-β/BMP signalling pathway plays important roles in
development, cell proliferation and differentiation, and it has
also been shown to influence bone mass and bone remodelling [33,34].
There is also evidence that the osteoblasts in subchondral
bone can influence chondrocyte and cartilage metabolism
more directly, leading to abnormal remodelling of OA cartilage
[15,16]. In articular joints there is a complex juxtaposition of
vascular elements, subchondral bone and the different cartilage layers, with important communication between these tissues [17]. These observations point to a clear interplay
between bone and cartilage at articular joints and show that
these tissues represent a functional cellular and molecular unit
[18]. Altered angiogenesis could also be contributing to the
changes seen in OA bone and cartilage, because important
inter-relationships between bone remodelling, chondrogenic
and angiogenic processes are now emerging [19-21].
Complementing the human genetic studies described above,
and in support of altered bone remodelling at sites distal to the
active subchondral disease site, we previously identified differences in the expression of known skeletally active genes in
human trabecular bone obtained from the IT region from individuals with hip OA, as compared with bone from the same
site in control individuals. Genes identified as differentially
expressed include downregulated osteoclastogenic factor
genes (RANKL, RANK, IL6 and IL11) and upregulated bone
formation marker genes (ALPL, BGLAP, SPP1 and COL1A2)
[35-37]. Others have identified in OA individuals altered levels
of insulin-like growth factor-1, insulin-like growth factor-2 and
TGF-β1 in cortical bone from the iliac crest [38]; matrix metalloproteinase (MMP)2 and liver alkaline phosphatase in
subchondral bone [4]; and IL-1β, IL-6 and TGF-β1 in human
primary subchondral osteoblasts [39].
In addition to the changes observed in subchondral bone,
there is growing evidence for generalized involvement of bone
in the pathogenesis of OA. Studies investigating bone at sites
distal to the joint cartilage degeneration, such as the intertrochanteric (IT) and medial principal compressive regions of the
proximal femur, and the iliac crest, have yielded evidence of
altered bone composition and increased bone volume in OA
compared with control individuals [22-25]. It has been proposed that these structural and compositional changes reflect
systemic differences in OA bone remodelling compared with
control bone, and when these changes operate in subchondral bone they can contribute to the breakdown of the articular
cartilage and eventual failure of the joint [11-14]. Furthermore,
an inverse association between OA and the low bone density
disease osteoporosis (OP) has been observed. OA patients
rarely proceed to osteoporotic fracture, suggesting that OA
has a protective effect on progression of OP. Conversely, OA
is reported to be rare in OP individuals [26].
Page 2 of 21
(page number not for citation purposes)
In the present study, we used microarray analysis to survey
comprehensively the expression levels of many thousands of
genes simultaneously in trabecular bone from the IT region of
the proximal femur and to compare gene expression in bone
from OA, control and OP individuals. We identified altered
expression of WNT and TGF-β/BMP signalling pathway and
target genes in OA bone. The genes include those with known
or suspected roles in osteoblast, osteocyte and osteoclast differentiation and function, supporting a role for altered bone
remodelling in OA pathogenesis.
Materials and methods
Human bone samples
For the OA and OP groups, tube saw bone biopsies (10 mm
diameter and 20 to 40 mm long) were obtained from the IT
Available online />
region of the proximal femur. These were obtained from 24
patients (14 females [age range 49 to 83 years] and 10 males
[50 to 85 years]) undergoing hip arthroplasty for primary OA
and from 10 patients (10 females [74 to 87 years]) undergoing
hip arthroplasty for a fractured neck of femur (designated OP).
For the control group, trabecular bone from the IT region was
obtained during 21 autopsies (11 females [43 to 85 years]
and 10 males [50 to 85 years]) of individuals who were known
not to have suffered from any chronic condition or disease that
may have affected the skeleton. In selecting the OA, OP and
control individuals, those with a known history of medication
that might have affected bone metabolism were excluded.
Informed consent was obtained for the collection of these
specimens, with approval from the Royal Adelaide Hospital
Research Ethics Committee (protocol number 030309).
The surgical and autopsy femoral heads were graded for OA
according to the criteria of Collins [40]. Primary OA femoral
heads were either grade III or IV, and the graded autopsy femoral heads were not worse than grade II and predominantly
were grade I. Surgical IT trabecular bone specimens from OA
and OP individuals were collected within 12 to 24 hours
(stored at 4°C in sterile RNase-free phosphate-buffered
saline). Control bone was collected within 24 to 72 hours after
death.
Trabecular bone in the IT region of the proximal femur, including the marrow, was sampled, permitting analysis of the total
contribution of the bone microenvironment. The IT region was
also chosen because the trabecular structure in this region
depends on stresses in the proximal femoral shaft, while being
unaffected by the secondary sclerotic and cystic changes that
are often seen in the OA femoral head as the destruction of the
cartilage proceeds. By comparing the OA and OP samples
with control samples, the contribution to changes in gene
expression associated with surgery as opposed to autopsy
could be assessed.
RNA extraction
For total RNA extraction, the trabecular bone samples were
rinsed briefly in diethylpyrocarbonate-treated water and then
separated into small fragments, containing bone and bone
marrow, using bone cutters. Total RNA was extracted as
described previously [35,41]. Briefly, bone fragments were
placed in 4 mol/l guanidinium thiocyanate solution and homogenized using an Ultra-Turrax (TP 18–10; Janke & Kunkel, IKAWERK, Staufen, Germany), and the mixture was clarified by
centrifugation (1,000 × g for 5 min). After addition of 0.1 vol
of 2 mol/l sodium acetate (pH 4.0), the mixture was vortexed
and the RNA extracted with 1 vol of phenol and 0.2 vol of chloroform/isoamylalcohol (49:1). Total RNA was precipitated with
isopropanol, resuspended in 1 × 10 mmol/l Tris-HCl/1 mmol/
l EDTA containing 0.1 vol of 3 mol/l sodium acetate (pH 5.2)
and then re-extracted with 0.5 vol phenol, followed by 0.5 vol
chloroform/isoamylalcohol. The RNA was then precipitated
with 3 vol of 4 mol/l sodium acetate (pH 7.0), to remove contaminating proteoglycans, at -20°C overnight. Total RNA was
recovered by centrifugation, washed with 75% ethanol, air
dried, dissolved in diethylpyrocarbonate-treated water, and
stored at -80°C until further use. RNA concentration and purity
(260/280 absorbance ratio) were determined by spectrophotometry. RNA integrity was confirmed by visualization on ethidium bromide stained 1% weight/vol agarose-formaldehyde
gels.
Microarray
RNA was further purified using RNeasy columns (Qiagen,
Hilden, Germany), in accordance with the manufacturer's
instructions. RNA (5 μg) was amplified using a Message Amp
II kit (Ambion, Austin, TX, USA) with indirect, amino allyl mediated incorporation of either Cy3 or Cy5 dyes (Amersham Biosciences, Piscataway, NJ, USA), in accordance with the
manufacturer's instructions. A Compugen Human 19K-oligo
library (Jamesburg, NJ, USA) spotted onto Corning glass
slides (Lowell, MA, USA) by the Adelaide Microarray facility
(AMF) was used in this study. The Compugen human oligo
library consisted of 17,260 oligonucleotide 65-mers each representing a single human gene. The slides were interrogated
by competitive hybridization with 5 μg each of Cy3 and Cy5
labelled pairs of OA-control, OA-OP, or OP-control amplified
RNA samples. The sample pairs used in the microarray analysis are listed in Table 1. Sample pairs were age-matched as
closely as possible.
A biological dye-swap strategy was employed rather than a
replicate dye swap strategy. This involved swapping of Cy3
and Cy5 labelling of the samples in each pair for each group
of paired samples to balance for potential dye incorporation
and signal intensity bias. It also reduced the number of slides
required for the experiment and maximized the statistical
power of the experiment with regard to analyzing the biological
differences between samples.
Hybridization and washing of slides was carried out according
to methods described on the AMF website [42]. The microarray slides were scanned twice at slightly different PMT
voltage using a GenePix 4000B Scanner driven by GenePix
Pro 4.0 (Axon Instruments, Foster City, CA, USA). All analyses
were performed using the statistical programming and graphics environment R [43]. The 'SPOT' software package [44]
was used to identify spots using the adaptive segmentation
method and subtract backgrounds utilizing the morphological
opening approach [45,46]. Data analysis was performed in R
using Bioconductor [47]. The Loess print tip method was used
to correct for dye bias and intensity within each group of adjacent spots printed by one pin [48]. Linear modelling was performed using the linear models for microarray analysis
(LIMMA) package of Bioconductor [49]. Differentially
expressed genes were ranked on moderated t statistics, and
those with t scores above 3 were followed up further. The
Page 3 of 21
(page number not for citation purposes)
Arthritis Research & Therapy
Vol 9 No 5
Hopwood et al.
Table 1
Control versus OA versus OP sample microarray comparisons
Sample pair
Slide
GEO accession
number
ID
Status
Age (years)
ID
Status
Age (years)
1
GSM207548
1
CTL
85
12
OA
83
2
GSM207549
2
CTL
83
13
OA
82
3
GSM207810
2
CTL
83
14
OA
82
4
GSM207811
3
CTL
72
15
OA
78
5
GSM207550
4
CTL
72
16
OA
77
6
GSM207812
5
CTL
68
21
OA
68
7
GSM207552
6
CTL
68
17
OA
66
8
GSM207553
7
CTL
60
18
OA
60
9
GSM207554
8
CTL
56
19
OA
56
10
GSM207555
9
CTL
43
20
OA
49
11
GSM208577
37
CTL
85
47
OA
85
12
GSM208575
38
CTL
73
48
OA
77
13
GSM208578
39
CTL
71
49
OA
73
14
GSM208576
40
CTL
71
50
OA
70
15
GSM208579
41
CTL
70
51
OA
69
16
GSM208583
42
CTL
69
52
OA
63
17
GSM208580
43
CTL
64
53
OA
63
18
GSM208582
44
CTL
60
54
OA
62
19
GSM208581
45
CTL
57
55
OA
57
20
GSM208584
46
CTL
50
56
OA
50
21
GSM207805
26
OP
91
22
OA
87
22
GSM207813
27
OP
87
12
OA
83
23
GSM207803
34
OP
87
13
OA
82
24
GSM207804
28
OP
84
23
OA
79
25
GSM207808
29
OP
81
24
OA
78
26
GSM207806
35
OP
78
15
OA
78
27
GSM207807
36
OP
78
16
OA
77
28
GSM207556
35
OP
78
25
OA
73
29
GSM208574
32
OP
74
21
OA
68
30
GSM207809
33
OP
74
17
OA
66
32
GSM207798
2
CTL
83
27
OP
87
33
GSM207557
2
CTL
83
34
OP
87
34
GSM207796
10
CTL
83
28
OP
84
35
GSM207797
11
CTL
74
29
OP
81
36
GSM207799
4
CTL
72
36
OP
78
37
GSM207800
3
CTL
72
30
OP
77
38
GSM207551
3
CTL
72
31
OP
75
39
GSM207801
5
CTL
68
32
OP
74
40
GSM207802
6
CTL
68
33
OP
74
'Slide' indicates the microarray slide comparison. Slides 1 to 10 are control (CTL)-osteoarthritis (OA) female sample pairs, slides 11 to 20 are
CTL-OA male sample pairs, slides 21 to 30 are OA-osteoporosis (OP) female sample pairs and slides 32 to 40 are CTL-OP female sample pairs.
GEO, Gene Expression Omnibus; ID, individual/sample.
Page 4 of 21
(page number not for citation purposes)
Available online />
moderated t-statistic score is based on the ratio of the log2 fold
change to its standard error. Because there is no consensus
on appropriate adjustment of P values in the context of microarrays, genes of interest were chosen based on a combination
of statistical and biological indicators. Microarray data have
been deposited in the Gene Expression Omnibus [50] and are
accessible through Gene Expression Omnibus series number
GSE8406.
Real-time PCR
First-strand reverse transcription cDNA synthesis was performed on 1 μg amplified RNA from each sample using a firststrand cDNA synthesis kit with Superscript II (Invitrogen,
Carlsbad, CA, USA) and 250 ng random hexamer primer
(Geneworks, Adelaide, SA, Australia), in accordance with the
manufacturer's instructions. Template cDNA (1 μl of 1/100
dilution of cDNA) was amplified using iQ SYBR Green Supermix (BioRad, Hercules, CA, USA) on a Rotor-Gene thermocycler (Corbett Research, Mortlake, NSW, Australia). The
reactions were incubated at 94°C for 10 min for 1 cycle, and
then 94°C (20 seconds), 60°C, or 65°C (ADAMTS4 and
MMP25 only; 20 seconds) and 72°C (30 seconds) for 40
cycles. This set of cycles was followed by an additional extension step at 72°C for 5 minutes. All PCR reactions were validated by the presence of a single peak in the melt curve
analysis, and amplification of a single specific product was fur-
Table 2
GenBank accession numbers and primer sequences
Gene/primer (GenBank accession number)
Forward
Reverse
GAPDH (NM_002046)
ACCCAGAAGACTGTGGATGG
CAGTGAGCTTCCCGTTCAG
ADAMTS4 (NM_005099)
GGCTACTACTATGTGCTGGAGC
TCCGCACACCATGCACTTGTCA
ADM (NM_001124)
GGATGAAGCTGGTTTCCGTC
GACTCAGAGCCCACTTATTC
ADFP (NM_001122)
GTTGCCAATACCTATGCCTG
CAGTAGTCGTCACAGCATCT
CD14 (NM_000591)
GAGGTTCGGAAGACTTATCG
ATCTTCATCGTCCAGCTCAC
COL4A1 (NM_001845)
TAGAGAGGAGCGAGATGTTC
GTGACATTAGCTGAGTCAGG
CTNNB1 (NM_001904)
GGTGCTATCTGTCTGCTCTAGT
GACGTTGACTTGGATCTGTCAGG
FST (NM_006350)
GGCAAGATGTAAAGAGCAGC
CATTATTGGTCTGGTCCACC
GADD45B (NM_015675)
TTGCAACATGACGCTGGAAG
CATTCATCAACTTGGCCGAC
IBSP (NM_004967)
CAATCCAGCTTCCCAAGAAG
CTTCTGCTTCGCTTTCTTCG
INHBA (NM_002192)
GAACTTATGGAGCAGACCTC
TGCCTTCCTTGGAAATCTCG
INSIG1 (NM_005542)
TGTATCGACAGTCACCTCGGA
GGACAGCTGGACATTATTGGC
ITGB2 (NM_000211))
AAGTGACGCTTTACCTGCGA
CCTGAGGTCATCAAGCATGG
KLF6 (NM_001300)
TGTGCAGCATCTTCCAGGAG
AACGTTCCAGCTCTAGGCAG
MEPE (NM_020203)
GCAAAGCTGTGTGGAAGAGCAGA
CCCTTATTCTCACTGGCTTCAG
MMP25 (NM_004142)
ATGTCACCGTCAGCAACGCA
CGGTCTTGATGCTGTTCTTG
MT2A (NM_005953)
GCAAATGCACCTCCTGCAAG
GTGGAAGTCGCGTTCTTTAC
NHERF1 (NM_004252)
TCACCAATGGGGAGATACAG
GTCTTGGGAATTCAGCTCCT
PTEN (NM_000314)
AAGACAAAGCCAACCGATAC
GAAGTTGAACTGCTAGCCTC
RUNX2 (NM_004348)
TGATGACACTGCCACCTCTG
GGGATGAAATGCTTGGGAAC
S100A4 (NM_002961)
GTCAGAACTAAAGGAGCTGC
TGTTGCTGTCCAAGTTGCTC
SMAD3 (NM_005902)
TTCAACAACCAGGAGTTCGC
TACTGGTCACAGTA
STC1 (NM_003155)
CCTGTGACACAGATGGGATG
GAATGGCGAGGAAGACCTTG
TIMP4 (NM_003256)
TTGACTGGTCAGGTCCTCAGT
GGTACTGTGTAGCAGGTGGT
TWIST1 (NM_000474)
TCAGCAGGGCCGGAGACCTAGAT
GTCTGGGAATCACTGTCCAC
WNT5B (AY009399)
ACCCTACTCTGGAAACTGTC
TAAACATCTCGGGTCTCTGC
'Slide' indicates the microarray slide comparison. Slides 1 to 10 are control (CTL)-osteoarthritis (OA) female sample pairs, slides 11 to 20 are
CTL-OA male sample pairs, slides 21 to 30 are OA-osteoporosis (OP) female sample pairs and slides 32 to 40 are CTL-OP female sample pairs.
GEO, Gene Expression Omnibus; ID, individual/sample.
Page 5 of 21
(page number not for citation purposes)
Arthritis Research & Therapy
Vol 9 No 5
Hopwood et al.
ther confirmed by electrophoresis on a 2.5% weight/vol agarose gel. Primers were designed for each gene that primed in
separate exons and spanned at least one intron to avoid contaminating amplification from genomic DNA. Primers were
obtained from Geneworks. Amplicons were designed to be in
the 100 to 200 base pairs size range. GenBank accession
numbers for gene sequences and primer sequences are provided in Table 2. Real-time PCR validation was carried out
using the 2-ΔΔCT method [51]. Reactions were performed in
duplicate. Normalized gene expression values for each gene
based on cycle threshold (CT) values for each of the genes
and the housekeeping gene GAPDH were generated. Mean ±
standard deviation (SD) values were generated from eight
samples from each group of either OA or control samples
tested.
Statistical analysis
The statistical significance of the differences between the
means of the OA and control or OP gene expression values
was determined using Student's t-test. The critical value for
significance was chosen as P < 0.05.
Results
Microarray analysis of OA, control and OP bone samples
This study used Compugen human 19K-oligo human microarray slides to compare the gene expression profiles of OA,
control and OP bone samples, with the aim being to identify
altered gene expression in OA bone. Microarray analysis was
conducted in four sets of samples (39 comparisons in total),
comprising 10 OA-control female sample pairs, 10 OA-control
male sample pairs, 10 OA-OP female sample pairs and 9 OPcontrol female sample pairs. Samples from individuals with a
range of ages were analyzed in each group, but with sample
pairs age-matched as closely as possible (Table 1). Bayesian
statistical analysis was carried out using LIMMA to identify statistically significant differentially expressed genes between
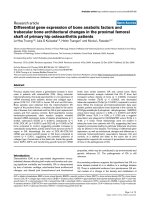
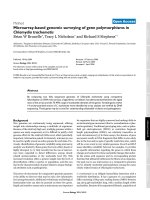
OA, control and OP bone. Log odds score versus log2 fold
change volcano plots of differentially expressed genes from
each of the four groups of sample pair comparisons are shown
in Figure 1. The log odds (or B statistic) score is the log odds
that that gene is differentially expressed. The log2 fold change
represents the fold change in expression of the gene. Small
levels of differential expression (ranging from 0.38-fold to
2.83-fold change in expression) were detected, with several
hundred differentially expressed genes present in each grouping, with t scores above 6. The moderated t-statistic score is
based on the ratio of the log2 fold change to its standard error.
Identification and functional classification of topranking differentially expressed genes in OA bone
By comparing the lists of ranked differentially expressed genes
from each of the four initial groupings, we were able to identify
a group of differentially expressed genes that was more likely
to be associated with the OA disease process. This group of
genes was assembled by filtering out genes that were similarly
Page 6 of 21
(page number not for citation purposes)
regulated between OA-control and OP-control samples in
order to remove genes that were more likely to be differentially
expressed because of potential differences caused by sourcing bone at surgery versus autopsy. Because there were also
very few significant differences in gene expression between
the male and female OA-control groups, these data were combined because it strengthened the statistical significance of
the genes identified as differentially expressed. Using these
selection processes, several hundred genes from each initial
grouping was reduced to a list of 150 differentially expressed
genes in OA bone with t scores above 4.
Gene function and pathway analyses were carried out by
searching the National Centre for Biotechnology Information
database [52] and by using various analysis programs including OntoExpress [53] and Gostat [54]. We were able to identify a group of 62 top-ranking OA differentially expressed
genes from within the initial list of 150 genes, which have
known or suspected roles (direct or indirect via angiogenesis)
in influencing bone development or bone remodelling (Table
3). For many of the genes both osteogenic and angiogenic
roles have been described. In addition, a subset of these
genes, particularly those that encode secreted, cell surface
and extracellular matrix molecules, also have potential
chondrogenic functions, consistent with the proposal that an
altered OA subchondral bone microenvironment could interfere with cartilage metabolism.
Although many of the genes identified in this analysis have
pleiotropic effects in bone and other tissues, it was of interest
that many of the top-ranking differentially expressed genes in
OA bone have known or suspected roles in osteoblast and
osteocyte differentiation and function. These genes included
ADAMTS4, ADM, GADD45B, IBSP, MMP25, MT2A, STC1,
MEPE, TWIST1, IGFBP3, S100A4, AKT3 and COL4A1.
There was also a group of differentially expressed genes in OA
bone that have known or potential roles in osteoclast function,
such as the previously mentioned osteoblast-related genes
ADAMTS4, GADD45B, STC1 and IGFB3, as well as
ADAM8, CCR2, CSTA, RAC2, CRYAB and CYP1B. Functionally, within the list of genes given in Table 3, there are
genes encoding secreted molecules (ADM, ANGPTL4,
STC1, CORT, IGFBP3 and MIF), cell surface molecules
(SELL, ICAM3, SELP, CRIM1, CLECSF6, CLECSF2, CCR2
and SLC14A1), intracellular signalling molecules (RAB20,
YWHAG, RAC2, NHERF1, GNA11 and SNX9), protein
kinases (AKT3 and PRKCD), calcium and metal ion binding
proteins (S100A4, S100A6, MT1L, MT2A and MT1G), transcription factors (TWIST1, FMR2, KLF6, NR4A2 and DEC1),
and both enzymatic (ADAMTS4, MMP25, ADAM8, TIMP4,
GALNT4 and CTSG) and structural (TGFBI, IBSP, MEPE,
MFAP3L and COL4A1) extracellular matrix molecules.
Because of the small absolute differences in gene expression
between the bone tissue samples, real-time PCR was used to
Available online />
Figure 1
Bayesian statistical analysis of differentially expressed genes using LIMMA. Log odds (LOD) score versus log2 fold change volcano plots of differenLIMMA
tially expressed genes from each of the four groups of sample pair comparisons. CTL, control; LIMMA, linear models for microarray analysis; OA,
osteoarthritis; OP, osteoporosis.
confirm a selection of the differentially expressed genes identified by the microarray analysis of OA, control and OP bone.
The real-time PCR results (depicted as fold differential
expression) are shown alongside the microarray results in
Table 3. In total, the differential expression levels of 20 genes
were examined using real-time PCR. Results for 16 genes
reached statistical significance (P < 0.01) for differential
expression between OA and control bone. The differential
expression of four genes (TGFBI, S100A6, SLC14A1 and
SNX9) could not be confirmed. The female control samples 1–
8 (age range 56 to 85 years, mean [ ± SD] age 70.5 ± 10
years) and female OA samples 12–19 (age range 56 to 83
years; mean age 73 ± 10.8 years) were used to confirm the
microarray data by real-time PCR (Table 1). The mean age of
the OA group did not differ significantly from that in the control
group. Interestingly, although the microarray expression ratios
were quite small (ranging from 0.62-fold change to 1.47-fold
change in expression), the fold difference in expression identified using the real-time PCR reactions was significantly
greater in most cases (ranging from 0.08-fold change to 2.6fold change in expression). This probably reflects differences
in sensitivity between the two techniques [55,56]. The difference is probably also accentuated by the competitive pairwise comparison of samples used by the microarray platform
in this study compared with the individual gene/GAPDH CT
expression ratio values generated using real-time PCR.
Encouragingly, there was a high confirmation rate with the
real-time PCR and consistency between the microarray and
PCR detection of expression ratio differences for each of the
genes analyzed, suggesting that the majority of the genes
identified by the microarray are bona fide differentially
expressed genes in OA bone.
Altered expression of WNT and TGF-β/BMP signalling
pathway component and target genes in OA bone
A significant number of the top-ranking differentially expressed
genes in OA bone were identified as WNT signalling pathway
targets (Table 3). WNT targets included upregulated genes
Page 7 of 21
(page number not for citation purposes)
Arthritis Research & Therapy
Vol 9 No 5
Hopwood et al.
Table 3
Differentially expressed genes in OA bone with roles in osteogenesis, angiogenesis and chondrogenesis
Real-time PCR
Rank
GenBank
Role
Cell type
NM_001124
A, B, C
OB, OC,
OS, CB
3
NM_002450
B
OB
4
NM_016109
A
5
NM_015675
B
7
NM_000358
A, B
9
NM_017817
Symbol
Name
NM_004967
B, C
OB, CB
AB014526
B
NM_004142
A, B, C
OB, OC,
CB
15
NM_002025
B
18
NM_005953
B
20
NM_013258
A, B
21
NM_003155
A, B, C
23
NM_001109
24
Metallothionein 1L
-8.342
-6.165
TGF-β/BMP
GADD45B
Growth arrest and DNAdamage-inducible, beta
-8.102
-5.985
TGF-BI
Transforming growth factor,
beta-induced
-6.915
-5.147
ADM
0.09
GADD45B
0.15
IBSP
0.25
MMP25
2.60
MT2A
0.18
STC1
0.16
MEPE
0.11
TWIST1
0.31
INSIG1
0.55
S100A4
2.43
-5.741
RAB20, member RAS
oncogene family
0.11
-8.052
-6.982
WNT & TGF-β/BMP
Integrin-binding sialoprotein
-5.088
-5.865
MFAP3L
Microfibrillar-associated
protein 3-like
5.284
4.983
WNT
MMP25
Matrix metalloproteinase 25
4.942
7.183
TGF-β/BMP
FMR2
Fragile × mental retardation 2
4.915
4.851
OB
MT2A
Metallothionein 2A
-4.638
-7.071
M OC
PYCARD
PYD and CARD domain
containing
6.567
4.355
SRPX2
Sushi-repeat-containing
protein, X-linked 2
-4.333
-4.918
OB, OC,
CB
STC1
Stanniocalcin 1
-6.656
-4.274
B
OC
ADAM8
A disintegrin and
metalloproteinase domain 8
5.426
4.269
NM_020203
B
OB, OS
MEPE
Matrix, extracellular
phosphoglycoprotein with
ASARM motif
-5.036
-4.263
28
S68954
B
OB
MT1G
Metallothionein 1G
-4.202
-7.630
29
AK026438
B
OB
GALNT4
Polypeptide Nacetylgalactosaminyltransfera
se 4
5.259
4.195
30
NM_000474
B
OB
TWIST1
Twist homolog 1
-4.194
-4.910
33
NM_000655
B
M
Selectin L
4.852
4.179
36
NM_002341
A, B, C
OB, CB
37
NM_003226
A
42
NM_000607
B
46
NM_005542
49
NM_001302
B
M
52
NM_000598
A, B, C
OB, OC,
CB
54
NM_012479
A, B
OB
59
NM_014624
B
OB
61
NM_006732
A, B
OB
64
NM_002961
A, B
OB
65
NM_016184
B
M
68
NM_006184
B
TGF-β/BMP
WNT
IBSP
-7.904
OA/CTL
-6.843
Angiopoietin-like 4
NM_014467
22
MT1L
ANGPTL4
OB
13
ADM
RAB20
10
TGF-β/BMP
TGF-β/BMP
12
-12.620
t OA/OP
WNT
OB, OC,
CB
Adrenomedullin
t OA/CTL
Symbol
ADAMTS4
2
Pathway
SELL
LTB
M
Lymphotoxin beta
4.465
4.086
TFF3
Trefoil factor 3
4.080
4.074
Page 8 of 21
(page number not for citation purposes)
ORM1
3.982
-7.756
-3.878
Cortistatin
-6.713
-3.843
IGFBP3
Insulin-like growth factor
binding protein 3
-3.772
-3.893
YWHAG
WNT
4.284
Insulin induced gene 1
CORT
WNT & TGF-β/BMP
Orosomucoid 1
INSIG1
Tyrosine 3-/tryptophan 5monooxygenase activation
protein, gamma
-3.759
-5.355
S100A6
S100 calcium binding protein
A6
8.214
3.710
FBJ murine osteosarcoma
viral oncogene homolog B
3.682
3.926
S100A4
S100 calcium binding protein
A4
4.407
3.596
CLECSF6
C-type lectin domain family 4,
member A
4.575
3.594
Nucleobindin 1
-3.551
-5.513
FOSB
WNT
NUCB1
Available online />
Table 3 (Continued)
Differentially expressed genes in OA bone with roles in osteogenesis, angiogenesis and chondrogenesis
69
NM_001300
A
WNT & TGF-β/BMP
KLF6
70
NM_004864
A, B
OB, CB
TGF-β/BMP
GDF15
73
U79271
B
OB, OC
WNT
AKT3
76
S83282
A, B
OB, OC
MIF
81
NM_005213
B
OC
82
NM_000647
A, B
M OC
85
NM_001911
A
87
NM_001122
92
NM_006254
A, B
NM_002162
-4.047
-3.544
-3.541
-4.269
V-akt murine thymoma viral
oncogene homolog 3
3.507
4.876
Macrophage migration
inhibitory factor
-3.654
-3.496
CSTA
Cystatin A
4.450
3.447
CCR2
Chemokine (C-C motif)
receptor 2
7.277
3.446
CTSG
-10.219
Protein kinase C, delta
5.549
3.304
0.41
ADFP
0.21
TIMP4
0.08
NHERF1
1.71
COL4A1
0.57
3.319
Intercellular adhesion
molecule 3
KLF6
3.411
-3.368
5.798
CRYAB
OB
8.474
Adipose differentiationrelated protein
ICAM3
A
Cathepsin G
ADFP
PRKCD
WNT
94
Kruppel-like factor 6
Growth differentiation factor
15
95
NM_001885
B
Crystallin, alpha B
-3.296
-7.616
96
D17152
A
WNT
SOD2
superoxide dismutase 2
-6.347
-3.278
102
NM_003256
A
WNT
TIMP4
Tissue inhibitor of
metalloproteinase 4
-6.319
-3.250
OB, OC
105
NM_000698
M
ALOX5
Arachidonate 5-lipoxygenase
3.229
4.736
106
NM_014029
B
OC
RAC2
Rho family, small GTP binding
protein Rac2
3.227
5.325
108
NM_003670
B, C
OB, CB
DEC1
Differentially expressed in
chondrocytes 1
-3.203
-3.783
109
NM_002067
B
OB
GNA11
Guanine nucleotide binding
protein, alpha 11
-4.353
-3.202
115
AF263545
B
OB
SLC14A1
Solute carrier family 14,
member 1
3.163
5.759
120
NM_005127
B
M
CLECSF2
C-type lectin domain family 2,
member B
-7.330
-3.141
123
NM_004252
B
NHERF1
Sodium/Hydrogen exchanger
regulatory factor 1
5.280
3.138
124
NM_006186
B
OB
NR4A2
Nuclear receptor subfamily 4,
group A, member 2
-3.128
-3.354
133
NM_000104
B
OC
CYP1B1
Cytochrome P450, family 1,
subfamily B, 1
-3.075
-5.148
136
NM_003005
B
SELP
Selectin P
8.740
3.066
139
NM_004334
B
OC
BST1
Bone marrow stromal cell
antigen 1 (CD157)
3.037
3.601
141
AK023619
A
143
NM_013332
A
144
NM_001845
A, B
146
NM_016224
A, B
TGF-β/BMP
WNT
CRIM1
WNT
TGF-β/BMP
OB
HIG2
COL4A1
WNT
SNX9
Cysteine-rich motor neuron 1
-3.043
-3.271
Hypoxia-inducible protein 2
-6.019
-3.035
Collagen, type IV, alpha 1
-3.028
-8.960
Sorting nexin 9
-3.025
-6.086
Rank' indicates the ranking within the top 150 differentially expressed genes in osteoarthritis (OA) bone compared with control (CTL) and
osteoporosis (OP) bone. 'Role' indicates the known or suspected role of the gene: A, angiogenic; B, osteogenic; and C, chondrogenic. 'Cell
type' indicates the cell type that the gene is expressed in or affects: OB, osteoblast, OC, osteoclast, OS, osteocyte, CB, chondroblast, or M,
monocyte. 't OA/CTL' is the t score of OA compared with CTL differential expression of gene: a positive value indicates upregulation in OA
and a negative one indicates downregulation in OA. 't OA/OP' is the t score of OA compared with OP differential expression of gene: a
positive value indicates upregulation in OA and a negative one indicates downregulation in OA. The moderated t-statistic score is based on
the ratio of the log2 fold change to its standard error. 'OA/CTL' under 'Real-time PCR' indicates the fold change in gene expression expressed
as ratio of OA to CTL.
such as MMP25 and S100A4, and downregulated genes
such as IBSP, TWIST1 and TIMP4. The altered expression of
these genes suggests that WNT signalling may be perturbed
in the OA bone microenvironment. This was apparently borne
out by closer examination of the extended list of differentially
expressed genes in OA bone, which revealed further WNT signalling pathway components and modulators such as
WNT5B, FZD3, SFRP5, APC, AXIN2, PTEN and NHERF1.
These genes, and additional WNT target genes such as
CD14, APOE, ID1, IL6, FST and RUNX2, are listed in Table
Page 9 of 21
(page number not for citation purposes)
Arthritis Research & Therapy
Vol 9 No 5
Hopwood et al.
Table 4
WNT and TGF-β/BMP signalling pathway components and target genes differentially expressed in OA bone
Real-time PCR
GenBank
Role
Cell type
Symbol
Name
t OA/CTL
t OA/OP
Symbol
OA/CTL
Wingless-type MMTV integration site family,
member 5B
3.719
0.717
WNT5B
2.52
PTEN
0.30
CD14
3.47
ITGB2
2.95
WNT pathway components and modulators
B, C
OB, OC, CB
WNT5B
A, B, C
OB, OC, CB
LRP1
Low density lipoprotein-related protein 1
3.062
-7.071
NM_002333
LRP3
Low density lipoprotein-related protein 3
5.950
1.146
NM_017412
FZD3
Frizzled homolog 3
-3.677
0.835
AF086500
FZD8
Frizzled homolog 8
3.024
-1.557
AY009399
NM_002332
NM_003015
SFRP5
Secreted frizzled-related protein 5
-4.338
1.154
NM_004655
AXIN2
Axin 2
-3.123
2.490
NM_000038
APC
Adenomatosis polyposis coli
-5.171
1.155
DAAM1
Dishevelled associated activator of
morphogenesis 1
-6.704
2.850
PTEN
Phosphatase and tensin homolog
-5.288
-0.216
AF028823
TIP1
Tax interaction protein 1
5.057
-5.674
AB006630
TCF20
Transcription factor 20
8.559
2.719
M
FOXP1
Forkhead box P1
-5.122
1.761
AK023892
NM_000314
AK026898
A, B
OB, OC
B
WNT inducible/target genes
NM_000591
B
OB, OC, M
CD14
CD14 antigen
5.965
-7.036
NM_004039
A, B
OB, OC, M
ANXA2
Annexin A2
5.716
-7.601
NM_000211
B
OC
ITGB2
Integrin, beta 2 (CD18)
6.104
-1.243
EAF2
ELL associated factor 2
6.450
0.884
NM_018456
NM_000041
B
OB, M
APOE
Apolipoprotein E
6.896
-2.391
AB012643
B
OB
ALPL
Alkaline phosphatase, liver/bone/kidney
-5.942
-1.213
NM_002229
B
OB
JUNB
Jun B proto-oncogene
5.053
-3.804
NM_003377
A, B
VEGFB
Vascular endothelial growth factor B
3.238
-3.772
NM_005429
A, B
VEGFC
Vascular endothelial growth factor C
5.304
0.473
NM_000963
B
OB
PTGS2
Prostaglandin-endoperoxide synthase 2
4.346
-0.842
CCAAT/enhancer binding protein, beta
4.273
-4.092
Inhibitor of DNA binding 1
3.923
-1.996
Matrix Gla protein
2.791
-3.073
NM_005194
AL353944
NM_000900
M14584
NM_006350
AL353944
B
OB
CEBPB
A, B
OB
ID1
B
OB
MGP
A, B, C
OB, OC, CB
IL6
Interleukin 6
2.589
-3.612
B, C
OB, CB
FST
Follistatin
-2.137
-7.912
FST
0.38
B
OB
RUNX2
Runt-related transcription factor 2
1.611
1.050
RUNX2
2.07
TGFB1
Transforming growth factor, beta 1
2.739
3.054
TGF-β/BMP pathway components and modulators
M38449
AK021486
A, B, C
OB, OC, CB
B, C
OB, CB
BMP5
Bone morphogenetic protein 5
-10.314
-2.263
NM_002192
A, B, C
OB, OC, CB
INHBA
Inhibin, beta A
-7.699
-0.389
INHBA
0.31
NM_006350
B, C
OB, CB
FST
Follistatin
-2.137
-7.912
FST
0.38
Page 10 of 21
(page number not for citation purposes)
Available online />
Table 4 (Continued)
WNT and TGF-β/BMP signalling pathway components and target genes differentially expressed in OA bone
NM_004612
B
TGFBR1
NM_000118
A
ENG
NM_001105
B
NM_003573
-4.915
1.049
Endoglin
4.131
-2.461
ACVR1
Activin A receptor, type I
3.791
-0.941
LTBP4
OB
Transforming growth factor, beta receptor I
Latent transforming growth factor beta
binding protein 4
-4.060
2.623
NM_005902
A, B
OB
SMAD3
SMAD, mothers against DPP homolog 3
4.119
-3.582
NM_005359
A, B
OB
SMAD4
SMAD, mothers against DPP homolog 4
3.957
0.156
NM_002165
A, B
OB
ID1
Inhibitor of DNA binding 1
3.923
-1.996
NM_002229
B
OB
JUNB
Jun B proto-oncogene
5.053
-3.804
NM_005655
B
OB
KLF10
Kruppel-like factor 10
4.443
-4.449
NM_006037
B
OB
HDAC4
Histone deacetylase 4
8.475
2.468
NM_000168
B
OB
GLI3
GLI-Kruppel family member GLI3
-4.675
-0.298
AL353944
B
OB
RUNX2
Runt-related transcription factor 2
1.611
1.050
FGFR1
Fibroblast growth factor receptor 1
4.234
1.993
IGFBP7
Insulin-like growth factor binding protein 7
5.137
-6.302
Integrin, beta 2 (CD18)
6.104
-1.243
SMAD3
2.64
RUNX2
2.07
ITGB2
2.95
CTNNB1
2.38
TGF-β/BMP inducible/target genes
AK001052
B
NM_001553
A
NM_000211
B
OC
AK001060
OB
ITGB2
B, C
OB, CB
DCN
Decorin
-6.325
2.628
NM_000177
B
OC
GSN
Gelsolin
4.725
-2.387
X55525
B
OB
COL1A2
Collagen, type I, alpha 2
5.538
-3.633
NM_003118
A, B
OB
SPARC
Secreted protein, acidic, cysteine-rich
3.188
-1.844
NM_004407
B
OB, OS
DMP1
Dentin matrix acidic phosphoprotein
-3.523
-1.397
NM_001831
A, B
Clusterin
4.803
-2.030
CLU
Not represented on Compugen human 19K microarray
NM_001904
A, B
OB, OC
CTNNB1
Catenin beta 1
'Role' indicates the known or suspected role of the gene: A, angiogenic; B, osteogenic; and C, chondrogenic. 'Cell type' indicates the cell type
that the gene is expressed in or affects: OB, osteoblast, OC, osteoclast, OS, osteocyte, CB, chondroblast, or M, monocyte. 't OA/CTL' is the t
score of osteoarthritis (OA) compared with control (CTL) differential expression of gene: a positive value indicates upregulation in OA and a
negative one indicates downregulation in OA. 't OA/OP' is the t score of OA compared with osteoporosis (OP) differential expression of gene: a
positive value indicates upregulation in OA and a negative one indicates downregulation in OA. The moderated t-statistic score is based on the
ratio of the log2 fold change to its standard error. 'OA/CTL' under 'Real-time PCR' indicates the fold change in gene expression expressed as ratio
of OA to CTL. BMP, bone morphogenic protein; TGF, transforming growth factor.
4. The differences in expression of this group of genes (t
scores above 3) in general were not as pronounced as that
seen for the target genes identified from within the top-ranking
150 genes.
In addition, a significant number of TGF-β/BMP signalling
pathway target genes were identified as being differentially
expressed in OA bone (Table 3). TGF-β/BMP signalling pathway targets included downregulated genes such as
ADAMTS4, ADM, GADD45B, MEPE and COL4A1. The
altered expression of these genes also suggests that TGF-β/
BMP signalling may be perturbed in the OA bone microenvironment. Additional evidence for this was that genes for TGFβ/BMP signalling pathway components and modulators, such
as TGFB1, BMP5, INHBA, SMAD3 and FST, were also identified in the extended list of differentially expressed genes in
OA bone. These genes, and additional TGF-β/BMP target
genes identified, such as COL1A2, GSN, DMP1 and ITGB2,
are listed in Table 4. The differences in expression of this
group of genes (t scores above 3) was not as pronounced as
the target genes identified from within the top-ranking 150
genes.
Like the top-ranking list of 150 differentially expressed genes
in OA bone, many of the WNT and TGF-β/BMP signalling
pathway related genes identified in Table 4 also have known
or suspected roles in either osteoblast (WNT5B, PTEN,
CD14, SMAD3, RUNX2, ID1, HDAC4, TGFB1, BMP5,
Page 11 of 21
(page number not for citation purposes)
Arthritis Research & Therapy
Vol 9 No 5
Hopwood et al.
INHBA, DMP1 and FST) or osteoclast (CD14, PTEN,
FOXP1, ANXA2, ITGB2, IL6 and GSN) differentiation and
function.
The differential expression of a selection of these WNT and
TGF-β/BMP signalling pathway component and target genes
was confirmed by real-time PCR. In total, the differential
expression of 11 genes was examined by real-time PCR (Table
4). The differential expression of two genes (LRP1 and
IGFBP7) could not be confirmed. However, results for the
other nine genes reached statistical significance (P < 0.01) for
differential expression between OA and control bone.
CTNNB1 was assayed directly by real-time PCR because it
was not represented on the Compugen H19K library. Seven of
the remaining nine genes (with FST and RUNX2 being the
exceptions) were represented in the top-ranking 300 genes
differentially regulated in OA bone. These genes were tested,
like those listed in Table 3, using female control samples 1 to
8 and female OA samples 12 to 19 (Table 1). The range of fold
difference in expression identified by the real-time PCR reactions was slightly smaller (ranging from 0.3-fold change to
3.47-fold change in expression) than for the group of genes
tested from the top ranking 150 genes in Table 3.
Identification of differentially expressed OA genes
between females and males
There is a higher incidence of primary hip OA in females than
in males [1], and we were interested in identifying differences
in gene expression between females and males that may contribute to this disparity. Therefore, we tested for differences
between the OA-control female and male microarray datasets.
Genes with the greatest difference in expression between
females and males in the OA-control microarray comparisons
are listed in Table 5. There were very few significant differences in gene expression between females and males. However, approximately 50 genes with t scores above 3, which
included the top-ranking 20 genes with t scores above 4, were
identified as being differentially expressed between females
and males. Interestingly, a significant proportion of these
genes have known or suspected roles in osteoclast-lineage
cells and osteoclasts (GSN, PTK9, VCAM1, ITGB2, GRN,
ANXA2, PDE4A and FOXP1). There are also genes with
known roles in osteoblasts (LTF, DF, PRKCG and TGFB1). A
number of the highest ranking differentially expressed genes
between females and males in OA bone also involve WNT signalling pathway components, including WNT5B, along with
the EAF2 and CTBP2 genes, which encode transcription factors that are involved in mediating WNT signalling.
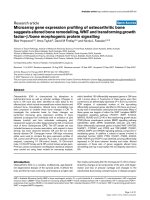
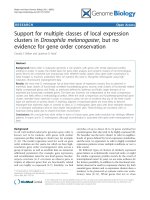
The differential expressions of WNT5B and ITGB2 (along with
MMP25) between females and males in OA bone were confirmed by real-time PCR (Figure 2). MMP25 was not originally
identified as being differentially expressed between females
and males in OA bone by microarray analysis. WNT5B, ITGB2
and MMP25 were all found to be differentially expressed only
Page 12 of 21
(page number not for citation purposes)
in females, and not in males, between OA and control bone.
The OA/control ratios of expression for the WNT5B gene
were 2.52 in female samples (P < 0.01) and 0.92 in male samples (P = 0.7486); those for the ITGB2 gene were 2.95 (P <
0.01) and 1.35 (P = 0.1173), respectively; and those for the
MMP25 gene were 2.60 (P < 0.01) and 1.01 (P = 0.4748),
respectively. There was also a significant difference in the total
expression levels of these three genes between females and
males, being approximately 6-fold, 14-fold and 23-fold higher
for WNT5B, MMP25 and ITGB2, respectively, in females than
in males in OA bone. Thirteen other genes (ADAM8, ADM,
ADAMTS4, ADFP, CD14, COL14A1, GADD45B, LRP1,
S100A4, SMAD3, TGFBI, TIMP4 and TWIST1) were also
tested for differential expression between females and males
in OA bone, but none of these was found to be differently
expressed (data not shown). Genes were tested using female
control samples 1 to 8 and OA samples 12 to 19 as compared
with male control samples 37 to 44 (age range 60 to 85 years;
mean [ ± SD] age 70.4 ± 7.3 years) and OA samples 47 to 54
(62 to 85 years; 70.3 ± 8 years; Table 1). The mean ages of
the female and male OA groups did not significantly differ from
those of the control groups. Of the other 13 genes examined
by PCR, only SMAD3 had significant differences in total
expression levels between males and females, being approximately 2-fold higher in males than in females (Figure 2). However, SMAD3 was similarly differentially regulated between
OA and control bone in both females and males (ratio of OA/
control: 2.64 in females [P < 0.01] and 2.08 in males [P <
0.01]).
Discussion
In this study we identified altered expression of WNT and
TGF-β/BMP signalling pathway component and target genes
in OA bone distal to the disease site (from the IT region of the
proximal femur). This was accomplished by using microarray
analysis to compare gene expression in bone from individuals
with end-stage OA disease and individuals without obvious
OA (control or OP). The genes identified include those with
known or suspected roles in osteoblast, osteocyte and osteoclast differentiation and function, as well as angiogenesis, suggesting perturbation of these processes and a role for altered
bone remodelling in OA pathogenesis.
The trabecular bone sampled in this study included all of the
cellular elements of bone, including the bone marrow. This has
provided a 'snapshot' of the gene expression in OA bone, with
contributions from all of the different cells in the bone
microenvironment. Although the specific cell type(s) contributing to the altered gene expression cannot readily be identified,
osteoblasts and osteocytes, which represent the most abundant cells in the trabecular bone [57], would be expected to
contribute significantly to the altered gene expression measured. In addition, because we have analyzed bone from endstage OA, it is difficult to determine unequivocally that the
altered gene expression detected in the OA bone is causal or
Available online />
Table 5
Genes differentially expressed between female and male OA and control bone samples
GenBank
Role
Cell type
Symbol
Name
t OAF/OAM
t OA/CTL
t OA/OP
Differentially expressed genes in top 20 regulated genes
NM_000177
B
OC
GSN
Gelsolin
5.983
4.725
-2.387
NM_001078
B
OB, OC
VCAM1
Vascular cell adhesion molecule 1
5.158
-1.358
-2.377
NM_006764
IFRD2
Interferon-related developmental regulator 2
-5.081
4.274
2.162
NM_018456
EAF2
ELL associated factor 2
4.574
6.450
0.884
NM_002087
B
OC
GRN
Granulin
4.562
11.161
-2.008
NM_000211
B
OC
ITGB2
Integrin, beta 2 (CD18)
4.378
6.104
-1.243
NM_004203
PKMYT1
Protein kinase, membrane associated tyrosine/
threonine 1
-4.373
-3.375
1.741
NM_001329
CTBP2
C-terminal binding protein 2
-4.339
1.548
4.057
PDE4A
Phosphodiesterase 4A
-4.131
-1.565
3.337
COMMD8
COMM domain containing 8
4.118
3.264
-0.398
NM_006202
B
OB, OC
NM_017845
AY009399
B, C
OB, OC, CB
WNT5B
Wingless-type MMTV integration site family, member
5B
4.107
3.719
0.717
NM_002822
B
OC
PTK9
PTK9 protein tyrosine kinase 9
4.099
-0.597
-5.894
NM_002343
B
OB
LTF
Lactotransferrin
4.096
4.918
1.882
Additional differentially expressed genes in top 50 regulated genes
NM_005606
A, B
OB, OC
LGMN
Legumain
3.853
9.631
-4.470
NM_015946
A, B, C
OB, CB
ITGA1
Integrin, alpha 1
3.813
3.904
0.131
NM_004039
B
OB, OC
ANXA2
Annexin A2
3.754
5.716
-7.601
M14087
A, B
OB
LGALS1
Lectin, galactoside-binding, soluble,
3.705
4.583
-0.045
NM_006079
A, B
OB
CITED2
Cbp/p300-interacting transactivator with Glu/Asprich domain 2
3.591
8.580
-1.403
M38449
A, B, C
OB, OC, CB
TGFB1
Transforming growth factor, beta 1
-3.575
2.739
3.054
Z15114
A, B
OB
PRKCG
Protein kinase C, gamma
-3.570
0.018
3.741
NM_003639
B
OC
IKBKG
I kappa B kinase gamma
3.376
6.775
-1.704
AK026898
B
OC
FOXP1
Forkhead box P1
-3.348
-5.122
1.761
NM_001928
B
OB
DF
D component of complement (adipsin)
3.306
6.851
-0.991
NM_006037
B
OB
HDAC4
Histone deacetylase 4
3.272
8.475
2.468
NM_001742
B
OC
CALCR
Calcitonin receptor
-3.036
0.663
1.800
0.237
4.942
7.183
Not detected by microarray to be differentially regulated between females and males
NM_004142
A, B, C
OB, OC, CB
MMP25
Matrix metalloproteinase 25
'Role' indicates the known or suspected role of the gene: A, angiogenic; B, osteogenic; and C, chondrogenic. 'Cell type' indicates the cell type that
the gene is expressed in or affects: OB, osteoblast, OC, osteoclast, OS, osteocyte, or CB, chondroblast. 't OAF/OAM' is the t score of
osteoarthritis (OA) female compared with OA male differential expression of gene: a postive value indicates upregulation in OA female and a
negative one indicates downregulation in OA female. 't OA/CTL' is the t score of OA compared with CTL differential expression of gene: a positive
value indicates upregulation in OA and a negative one indicates downregulation in OA. 't OA/OP' is the t score of OA compared with osteoporosis
(OP) differential expression of gene: a positive value indicates upregulation in OA and a negative one indicates downregulation in OA. The
moderated t-statistic score is based on the ratio of the log2 fold change to its standard error.
secondary to the disease. However, by sampling the IT region
we have avoided secondary pathogenic changes that the
subchondral bone undergoes at the joint as the disease
progresses (such as sclerosis, osteophytes and cysts), which
could confound identification of altered gene expression
potentially responsible for the underlying subchondral bone
remodelling. Therefore, we suggest that the altered gene
expression identified in the IT region from OA bone may be
informative about underlying systemic OA disease mechanisms that also operate at the joint in the subchondral bone.
Page 13 of 21
(page number not for citation purposes)
Arthritis Research & Therapy
Vol 9 No 5
Hopwood et al.
Figure 2
PCR analysis of WNT5B, ITGB2, MMP25 and SMAD3 expression between females and males in OA bone. For each gene, a graph depicts relative
MMP25 and SMAD3 expression between females and males in OA bone
real-time PCR product/GAPDH cycle threshold (CT) ratios generated from osteoarthritis (OA) and control (CTL) female and male intertrochanteric
bone samples analyzed. The mean of eight samples for each sample group analyzed is represented by black diamonds (mean values given alongside). Asterisks signify statistical significance (P < 0.01) for differential gene expression between OA and CTL bone. F, female; M, male.
The first main finding of this study is that many of the top-ranking differentially expressed genes in OA bone (Table 3) have
known or suspected roles in osteoblast and osteocyte differentiation and function. (Also see Table 6 for descriptions of the
functions of selected genes: MEPE, IBSP, MT2A, ADM,
STC1, IGFBP3, GADD45B, ADAMTS4, S100A4 and
MMP25.) Significantly, the changes in expression of these
genes as a group suggest altered osteoblast and osteocyte
activity in OA bone, which is consistent with increased bone
volume fraction and under-mineralization previously reported
in OA bone [3,4,11,22-25]. For instance, MEPE (matrix extracellular phosphoglycoprotein), which is highly expressed in
osteoblasts and osteocytes, appears to be an important regulator of bone formation and mineralization. Targeted disruption
of MEPE has been found to result in increased bone formation
and bone mass [58]. MEPE was found to be downregulated
in OA bone, which is consistent with the increased trabecular
bone volume in OA. MMP25 (upregulated in OA bone)
encodes a metalloproteinase that plays a role in MMP2
activation [59], and MMP2 is a major effector in osteocytes,
with MMP2-/- mice exhibiting disrupted osteocytic networks
and altered bone remodelling and mineralization [60]. The
MMP2-/- mice have a complex bone phenotype that includes
reduced bone volume in the long bones. Upregulation of
MMP25 in OA bone is consistent with increased activity of
MMP2 and increased bone volume.
group is consistent with increased osteoclast numbers, activity and bone resorption, leading to the reduction of bone volume seen in OP. There was also a group of differentially
expressed genes identified in OA bone that have known or
potential roles in osteoclast function (Tables 3 to 5). However,
the overall change in expression of these genes, as a group,
was not as consistent as for those genes identified with osteoblast-related functions. For instance, the change in expression of a subset of these genes (ADAMTS4, GADD45B,
IGFBP3 and CSTA) is consistent with decreased osteoclast
activity and increased bone volume in OA, whereas the
change in expression of another subset of these osteoclastrelated genes (ADAM8, STC1, CCR2, RAC2, CRYAB,
CYP1B, CD14, PTEN, ANXA2 and GSN) suggests upregulated osteoclast activity (Table 6). It is now becoming clear
that, in addition to osteoblasts being intimately involved in
influencing osteoclast-lineage cell differentiation and function
[61], the converse may also be true [62,63]. As a result, perturbed osteoblast or osteoclast gene expression could lead to
complex changes in communication between these bone cell
types and their remodelling behaviour in OA bone. Therefore,
differential expression of a subset of the osteoclast-related
genes, suggesting upregulated osteoclast activity, is consistent with the increased levels of bone remodelling seen in OA
bone and perhaps a net gain of under-mineralized bone rather
than the net loss of bone volume seen in OP.
Interestingly, and in contrast to the large number of differentially expressed genes identified in OA bone with osteoblastrelated and osteocyte-related roles, a substantial group of topranking differentially expressed genes identified in OP bone
(data not shown) have known or suspected roles in osteoclastlineage cells. The change in expression of these genes as a
Important inter-relationships between bone remodelling and
angiogenesis are also now emerging, and so perturbations to
angiogenic molecular pathways could contribute to the
changes seen in OA bone. Consistent with a role for increased
angiogenesis in OA bone, leading to increased bone volume
and potentially turnover, is the upregulation of a group of top-
Page 14 of 21
(page number not for citation purposes)
Available online />
Table 6
Bone related-functions of a selection of differentially expressed genes in osteoarthritis bone
Gene
Description/function
References
Bone remodeling, osteoblast: upregulated in osteoarthritis (OA) bone
S100A4
Negative regulator of matrix mineralization in osteoblasts
[88,89]
MMP25
Metalloproteinase with role in matrix metalloproteinase (MMP)2 activation. Mice lacking MMP2 have disrupted
osteocytes and altered bone mineralization
[59,60]
Bone remodeling, osteoblast: downregulated in OA bone
MEPE
Extracellular matrix protein, highly expressed in osteocytes
[58]
IBSP
Major constituent of the bone matrix, thought to initiate and regulate mineralization
[90]
MT2A
Metallothionein proteins (also MT1L and MT1G) have roles in regulating osteoblast differentiation and
mineralization
[91,92]
ADM
Adrenomedullin stimulates osteoblast activity, but also interacts with and influences the effects of key bone
regulators insulin-like growth factor (IGF)1 and transforming growth factor (TGF)-β
[93,94]
STC1
Stanniocalcin inhibits calcium uptake and has inhibitory effect on bone growth during development
[95,96]
IGFBP3
Constitutive over-expression of IGF1-binding protein (IGFBP)3 impairs osteoblast proliferation and bone
formation
[97]
GADD45B
Mice deficient in GADD45B protein have defective bone mineralization
[98]
ADAMTS4
Metalloproteinase involved in remodelling extracellular matrix. Upregulated in fracture healing. Expressed in
osteocytes and osteoblasts
[99,100]
LTF
Lactotransferrin is an anabolic bone factor
[101]
DF
Adipsin inhibits osteoblastogenesis
[102]
Bone remodeling, osteoclast: upregulated in OA bone
ADAM8
Stimulatory role in osteoclast formation and differentiation
[103]
CCR2
Receptor for CC chemokine ligand (CCL)2, which promotes recruitment and fusion of monocytes/osteoclast
precursors
[104]
RAC2
Member of the Rho-GTPase subfamily. Involved in organisation of cytoskeleton and adhesion of osteoclasts to
bone
[105]
CD14
Monocyte/osteoclast precursor marker. CD14-deficient mice have increased bone mass
[106,107]
ANXA2
Stimulates osteoclast precursor proliferation and differentiation through production of granulocyte-macrophage
colony-stimulating factor (GMCSF) and receptor activator of nuclear factor-kB ligand (RANKL)
[108]
GSN
Gelsolin deficiency in mice blocks podosome assembly in osteoclasts and produces increased bone mass
[109]
ITGB2
Adhesion molecule important in cell-to-cell contacts during the early stage of osteoclast development
[110,111]
Bone remodeling, osteoclast: downregulated in OA bone
IGFBP3
Over-expression of IGFBP3 in mice increases osteoclast number and bone resorption
[97]
STC1
Stanniocalcin suppresses osteoclast activity
[96]
PTEN
Over-expression of PTEN suppresses RANKL-stimulated signal transduction during osteoclast differentiation
[112]
FOXP1
Transcriptional repressor that has role in modulating monocyte differentiation
[113]
PDE4A
Down-regulated during monocyte to macrophage/osteoclast differentiation
[114]
WNT pathway components and modulators: upregulated in OA bone
WNT5B
WNT ligand with roles in osteoblastogenic and chondrogenic differentiation
[68,69,70]
CTNNB1
Mice lacking b-catenin in osteoblasts develop severe osteopenia with increased osteoclastogenesis and
impaired osteoblastogenesis
[115]
AKT3
Member of the AKT kinase family. Role in regulating osteoblast lifespan
[116,117]
NHERF1
Mediates parathyroid hormone receptor signalling. Interacts with b-catenin, potentiating the effects of parathyroid
hormone (PTH) on WNT signalling in bone.
[118,119]
Page 15 of 21
(page number not for citation purposes)
Arthritis Research & Therapy
Vol 9 No 5
Hopwood et al.
Table 6 (Continued)
Bone related-functions of a selection of differentially expressed genes in osteoarthritis bone
WNT pathway components and modulators: downregulated in OA bone
FZD3
WNT5B co-receptor
[120]
PTEN
Modulates/antagonises WNT signalling. Roles in osteoclast and osteoblast differentiation
[112,117]
APC
Loss of APC in mice leads to increased bone mass
[115]
AXIN2
Negatively regulates both expansion of osteoprogenitors and maturation of osteoblasts through its modulation of
WNT signalling
[121]
TGF-β/bone morphogenic protein (BMP) pathway components and modulators: upregulated in OA bone
ACVR1
BMP and activin A receptor. Mutation in receptor causes ectopic osteogenesis
[122]
SMAD3
Important mediator of TGF-β signalling and regulator of osteoblastogenesis and bone formation
[80,82]
ID1
Transcription factor with roles in bone formation and osteoblast proliferation and differentiation
[123]
RUNX2
Key transcription factor involved in promoting osteoblast differentiation
[76]
TGF-β/BMP pathway components and modulators: downregulated in OA bone
TGFB1
Growth factor with key role in regulating bone development and metabolism
[34,80]
INHBA
TGF-β family member. Can act as either inhibitor or activator of bone formation and osteoblast differentiation
[124,125]
BMP5
Secreted signalling molecule involved in skeletal development and genetically implicated in OA
[29]
FST
TGF-β/BMP antagonist that inhibits osteoblast differentiation
[126]
ranking differentially expressed genes with recognized proangiogenic functions (MMP25, S100A4, FOSB, TFF3, CTSG
and LTB) and downregulation of a group of genes that negatively influence angiogenesis (HIG2, ADAMTS4, ANGPTL4,
STC1, KLF6, IGFBP3, TIMP4 and GDF15).
In addition, a subset of the genes with roles in osteoblasts,
particularly those that encode secreted, cell surface and extracellular matrix molecules, including ADM, IBSP, MMP25,
STC1, IGFBP3, WNT5B, FST, TGFB1, BMP5 and INHBA,
also have potential chondrogenic functions. Altered expression of many of these genes is consistent with the proposal
that similar altered expression of these genes in osteoblasts in
the subchondral bone microenvironment could interfere with
chondrocyte or cartilage metabolism. For instance, ADM,
which is downregulated in OA bone has a pro-chondrogenic
role [64]. Reduced levels of ADM could negatively affect
chondrocyte/cartilage metabolism.
The second significant and connected observation from this
study was that many of the top-ranking differentially expressed
genes identified in OA bone (with osteoblast, osteocyte and
osteoclast related roles) were WNT or TGF-β/BMP signalling
pathway target genes. This observation, on closer examination
of the ranked list of differentially expressed in OA bone, led to
the identification of additional sets of differentially expressed
genes that were WNT or TGF-β/BMP signalling pathway component or modulator genes. These data together suggest that
the WNT and TGF-β/BMP signalling pathways are altered in
OA bone and may play a role(s) in OA pathogenesis. Both the
Page 16 of 21
(page number not for citation purposes)
WNT and TGF-β/BMP signalling pathways have been implicated in influencing bone mass and bone remodelling [32-34]
and have been demonstrated to do this by controlling both
osteoblast and osteoclast differentiation and function [65-67].
WNT signalling, in terms of bone mass and bone remodelling,
is a very complex process that depends on the interplay of a
large number of WNT ligands, the receptors they complex
with, prevailing antagonists and particular combinations of βcatenin/transcription factor complexes that ultimately control
the expression of the target genes. Interestingly, the only gene
encoding a WNT ligand, WNT5B, that was identified as being
differentially expressed (upregulated in OA bone) in the
present study was recently demonstrated to increase in
expression during in vitro osteoblast differentiation [68]. The
protein encoded by WNT5B is known to have both stimulatory
and inhibitory effects on bone and cartilage cells, and signals
through both the canonical and noncanonical WNT signalling
pathways, depending on the receptor it complexes with at the
cell surface [68-70]. Along with WNT5B, there were also several other important WNT pathway related genes that were
altered in their expression in OA bone. Genes for the WNT5B
co-receptor FZD3 and extracellular WNT antagonist SFRP5
were under-expressed, relative to controls, suggesting
increased WNT signalling. Downregulation of the intracellular
signalling cascade genes PTEN, APC and AXIN2, and upregulation of CTNNB1, AKT3 and NHERF1 are also consistent
with increased WNT signalling. CTNNB1 encodes β-catenin,
which is the central downstream mediator of canonical WNT
signalling, which forms a complex with lymphoid enhancer fac-
Available online />
tor/T cell factor (LEF/TCF) transcription factors to modulate
target gene expression [71], whereas PTEN, APC, AXIN2,
AKT3 and NHERF1 gene products modulate β-catenin activity (Table 6).
Like WNT signalling, TGF-β/BMP signalling is similarly complex, with a large family of ligands, cognate receptors and
intracellular signalling molecules involved in the pathway,
exerting both stimulatory and inhibitory effects on bone remodelling. Several TGF-β/BMP signalling pathway component and
modulator genes that influence osteoblast function, bone
remodelling and bone mineralization were identified as altered
in OA bone. These included TGFB1, INHBA, ACVR1, BMP5,
FST and SMAD3 (Table 6).
There is significant crosstalk between the WNT and TGF-β/
BMP signalling pathways. β-Catenin, SMAD3 and runt-related
transcription factor (RUNX)2 potentially play important roles in
mediating the crosstalk between the WNT and TGF-β/BMP
signalling pathways via direct interactions and in complexes
with the TCF/LEF transcription factor family members in the
nucleus [72-75]. We observed increased RUNX2 expression
in OA bone in this study, which is consistent with increased
osteoblast differentiation and activity in OA bone. RUNX2,
which is a WNT inducible gene, encodes a transcription factor
that plays roles in mediating both WNT and TGF-β/BMP signalling, and is essential for osteoblast differentiation and skeletal development [66,75-77]. Intriguingly, decreased
expression of RUNX2 has been shown to reduce cartilage
destruction and subchondral bone changes in a mouse joint
instability OA model [78], suggesting a role for increased
RUNX2 expression in OA pathogenesis. An important role for
RUNX2 in OA pathogenesis is supported by our microarray
data. The products of several of the top-ranking differentially
expressed genes identified, such as TWIST1 (twist homologue 1) [79], FOXF1 (forkhead box F1), ID1 (inhibitor of DNA
binding 1), HDAC4 (histone deacetylase 4) and SMAD3,
modify RUNX2 expression or interact with and modify RUNX2
function. SMAD3 is an important mediator of TGF-β regulation
of bone mechanical properties and composition [80]. TGF-β
represses RUNX2, and one of the ways it does this is through
recruitment of the histone deacetylase HDAC4 by SMAD3
[81]. However, SMAD3 over-expression (SMAD3 was upregulated in OA bone in the present study) has also been
reported to induce RUNX2 expression and osteoblast differentiation [82]. Significantly, several of the highest ranking differentially expressed genes identified in this study in OA bone
are targets of RUNX2 and SMAD3, such as GADD45B [83],
ADAMTS4 [84] and MEPE [82].
Finally, the molecular mechanisms that are responsible for the
greater incidence of OA in females are not known. Genes may
operate differently in the two sexes, at different body sites and
on different disease features within body sites [27]. Interestingly, of the relatively small number of differences between
females and males in OA bone identified in this study, there
were significant numbers of genes that were involved in both
osteoclast (for example, ANXA2, GSN, ITGB2, FOXP1 and
PDE4A) and osteoblast (LTF, DF and TGFB1) function and
hence bone remodelling (Tables 5 and 6). Collectively, the differential expression of these genes is consistent with
increased bone turnover in OA females compared with males,
suggesting an OA disease mechanism and perhaps partly
accounting for a greater incidence of OA in females than in
males.
A number of the highest ranking differentially expressed genes
between OA females and males include WNT signalling pathway components such as WNT5B and the transcription factor
genes EAF2 and CTBP2. In addition MMP25 and ITGB2 are
WNT target genes, suggesting a difference between females
and males in WNT signalling that may have an impact on the
OA bone microenvironment. There is also evidence of crosstalk between WNT and oestrogen signalling pathways via
functional interaction between β-catenin and oestrogen receptor-α [85]. A number of the genes identified in our study,
including WNT5B, ITGB2, GSN, VCAM1, LTF and DF, are
affected by oestrogen, potentially providing a mechanism by
which they are differentially expressed in females compared
with males. Examples of sexual dimorphism in mammalian
gene expression related to different responses to disease by
females and males are beginning to be identified [86]. The differences in expression levels of WNT5B, ITGB2 and MMP25
detected between females and males in OA bone is of interest
and marks these genes as good candidates for further investigation into the sex disparity in OA.
In this study we observed small gene expression ratios in both
microarray and real-time PCR analyses. These are probably
contributed by the complex mix of cells being assayed, along
with the subtle changes to bone that are observed in OA distal
to the affected joint, and the often slow, age-dependent onset
of the disease. Furthermore, OA is a multifactorial, multigene
disorder (and perhaps even a heterogenous group of disorders that lead to similar bone changes, cartilage degeneration
and ultimately loss of joint function). Therefore, it is to be
expected that many genes and small changes in the expression of these genes would be involved in OA pathogenesis.
Microarray analysis is able to reliably detect small (<2-fold)
changes that prove to be biologically relevant [87], and in our
study we were able to confirm the large majority of the differentially expressed genes by real-time PCR analysis.
Furthermore, the power of the microarray analysis approach
lies in its ability to detect genome-wide, coordinated, or similarly regulated differential gene expression, pointing to perturbed signalling pathways and importantly downstream
molecular processes. Our study has identified such relationships between commonly regulated target genes (via WNT
and TGF-β/BMP signalling pathways) that play roles, in partic-
Page 17 of 21
(page number not for citation purposes)
Arthritis Research & Therapy
Vol 9 No 5
Hopwood et al.
ular, in osteoblasts, osteocytes and osteoclasts, potentially
influencing bone formation, mineralization and remodelling.
5.
6.
Conclusion
In conclusion, we identified altered gene expression in bone
from individuals with primary hip OA at a site distal to the
diseased joint. This information is of interest because it identifies genes that potentially play roles in systemic physiological
bone turnover or in skeletal disease processes, and implicate
altered WNT and TGF-β/BMP signalling in OA pathogenesis.
Further work sampling from individuals with early OA will be
required to determine whether the genes identified as differentially expressed in OA bone are causal or secondary to the
altered bone seen in OA.
7.
8.
9.
Competing interests
The authors declare that they have no competing interests.
10.
Authors' contributions
NLF and DMF conceived the study. BH contributed to study
design and performed the acquisition of the microarray and
real-time PCR data. AT advised on the microarray experiment
design and performed the statistical analyses of the microarray
data. BH and AT analyzed and interpreted the data. BH, DMF
and NLF prepared the manuscript. All authors read and
approved the final manuscript.
Acknowledgements
The authors thank the donors and donors' families for their kind donation
of bone tissue used for this study. The authors thank the orthopaedic
surgeons and nursing staff of The Department of Orthopaedics and
Trauma in the Royal Adelaide Hospital for support and cooperation in
the collection of femoral specimens and the mortuary staff of the Institute of Medical and Veterinary Science for the collection of autopsy
specimens. Thanks to Julia Kuliwaba and Helen Tsangari for processing
and preparation of RNA from a subset of the samples used in this work.
This work was supported by the National Health and Medical Research
Council (NHMRC). The Compugen human oligonucleotide library for the
microarray was purchased with Australian Cancer Research Foundation
(ACRF) funds through the AMF. We thank Ashley Connolly and Mark
Van der Hoek from the AMF for their guidance with the microarray experiments. We thank Tina Vincent from Discipline of Orthopaedics and
Trauma, University of Adelaide, for advice with real-time PCR
experiments.
11.
12.
13.
14.
15.
16.
17.
18.
19.
20.
References
1.
2.
3.
4.
Felson DT, Lawrence RC, Dieppe PA, Hirsch R, Helmick CG, Jordan JM, Kington RS, Lane NE, Nevitt MC, Zhang Y, et al.: Osteoarthritis: new insights. Part 1: the disease and its risk factors.
Ann Intern Med 2000, 133:635-646.
Hough AJ: Pathology of osteoarthritis. In Arthritis and Allied
Conditions: a Text Book of Rheumatology Volume 2. 14th edition.
Edited by: Koopman WJ. Philadelphia, PA: Lippincott Williams and
Wilkins; 2001:2167-2194.
Li B, Aspden RM: Composition and mechanical properties of
cancellous bone from the femoral head of patients with osteoporosis or osteoarthritis.
J Bone Miner Res 1997,
12:641-651.
Mansell JP, Tarlton JF, Bailey AF: Biochemical evidence for
altered subchondral bone collagen metabolism in osteoarthritis of the hip. Br J Rheumatol 1997, 36:16-19.
Page 18 of 21
(page number not for citation purposes)
21.
22.
23.
24.
Carlson CS, Loeser RF, Jayo MJ, Weaver DS, Adams MR, Jerome
CP: Osteoarthritis in cynomolgus macaques: a primate model
of naturally occurring disease. J Orthop Res 1994, 12:331-339.
Watson PJ, Hall LD, Malcolm A, Tyler JA: Degenerative joint disease in the guinea pig. Use of magnetic resonance imaging to
monitor progression of bone pathology. Arthritis Rheum 1996,
39:1327-1337.
Hayami T, Pickarski M, Zhuo Y, Wesolowski GA, Rodan GA,
Duong le T: Characterization of articular cartilage and
subchondral bone changes in the rat anterior cruciate ligament transection and meniscectomized models of
osteoarthritis. Bone 2006, 38:234-243.
Hayami T, Pickarski M, Wesolowski GA, McLane J, Bone A, Destefano J, Rodan GA, Duong le T: The role of subchondral bone
remodeling in osteoarthritis: reduction of cartilage degeneration and prevention of osteophyte formation by alendronate in
the rat anterior cruciate ligament transection model. Arthritis
Rheum 2004, 50:1193-1206.
Behets C, Williams JM, Chappard D, Devogelaer JP, Manicourt
DH: Effects of calcitonin on subchondral trabecular bone
changes and on osteoarthritic cartilage lesions after acute
anterior cruciate ligament deficiency. J Bone Miner Res 2004,
19:1821-1826.
Spector TD, Conaghan PG, Buckland-Wright JC, Garnero P, Cline
GA, Beary JF, Valent DJ, Meyer JM: Effect of risedronate on joint
structure and symptoms of knee osteoarthritis: results of the
BRISK randomized, controlled trial [ISRCTN01928173]. Arthritis Res Ther 2005, 7:R625-R633.
Dequeker J, Luyten FP: Bone mass and osteoarthritis. Clin Exp
Rheumatol 2000, 18:S21-S26.
Radin EL, Rose RM: Role of subchondral bone in the initiation
and progression of cartilage damage. Clin Orthop Relat Res
1986, 213:34-40.
Bailey AJ, Buckland-Wright C, Metz D: The role of bone in
osteoarthritis. Age Ageing 2001, 30:374-378.
Lajeunesse D: The role of bone in the treatment of
osteoarthritis. Osteoarthritis Cartilage 2004, 12:S34-S38.
Westacott CI, Webb GR, Warnock MG, Sims JV, Elson CJ: Alteration of cartilage metabolism by cells from osteoarthritic bone.
Arthritis Rheum 1997, 40:1282-1291.
Sanchez C, Deberg MA, Piccardi N, Msika P, Reginster JY, Henrotin YE: Osteoblasts from the sclerotic subchondral bone
downregulate aggrecan but upregulate metalloproteinases
expression by chondrocytes. This effect is mimicked by interleukin-6, -1beta and oncostatin M pre-treated non-sclerotic
osteoblasts. Osteoarthritis Cartilage 2005, 13:979-987.
Lyons TJ, McClure SF, Stoddart RW, McClure J: The normal
human chondro-osseous junctional region: evidence for contact of uncalcified cartilage with subchondral bone and marrow spaces. BMC Musculoskelet Disord 2006, 7:52.
Imhof H, Sulzbacher I, Grampp S, Czerny C, Youssefzadeh S, Kainberger F: Subchondral bone and cartilage disease: a rediscovered functional unit. Invest Radiol 2000, 35:581-588.
Gerber HP, Vu TH, Ryan AM, Kowalski J, Werb Z, Ferrara N: VEGF
couples hypertrophic cartilage remodeling, ossification and
angiogenesis during endochondral bone formation. Nat Med
1999, 5:623-628.
Fang TD, Salim A, Xia W, Nacamuli RP, Guccione S, Song HM,
Carano RA, Filvaroff EH, Bednarski MD, Giaccia AJ, et al.: Angiogenesis is required for successful bone induction during distraction osteogenesis. J Bone Miner Res 2005, 20:1114-1124.
Meury T, Verrier S, Alini M: Human endothelial cells inhibit
BMSC differentiation into mature osteoblasts in vitro by interfering with osterix expression.
J Cell Biochem 2006,
98:992-1006.
Gevers G, Dequeker J, Martens M, Van Audekercke R, NyssenBehets C, Dhem A: Biomechanical characteristics of iliac crest
bone in elderly women according to osteoarthritis grade at the
hand joints. J Rheumatol 1989, 16:660-663.
Fazzalari NL, Vernon-Roberts B, Manthey BA, Parkinson IH: Relationship between changes in articular cartilage and bone in
the femoral head in osteoarthritis of the hip. J Orthopaed
Rheumatol 1990, 3:155-169.
Fazzalari NL, Parkinson IH: Femoral trabecular bone of osteoarthritic and normal subjects in an age and sex matched group.
Osteoarthritis Cartilage 1998, 6:377-382.
Available online />
25. Nevitt MC, Lane NE, Scott JC, Hochberg MC, Pressman AR,
Genant HK, Cummings SR: Radiographic osteoarthritis of the
hip and bone mineral density. The Study of Osteoporotic Fractures Research Group. Arthritis Rheum 1995, 38:907-916.
26. Dequeker J, Boonen S, Aerssens J, Westhovens R: Inverse relationship osteoarthritis-osteoporosis: what is the evidence?
What are the consequences?
Br J Rheumatol 1996,
35:813-818.
27. Spector TD, MacGregor AJ: Risk factors for osteoarthritis:
genetics. Osteoarthritis Cartilage 2004, 12:S39-S44.
28. Brandi ML, Gennari L, Cerinic MM, Becherini L, Falchetti A, Masi
L, Gennari C, Reginster JY: Genetic markers of osteoarticular
disorders: facts and hopes. Arthritis Res 2001, 3:270-280.
29. Peach CA, Carr AJ, Loughlin J: Recent advances in the genetic
investigation of osteoarthritis.
Trends Mol Med 2005,
11:186-191.
30. Loughlin J, Dowling B, Chapman K, Marcelline L, Mustafa Z,
Southam L, Ferreira A, Ciesielski C, Carson DA, Corr M: Functional variants within the secreted frizzled-related protein 3
gene are associated with hip osteoarthritis in females. Proc
Natl Acad Sci USA 2004, 101:9757-9762.
31. Chung YS, Baylink DJ, Srivastava AK, Amaar Y, Tapia B, Kasukawa
Y, Mohan S: Effects of secreted frizzled-related protein 3 on
osteoblasts in vitro. J Bone Miner Res 2004, 19:1395-1402.
32. Krishnan V, Bryant HU, Macdougald OA: Regulation of bone
mass by Wnt signaling. J Clin Invest 2006, 116:1202-1209.
33. Canalis E, Economides AN, Gazzerro E: Bone morphogenetic
proteins, their antagonists, and the skeleton. Endocr Rev
2003, 24:218-235.
34. Janssens K, ten Dijke P, Janssens S, Van Hul W: Transforming
growth factor-beta1 to the bone.
Endocr Rev 2005,
26:743-774.
35. Kuliwaba JS, Findlay DM, Atkins GJ, Forwood MR, Fazzalari NL:
Enhanced expression of osteocalcin mRNA in human osteoarthritic trabecular bone of the proximal femur is associated
with decreased expression of interleukin-6 and interleukin-11
mRNA. J Bone Miner Res 2000, 15:332-341.
36. Fazzalari NL, Kuliwaba JS, Atkins GJ, Forwood MR, Findlay DM:
The ratio of messenger RNA levels of receptor activator of
nuclear factor kappaB ligand to osteoprotegerin correlates
with bone remodeling indices in normal human cancellous
bone but not in osteoarthritis. J Bone Miner Res 2001,
16:1015-1027.
37. Truong LH, Kuliwaba JS, Tsangari H, Fazzalari NL: Differential
gene expression of bone anabolic factors and trabecular bone
architectural changes in the proximal femoral shaft of primary
hip osteoarthritis patients. Arthritis Res Ther 2006, 8:R188.
38. Dequeker J, Mohan S, Finkelman RD, Aerssens J, Baylink DJ: Generalized osteoarthritis associated with increased insulin-like
growth factor types I and II and transforming growth factor
beta in cortical bone from the iliac crest. Possible mechanism
of increased bone density and protection against
osteoporosis. Arthritis Rheum 1993, 36:1702-1708.
39. Massicotte F, Lajeunesse D, Benderdour M, Pelletier JP, Hilal G,
Duval N, Martel-Pelletier J: Can altered production of interleukin-1beta, interleukin-6, transforming growth factor-beta
and prostaglandin E2 by isolated human subchondral osteoblasts identify two subgroups of osteoarthritic patients. Osteoarthritis Cartilage 2002, 10:491-500.
40. Collins D: The Pathology of Articular and Spinal Diseases London,
UK: Edward Arnold and Co; 1949.
41. Kuliwaba JS, Fazzalari NL, Findlay DM: Stability of RNA isolated
from human trabecular bone at post-mortem and surgery.
Biochim Biophys Acta 2005, 1740:1-11.
42. Adelaide
Microarray
Facility
[ro
array.adelaide.edu.au]
43. The Comprehensive R Archive Network
[]
44. Spot: Software for Analysis of Microarray Images [http://
experimental.act.cmis.csiro.au/Spot/index.php]
45. Yang YH, Buckley MJ, Speed TP: Analysis of cDNA microarray
images. Brief Bioinform 2001, 2:341-349.
46. Ritchie ME: Quantitative quality control and background correction for two-colour microarray data. In PhD thesis University
of Melbourne, Department of Medical Biology; 2004.
47. Gentleman RC, Carey VJ, Bates DM, Bolstad B, Dettling M, Dudoit
S, Ellis B, Gautier L, Ge Y, Gentry J, et al.: Bioconductor: open
48.
49.
50.
51.
52.
53.
54.
55.
56.
57.
58.
59.
60.
61.
62.
63.
64.
65.
66.
67.
68.
software development for computational biology and
bioinformatics. Genome Biol 2004, 5:R80.
Yang YH, Dudoit S, Luu P, Lin DM, Peng V, Ngai J, Speed TP: Normalization for cDNA microarray data: a robust composite
method addressing single and multiple slide systematic
variation. Nucleic Acids Res 2002, 30:e15.
Smyth GK: Linear models and empirical bayes methods for
assessing differential expression in microarray experiments.
Stat Appl Genet Mol Biol 2004, 3:. Article 3
Gene
Expression
Omnibus
(GEO)
[http://
www.ncbi.nlm.nih.gov/geo/]
KJ Livak, TD Schmittgen: Analysis of relative gene expression
data using real-time quantitative PCR and the 2(-Delta Delta
CT) Method. Methods 2001, 25:402-408.
National Centre for Biotechnology Information
[http://
www.ncbi.nlm.nih.gov]
Draghici S, Khatri P, Bhavsar B, Shah A, Krawetz SA, Tainsky MA:
Onto-Tools, the toolkit of the modern biologist: Onto-Express,
Onto-Compare, Onto-Design and Onto-Translate. Nucleic
Acids Res 2003, 31:3775-3781.
Beissbarth T, Speed TP: GOstat: find statistically overrepresented Gene Ontologies within a group of genes. Bioinformatics 2004, 20:1464-1465.
Dallas PB, Gottardo NG, Firth MJ, Beesley AH, Hoffmann K, Terry
PA, Freitas JR, Boag JM, Cummings AJ, Kees UR: Gene expression levels assessed by oligonucleotide microarray analysis
and quantitative real-time RT-PCR: how well do they
correlate? BMC Genomics 2005, 6:59.
Wang Y, Barbacioru C, Hyland F, Xiao W, Hunkapiller KL, Blake J,
Chan F, Gonzalez C, Zhang L, Samaha RR: Large scale real-time
PCR validation on gene expression measurements from two
commercial long-oligonucleotide microarrays.
BMC
Genomics 2006, 7:59.
Franz-Odendaal TA, Hall BK, Witten PE: Buried alive: how osteoblasts become osteocytes. Dev Dyn 2006, 235:176-190.
Gowen LC, Petersen DN, Mansolf AL, Qi H, Stock JL, Tkalcevic
GT, Simmons HA, Crawford DT, Chidsey-Frink KL, Ke HZ, et al.:
Targeted disruption of the osteoblast/osteocyte factor 45
gene (OF45) results in increased bone formation and bone
mass. J Biol Chem 2003, 278:1998-2007.
Nie J, Pei D: Direct activation of pro-matrix metalloproteinase2 by leukolysin/membrane-type 6 matrix metalloproteinase/
matrix metalloproteinase 25 at the asn(109)-Tyr bond. Cancer
Res 2003, 63:6758-6762.
Inoue K, Mikuni-Takagaki Y, Oikawa K, Itoh T, Inada M, Noguchi T,
Park JS, Onodera T, Krane SM, Noda M, et al.: A crucial role for
matrix metalloproteinase 2 in osteocytic canalicular formation
and bone metabolism. J Biol Chem 2006, 281:33814-33824.
Atkins GJ, Kostakis P, Welldon KJ, Vincent C, Findlay DM, Zannettino AC: Human trabecular bone-derived osteoblasts support
human osteoclast formation in vitro in a defined, serum-free
medium. J Cell Physiol 2005, 203:573-582.
Kim HJ, Zhao H, Kitaura H, Bhattacharyya S, Brewer JA, Muglia LJ,
Ross FP, Teitelbaum SL: Glucocorticoids suppress bone formation via the osteoclast. J Clin Invest 2006, 116:2152-2160.
Karsdal MA, Martin TJ, Bollerslev J, Christiansen C, Henriksen K:
Are nonresorbing osteoclasts sources of bone anabolic
activity? J Bone Miner Res 2007, 22:487-494.
Cornish J, Naot D: Amylin and adrenomedullin: novel regulators
of bone growth. Curr Pharm Des 2002, 8:2009-2021.
Glass DA II, Bialek P, Ahn JD, Starbuck M, Patel MS, Clevers H,
Taketo MM, Long F, McMahon AP, Lang RA, et al.: Canonical Wnt
signaling in differentiated osteoblasts controls osteoclast
differentiation. Dev Cell 2005, 8:751-764.
Alliston T, Choy L, Ducy P, Karsenty G, Derynck R: TGF-betainduced repression of CBFA1 by Smad3 decreases cbfa1 and
osteocalcin expression and inhibits osteoblast differentiation.
Embo J 2001, 20:2254-2272.
Karst M, Gorny G, Galvin RJ, Oursler MJ: Roles of stromal cell
RANKL, OPG, and M-CSF expression in biphasic TGF-beta
regulation of osteoclast differentiation. J Cell Physiol 2004,
200:99-106.
Hurson CJ, Butler JS, Keating DT, Murray DW, Sadlier DM,
O'Byrne JM, Doran PP: Gene expression analysis in human
osteoblasts exposed to dexamethasone identifies altered
developmental pathways as putative drivers of osteoporosis.
BMC Musculoskelet Disord 2007, 8:12.
Page 19 of 21
(page number not for citation purposes)
Arthritis Research & Therapy
Vol 9 No 5
Hopwood et al.
69. Church V, Nohno T, Linker C, Marcelle C, Francis-West P: Wnt
regulation of chondrocyte differentiation. J Cell Sci 2002,
115:4809-4818.
70. Shea CM, Edgar CM, Einhorn TA, Gerstenfeld LC: BMP treatment of C3H10T1/2 mesenchymal stem cells induces both
chondrogenesis and osteogenesis. J Cell Biochem 2003,
90:1112-1127.
71. Logan CY, Nusse R: The Wnt signaling pathway in development
and disease. Annu Rev Cell Dev Biol 2004, 20:781-810.
72. Jian H, Shen X, Liu I, Semenov M, He X, Wang XF: Smad3dependent nuclear translocation of beta-catenin is required
for TGF-beta1-induced proliferation of bone marrow-derived
adult human mesenchymal stem cells. Genes Dev 2006,
20:666-674.
73. Reinhold MI, Naski MC: Direct interactions of Runx2 and canonical Wnt signaling induce FGF18. J Biol Chem 2007,
282:3653-3663.
74. Labbe E, Letamendia A, Attisano L: Association of Smads with
lymphoid enhancer binding factor 1/T cell-specific factor
mediates cooperative signaling by the transforming growth
factor-beta and wnt pathways. Proc Natl Acad Sci USA 2000,
97:8358-8363.
75. Kahler RA, Westendorf JJ: Lymphoid enhancer factor-1 and
beta-catenin inhibit Runx2-dependent transcriptional activation of the osteocalcin promoter.
J Biol Chem 2003,
278:11937-11944.
76. Komori T: Regulation of osteoblast differentiation by transcription factors. J Cell Biochem 2006, 99:1233-1239.
77. Gaur T, Lengner CJ, Hovhannisyan H, Bhat RA, Bodine PV, Komm
BS, Javed A, van Wijnen AJ, Stein JL, Stein GS, et al.: Canonical
WNT signaling promotes osteogenesis by directly stimulating
Runx2 gene expression. J Biol Chem 2005, 280:33132-33140.
78. Kamekura S, Kawasaki Y, Hoshi K, Shimoaka T, Chikuda H, Maruyama Z, Komori T, Sato S, Takeda S, Karsenty G, et al.: Contribution of runt-related transcription factor 2 to the pathogenesis
of osteoarthritis in mice after induction of knee joint instability.
Arthritis Rheum 2006, 54:2462-2470.
79. Bialek P, Kern B, Yang X, Schrock M, Sosic D, Hong N, Wu H, Yu
K, Ornitz DM, Olson EN, et al.: A twist code determines the
onset of osteoblast differentiation. Dev Cell 2004, 6:423-435.
80. Balooch G, Balooch M, Nalla RK, Schilling S, Filvaroff EH, Marshall
GW, Marshall SJ, Ritchie RO, Derynck R, Alliston T: TGF-beta
regulates the mechanical properties and composition of bone
matrix. Proc Natl Acad Sci USA 2005, 102:18813-18818.
81. Kang JS, Alliston T, Delston R, Derynck R: Repression of Runx2
function by TGF-beta through recruitment of class II histone
deacetylases by Smad3. Embo J 2005, 24:2543-2555.
82. Kaji H, Naito J, Sowa H, Sugimoto T, Chihara K: Smad3 differently affects osteoblast differentiation depending upon its differentiation stage. Horm Metab Res 2006, 38:740-745.
83. Major MB, Jones DA: Identification of a gadd45beta 3' enhancer
that mediates SMAD3- and SMAD4-dependent transcriptional
induction by transforming growth factor beta. J Biol Chem
2004, 279:5278-5287.
84. Thirunavukkarasu K, Pei Y, Moore TL, Wang H, Yu XP, Geiser AG,
Chandrasekhar S: Regulation of the human ADAMTS-4 promoter by transcription factors and cytokines. Biochem Biophys
Res Commun 2006, 345:197-204.
85. Kouzmenko AP, Takeyama K, Ito S, Furutani T, Sawatsubashi S,
Maki A, Suzuki E, Kawasaki Y, Akiyama T, Tabata T, et al.: Wnt/
beta-catenin and estrogen signaling converge in vivo. J Biol
Chem 2004, 279:40255-40258.
86. Rinn JL, Snyder M: Sexual dimorphism in mammalian gene
expression. Trends Genet 2005, 21:298-305.
87. Yao B, Rakhade RN, Li Q, Ahmed S, Krauss R, Draghici S, Loeb
JA: Accuracy of cDNA microarray methods to detect small
gene expression changes induced by neuregulin on breast
epithelial cells. BMC Bioinformatics 2004, 5:99.
88. Duarte WR, Shibata T, Takenaga K, Takahashi E, Kubota K, Ohya
K, Ishikawa I, Yamauchi M, Kasugai S: S100A4: a novel negative
regulator of mineralization and osteoblast differentiation. J
Bone Miner Res 2003, 18:493-501.
89. Mathisen B, Lindstad RI, Hansen J, El-Gewely SA, Maelandsmo
GM, Hovig E, Fodstad O, Loennechen T, Winberg JO: S100A4
regulates membrane induced activation of matrix metalloproteinase-2 in osteosarcoma cells. Clin Exp Metastasis 2003,
20:701-711.
Page 20 of 21
(page number not for citation purposes)
90. Ogata Y, Niisato N, Furuyama S, Cheifetz S, Kim RH, Sugiya H,
Sodek J: Transforming growth factor-beta 1 regulation of bone
sialoprotein gene transcription: identification of a TGF-beta
activation element in the rat BSP gene promoter. J Cell
Biochem 1997, 65:501-512.
91. Dohi Y, Shimaoka H, Ikeuchi M, Ohgushi H, Yonemasu K, Minami
T: Role of metallothionein isoforms in bone formation processes in rat marrow mesenchymal stem cells in culture. Biol
Trace Elem Res 2005, 104:57-70.
92. Liu AL, Zhang ZM, Zhu BF, Liao ZH, Liu Z: Metallothionein protects bone marrow stromal cells against hydrogen peroxideinduced inhibition of osteoblastic differentiation. Cell Biol Int
2004, 28:905-911.
93. Cornish J, Grey A, Callon KE, Naot D, Hill BL, Lin CQ, Balchin LM,
Reid IR: Shared pathways of osteoblast mitogenesis induced
by amylin, adrenomedullin, and IGF-1. Biochem Biophys Res
Commun 2004, 318:240-246.
94. Bodegas E, Martinez A, Ozbun LL, Garayoa M, Letterio JJ, Montuenga LM, Jakowlew SB: Depressed adrenomedullin in the
embryonic transforming growth factor-beta1 null mouse
becomes elevated postnatally. Int J Dev Biol 2004, 48:67-70.
95. Wu S, Yoshiko Y, De Luca F: Stanniocalcin 1 acts as a paracrine
regulator of growth plate chondrogenesis. J Biol Chem 2006,
281:5120-5127.
96. Filvaroff EH, Guillet S, Zlot C, Bao M, Ingle G, Steinmetz H, Hoeffel
J, Bunting S, Ross J, Carano RA, et al.: Stanniocalcin 1 alters
muscle and bone structure and function in transgenic mice.
Endocrinology 2002, 143:3681-3690.
97. Silha JV, Mishra S, Rosen CJ, Beamer WG, Turner RT, Powell DR,
Murphy LJ: Perturbations in bone formation and resorption in
insulin-like growth factor binding protein-3 transgenic mice. J
Bone Miner Res 2003, 18:1834-1841.
98. Ijiri K, Zerbini LF, Peng H, Correa RG, Lu B, Walsh N, Zhao Y, Taniguchi N, Huang XL, Out H, et al.: A novel role for GADD45beta
as a mediator of MMP-13 gene expression during chondrocyte
terminal differentiation. J Biol Chem 2005, 280:38544-38555.
99. Wang K, Vishwanath P, Eichler GS, Al-Sebaei MO, Edgar CM, Einhorn TA, Smith TF, Gerstenfeld LC: Analysis of fracture healing
by large-scale transcriptional profile identified temporal relationships between metalloproteinase and ADAMTS mRNA
expression. Matrix Biol 2006, 25:271-281.
100. Sone S, Nakamura M, Maruya Y, Takahashi I, Mizoguchi I, Mayanagi H, Sasano Y: Expression of versican and ADAMTS during
rat tooth eruption. J Mol Histol 2005, 36:281-288.
101. Cornish J, Callon KE, Naot D, Palmano KP, Banovic T, Bava U,
Watson M, Lin JM, Tong PC, Chen Q, et al.: Lactoferrin is a
potent regulator of bone cell activity and increases bone formation in vivo. Endocrinology 2004, 145:4366-4374.
102. Zayzafoon M, Gathings WE, McDonald JM: Modeled microgravity inhibits osteogenic differentiation of human mesenchymal
stem cells and increases adipogenesis. Endocrinology 2004,
145:2421-2432.
103. Choi SJ, Han JH, Roodman GD: ADAM8: a novel osteoclast
stimulating factor. J Bone Miner Res 2001, 16:814-822.
104. Kim MS, Magno CL, Day CJ, Morrison NA: Induction of chemokines and chemokine receptors CCR2b and CCR4 in authentic
human osteoclasts differentiated with RANKL and osteoclast
like cells differentiated by MCP-1 and RANTES. J Cell Biochem
2006, 97:512-518.
105. Razzouk S, Lieberherr M, Cournot G: Rac-GTPase, osteoclast
cytoskeleton and bone resorption. Eur J Cell Biol 1999,
78:249-255.
106. Sorensen MG, Henriksen K, Schaller S, Henriksen DB, Nielsen
FC, Dziegiel MH, Karsdal MA: Characterization of osteoclasts
derived from CD14+ monocytes isolated from peripheral
blood. J Bone Miner Metab 2007, 25:36-45.
107. Johnson GB, Riggs BL, Platt JL: A genetic basis for the 'Adonis'
phenotype of low adiposity and strong bones. Faseb J 2004,
18:1282-1284.
108. Li F, Chung H, Reddy SV, Lu G, Kurihara N, Zhao AZ, Roodman
GD: Annexin II stimulates RANKL expression through MAPK.
J Bone Miner Res 2005, 20:1161-1167.
109. Chellaiah M, Kizer N, Silva M, Alvarez U, Kwiatkowski D, Hruska
KA: Gelsolin deficiency blocks podosome assembly and produces increased bone mass and strength. J Cell Biol 2000,
148:665-678.
Available online />
110. Tani-Ishii N, Penninger JM, Matsumoto G, Teranaka T, Umemoto T:
The role of LFA-1 in osteoclast development induced by cocultures of mouse bone marrow cells and MC3T3-G2/PA6
cells. J Periodontal Res 2002, 37:184-191.
111. Miura Y, Miura M, Gronthos S, Allen MR, Cao C, Uveges TE, Bi Y,
Ehirchiou D, Kortesidis A, Shi S, et al.: Defective osteogenesis of
the stromal stem cells predisposes CD18-null mice to
osteoporosis.
Proc Natl Acad Sci USA 2005,
102:14022-14027.
112. Sugatani T, Alvarez U, Hruska KA: PTEN regulates RANKL- and
osteopontin-stimulated signal transduction during osteoclast
differentiation and cell motility.
J Biol Chem 2003,
278:5001-5008.
113. Shi C, Zhang X, Chen Z, Sulaiman K, Feinberg MW, Ballantyne
CM, Jain MK, Simon DI: Integrin engagement regulates monocyte differentiation through the forkhead transcription factor
Foxp1. J Clin Invest 2004, 114:408-418.
114. Gantner F, Kupferschmidt R, Schudt C, Wendel A, Hatzelmann A:
In vitro differentiation of human monocytes to macrophages:
change of PDE profile and its relationship to suppression of
tumour necrosis factor-alpha release by PDE inhibitors. Br J
Pharmacol 1997, 121:221-231.
115. Holmen SL, Zylstra CR, Mukherjee A, Sigler RE, Faugere MC,
Bouxsein ML, Deng L, Clemens TL, Williams BO: Essential role
of beta-catenin in postnatal bone acquisition. J Biol Chem
2005, 280:21162-21168.
116. Almeida M, Han L, Bellido T, Manolagas SC, Kousteni S: Wnt proteins prevent apoptosis of both uncommitted osteoblast progenitors and differentiated osteoblasts by beta-catenindependent and -independent signaling cascades involving
Src/ERK and phosphatidylinositol 3-kinase/AKT. J Biol Chem
2005, 280:41342-41351.
117. Liu X, Bruxvoort KJ, Zylstra CR, Liu J, Cichowski R, Faugere MC,
Bouxsein ML, Wan C, Williams BO, Clemens TL: Lifelong accumulation of bone in mice lacking Pten in osteoblasts. Proc Natl
Acad Sci USA 2007, 104:2259-2264.
118. Sneddon WB, Syme CA, Bisello A, Magyar CE, Rochdi MD, Parent JL, Weinman EJ, Abou-Samra AB, Friedman PA: Activationindependent parathyroid hormone receptor internalization is
regulated by NHERF1 (EBP50).
J Biol Chem 2003,
278:43787-43796.
119. Kulkarni NH, Halladay DL, Miles RR, Gilbert LM, Frolik CA, Galvin
RJ, Martin TJ, Gillespie MT, Onyia JE: Effects of parathyroid hormone on Wnt signaling pathway in bone. J Cell Biochem 2005,
95:1178-1190.
120. Katoh M: WNT/PCP signaling pathway and human cancer
[review]. Oncol Rep 2005, 14:1583-1588.
121. Liu B, Yu HM, Hsu W: Craniosynostosis caused by Axin2 deficiency is mediated through distinct functions of beta-catenin
in proliferation and differentiation.
Dev Biol 2007,
301:298-308.
122. Shore EM, Xu M, Feldman GJ, Fenstermacher DA, Cho TJ, Choi IH,
Connor JM, Delai P, Glaser DL, LeMerrer M, et al.: A recurrent
mutation in the BMP type I receptor ACVR1 causes inherited
and sporadic fibrodysplasia ossificans progressiva. Nat Genet
2006, 38:525-527.
123. Maeda Y, Tsuji K, Nifuji A, Noda M: Inhibitory helix-loop-helix
transcription factors Id1/Id3 promote bone formation in vivo.
J Cell Biochem 2004, 93:337-344.
124. de Jong DS, van Zoelen EJ, Bauerschmidt S, Olijve W, Steegenga
WT: Microarray analysis of bone morphogenetic protein,
transforming growth factor beta, and activin early response
genes during osteoblastic cell differentiation. J Bone Miner
Res 2002, 17:2119-2129.
125. Wiater E, Vale W: Inhibin is an antagonist of bone morphogenetic protein signaling. J Biol Chem 2003, 278:7934-7941.
126. Abe Y, Abe T, Aida Y, Hara Y, Maeda K: Follistatin restricts bone
morphogenetic protein (BMP)-2 action on the differentiation
of osteoblasts in fetal rat mandibular cells. J Bone Miner Res
2004, 19:1302-1307.
Page 21 of 21
(page number not for citation purposes)