Báo cáo y học: "Dual energy x-ray absorptiometry analysis contributes to the prediction of hip osteoarthritis progression" pdf
Bạn đang xem bản rút gọn của tài liệu. Xem và tải ngay bản đầy đủ của tài liệu tại đây (727.23 KB, 8 trang )
Open Access
Available online />Page 1 of 8
(page number not for citation purposes)
Vol 11 No 6
Research article
Dual energy x-ray absorptiometry analysis contributes to the
prediction of hip osteoarthritis progression
Martha C Castaño Betancourt
1
, Jacqueline C Van der Linden
1
, Fernando Rivadeneira
2,4
,
Rianne M Rozendaal
3
, Sita M Bierma Zeinstra
3
, Harrie Weinans
1
and Jan H Waarsing
1
1
Orthopaedic Research Laboratory, Erasmus Medical Center, Dr Mollewaterplein 50, 3000 CA, Rotterdam. The Netherlands
2
Department of Internal Medicine, Erasmus Medical Center, Dr Mollewaterplein 50, 3000 CA, Rotterdam, The Netherlands
3
Department of General Practice, Erasmus Medical Center, Dr. Mollewaterplein 50, 3000 CA, Rotterdam, The Netherlands
4
Department of Epidemiology, Erasmus Medical Center, Dr. Mollewaterplein 50, 3000 CA, Rotterdam, The Netherlands
Corresponding author: Jan H Waarsing,
Received: 29 Jul 2009 Revisions requested: 19 Aug 2009 Revisions received: 28 Sep 2009 Accepted: 2 Nov 2009 Published: 2 Nov 2009
Arthritis Research & Therapy 2009, 11:R162 (doi:10.1186/ar2845)
This article is online at: />© 2009 Castaño Betancourt et al.; licensee BioMed Central Ltd.
This is an open access article distributed under the terms of the Creative Commons Attribution License (
which permits unrestricted use, distribution, and reproduction in any medium, provided the original work is properly cited.
Abstract
Introduction To determine if structural bone parameters
obtained from dual energy X-ray absorptiometry (DXA)
contribute to the prediction of progression of hip osteoarthritis
(OA) and to test if the difference between the most affected (O
A) hip and the contralateral hip adds to this prediction.
Methods The study group involves a prospective cohort of 189
patients that met the American College of Rheumatology (ARC)
classification criteria for hip osteoarthritis. Progression was
defined as 20% joint space narrowing or total hip replacement
within a two years follow up. Software was developed to
calculate geometrical aspects and bone mineral density (BMD)
in different regions of interest of the proximal femur. Logistic
regression was used to test if Kellgren and Lawrence (K-L)
scores and DXA parameters can predict progression of OA.
Models were compared using -2log likelihood tests, R
2
Nagelkerke and areas under the Receiver Operator
Characteristic curves, assessed using 10-fold cross validation.
Results The model that included the DXA variables was
significantly better in predicting hip OA progression than the
model with K-L score of the affected side alone (P < 0.01). The
addition of the differences in DXA parameters between the most
affected and contralateral hip in the superior part of the femoral
head, trochanteric and intertrochanteric area further improved
the prediction of progression (P < 0.05). K-L score of the
affected side was still the most significant single variable in the
models.
Conclusions DXA parameters can significantly contribute to the
prediction of progression in patients with hip osteoarthritis. The
analysis of the DXA differences between the hips of the patient
represents a small but significant contribution to this prediction.
These analyses show the importance of bone density changes
in the etiology of OA.
Introduction
Osteoarthritis (OA) is a degenerative joint disease character-
ized by progressive damage of the articulate cartilage, occa-
sional inflammation of the synovium, osteophytosis and
alterations in the subchondral bone. It is often hypothesized
that subchondral bone changes play an important role in either
initiation or progression of osteoarthritis [1,2]. Changes in
bone shape, bone mineral density (BMD) and subchondral
bone mechanical properties were reported in the presence of
radiographic signs of hip OA [3-8]. A number of studies were
performed that correlate radiographic osteoarthritis and/or
clinical symptoms with bone measurements based on dual
energy X-ray absorptiometry (DXA) that are typically per-
formed in relation to osteoporosis. These measures concern
BMD in the hip or spine at specific regions of interest such as
e.g. the femoral neck. This data is rather confusing and con-
AIC: an information criterion, it is a measure of the goodness of fit of an estimated statistical model. It is a tool for model selection; AUC: area under
the curve; BMC: bone mineral content; BMD: bone mineral density; BMI: body mass index; DXA: dual energy X-ray absorptiometry; FPR: false positive
rate; JSN: joint space narrowing; JSW: joint space width; K-L: Kellgren and Lawrence Score; OA: osteoarthritis; ROI: region of interest; ROC:
Receiver Operator Characteristic curves; TPR: true positive rate; ΔDXA: difference in DXA measurements within the hips of each subject; ΔK-L: dif-
ference in KL score within the hips of each subject.
Arthritis Research & Therapy Vol 11 No 6 Betancourt et al.
Page 2 of 8
(page number not for citation purposes)
flicting in many aspects. An increased local and remote BMD
has been reported in patients with radiographic hip OA [9],
suggesting an inverse relationship between osteoarthritis and
osteoporosis. This was confirmed by Goker et al. [10] in
patients that underwent total hip replacement, where the sub-
jects with high progression of Joint Space Narrowing (JSN) at
their contralateral hip had elevated BMD in both hip and spine.
Antoniades et al. only found this inverse relationship between
local BMD and osteophytosis and not with JSN [11]. Other
studies report an inverse relationship only in the affected hip
and even a decreased BMD at remote sites and the contralat-
eral hip [12,13]. This was further substantiated by Sandini et
al, finding higher bone mineral content (BMC) and larger area
in the DXA data from patients with hip OA [14]. Changed mus-
cle conditions and weight bearing may alter the load condi-
tions in OA and local bone density changes may be the result
of adaptation to an altered load distribution through the bone
structure. Altogether, there seems to be conflicting data con-
cerning the relationship between bone related parameters in
OA. The variables that have been analyzed using DXA are
often defined only in regions of interest such as the femoral
neck and vertebral body that are relevant for osteoporosis, for
which DXA has been specifically designed. Beck and cowork-
ers have designed methods to analyze a number of other
parameters that are related to biomechanical aspects of the
narrowest region of the proximal femur, an area of high interest
in osteoporosis [15]. However, for OA other regions might be
of more interest, such as the subchondral bone BMC or BMD.
The rate of progression of hip OA varies largely between
patients. Some patients with radiographic signs of initial hip
OA do not show disease progression for years. In other cases
the disease progresses relatively fast, e.g. needing total hip
replacement after less than two years after onset of the first
symptoms. The determinants of this progression are largely
unknown [16]. It is also unclear what the role is of BMD, BMC
or morphological bone variations on progression of hip OA.
Better understanding of the involvement of alterations in the
bone might allow early identification of cases and maybe even
provide opportunities for early intervention. Therefore, this
study aims to determine if structural bone geometry and den-
sity parameters as determined by hip DXA scans in the proxi-
mal femur, contribute to the prediction of OA progression.
Furthermore, we tested if the difference in these DXA-based
variables between the most affected and contralateral hip
adds to this prediction. Since left-right differences are inde-
pendent of biological variation in bone size or density we
hypothesize that these are better predictors of disease pro-
gression.
Materials and methods
Study population
This study includes primary care patients with osteoarthritis of
the hip derived from the glucosamine sulphate in hip osteoar-
thritis (GOAL) trial of the Erasmus Medical Center, with data
collected at baseline and every three months up to two years
follow-up. Details of the study have been described earlier
[17]. In summary, patients were eligible for inclusion in the
GOAL cohort when they met one of the American College of
Rheumatology (ACR) criteria for hip OA [18]. Patients that had
already undergone hip replacement surgery or those on the
waiting list for joint replacement were not included in the
study. In addition, eligible patients with a Kellgren & Lawrence
(K-L) score of 4, people with renal and/or hepatic disease, dia-
betes mellitus or with disabling co-morbidity were excluded.
Sex, age, height, weight, duration of complaints and body
mass index (BMI) were registered or measured in all OA
patients. For this study only participants with bilateral radio-
graphs and dual energy X-ray absorptiometry (DXA scans) of
adequate quality measured at baseline and after two years fol-
low up were included in the analyses. The Ethical Committee
of Erasmus MC approved the study protocol, and patients pro-
vided written informed consent.
Radiographic assessments
A strict protocol was used to enable correct measurements of
joint space narrowing at baseline and two years follow up. Pel-
vic radiographs were taken in weight bearing position with the
patient's hips at 15° internal rotation. From the digitized x-rays
the minimal joint space width (JSW) was assessed at the
medial, axial, superior and lateral points of the joint or any other
site where the JSW was minimal. The intraclass correlation
coefficient of the minimal joint space width measurement was
0.98. All the radiographs were scored at baseline according to
the Kellgren-Lawrence score from grades from 0 no osteoar-
thritis to 4 severe osteoarthritis [19].
DXA scan analysis
DXA-scans (DPX-Lunar, GE Healthcare, Waukesha, WI, USA)
from both hips were made at baseline ensuring 15° internal
rotation of the hips, similar to the protocol used for the radio-
graphs. A software tool was developed that enables evaluating
bone geometry and density parameters from DXA scans in
specified (non-conventional) regions of interest in the hip.
Regions of interest (ROI) of which we calculated BMD, BMC
and area size included the femoral head (divided in quarter and
arcs), femoral neck, acetabulum, trochanteric and inter-tro-
chanteric areas. Figure 1 presents a detailed definition of all
the DXA parameters. The analysis was performed using Mat-
lab (version 7.1.0, MathWorks Inc, Natick, Massachusetts,
USA). The software calculated the parameters in a semi-auto-
matic way. The major and minor trochanters were indicated
manually, as was the size and position of the femoral head
according to the location of the bony margins of the acetabu-
lum or acetabular rim, which were used as points of reference;
all other parameters were measured automatically. The neck
axis was positioned in the middle of the femoral neck, bisect-
ing the centre of the neck. The femoral axis was determined as
a line parallel to the femoral shaft passing through the middle
Available online />Page 3 of 8
(page number not for citation purposes)
point localized between the most external margins of the
femur. Geometry parameters and regions of interest (ROI) for
BMD, BMC or area measurements included the femoral head,
femoral neck, acetabulum, trochanteric and inter-trochanteric
areas. Figure 1 and Figure 2 show a detailed definition of all
the DXA parameters.
Progression of hip osteoarthritis
We defined progressive cases as those patients that pre-
sented joint space narrowing (JSN); a decreased joint space
width (JSW) compared to baseline of twenty percent (20%) or
more was considered positive for progression of hip OA
according to previously described criteria [20]. It takes into
account the big variability in the joint space that exists
between individuals. We included in the progression group
also those patients that received a total hip replacement (THR)
during the two-year follow up.
Statistical models
We evaluated a number of statistical regression models with
different combinations of the following variables: baseline Kel-
lgren and Lawrence (K-L); baseline DXA-based parameters
(both geometry and BMD or BMC related parameters); the K-
L score difference between the most affected and contralat-
eral hip at baseline (ΔK-L) and the difference between the
most affected vs. contralateral DXA-based parameters at
baseline (ΔDXA). All models were adjusted for age, weight,
height, and sex. To reduce the number of DXA variables to a
significant subset we used a backward stepwise method
using the Likelihood ratio test. Progression of OA was pre-
dicted using five different models: the first Model (1) was used
to investigate the contribution of the K-L score of the most
affected side to the prediction of progression (K-L); Model 2
was used to investigate the contribution of the DXA based
parameters of the most affected side to progression (DXA);
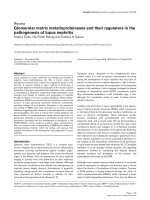
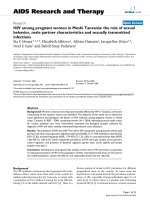
Figure 1
DXA images that show the parameters that are determined in the software for the DXA scan analysisDXA images that show the parameters that are determined in the software for the DXA scan analysis. a) Trochanteric area (TA), Neck shaft angle
(NSA), femoral neck length (NL): line from the center of the femoral head to the intersection point of the femoral shaft and femoral neck (FN). The
femoral head was divided in four quarters: Superior (S), Medial (M), Inferior (I), and lateral (L). b) Arcs dividing the upper part of the femoral head in
four sub regions ranging from the center of the subchondral region and acetabular area (A), neck width (NW) measured on the narrowest neck
region and intertrochanteric area (ITA). For all areas the BMD, BMC and area size were determined.
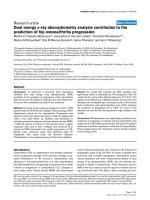
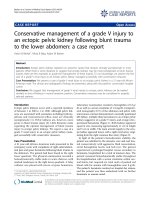
Figure 2
DXA image that shows the parameters of the DXA scan that are part of Model 5, which provides the overall best prediction of OA progressionDXA image that shows the parameters of the DXA scan that are part of
Model 5, which provides the overall best prediction of OA progression.
Superior area size (S), superior and medial (M) BMD and BMC from
the femoral head, Intertrochanteric and trochanteric area size (ITA and
TA, respectively).
Arthritis Research & Therapy Vol 11 No 6 Betancourt et al.
Page 4 of 8
(page number not for citation purposes)
Model 3 revealed how the combination of DXA parameters
and the K-L score of the most affected side contribute to the
prediction of progression (DXA + K-L); Model 4 was used to
test if adding the K-L difference within hips to the K-L score of
the affected side only improved the prediction of progression
of model 1 (K-L + ΔK-L); and Model 5 was used to test if the
difference of the most affected (OA) and contralateral hip
between the DXA parameters added to the prediction based
on K-L score of the affected side (K-L + ΔDXA).
The likelihood-ratio test was used to determine if the differ-
ences between the models were significant [21]. Using the
software package R we calculated An Information Criterion
(AIC) values of the various models. R is a programming lan-
guage and open source software environment for statistical
computing and graphics widely used for data analysis. AIC is
an index of the amount of information that is lost when the
model is used to describe the data [22]. The preferred model
is the one with the AIC value closest to zero. In all regression
models areas under the Receiver Operator Characteristic
curves (ROC) were determined and used to compare the dis-
criminatory capacity of the models. The Areas under the Curve
(AUC) represent the prediction probability that a randomly
selected pair of diseased and non-diseased subjects will be
correctly classified. A perfect predictive model has the value
AUC = 1.0. Conversely, a non-informative test has AUC = 0.5.
True positive and true negative rate were separately analyzed
to identify the percentage of OA cases and non-cases cor-
rectly predicted by the models. In addition, Nagelkerke R
2
was
used to measure the proportion of variability in a data set that
is accounted for by the statistical models. Nagelkerke's R
2
is a
modification of the Cox and Snell coefficient to assure that it
can vary from 0 to 1. Ten-fold cross validation was used to
reduce the error due to overfitting for the statistical estimates
(AIC and AUC). All statistical analysis were performed using
SPSS, version 14 (SPSS inc., Chicago, Illinois, USA) and R
version 2.7.2 (Free Software Foundation Inc., Boston, Massa-
chusetts, USA).
Results
Participant characteristics and progressor
characteristics
Out of the 222 patients that were enrolled in the trial, 189
patients had DXA scans of sufficient quality to be included in
the current study. Using our definition for progression 43 out
of 189 patients (22.8%) were considered to have developed
radiographic progression of hip osteoarthritis after two years
of follow-up (Table 1). Of the 43 patients that progressed, 17
(39.5%) received a total hip replacement and 26 had a JSN of
20% or more. We did not find significant differences in age,
sex, weight and height between the progression and non-pro-
gression groups (Table 1). The majority of the progressors
were found among patients with a K-L score of 2 and 3. There
were no progressors in the group with a baseline K-L score of
zero (Table 1). JSW decreased with increasing K-L score, with
slightly (but not significantly) lower baseline values for the pro-
gressor group (Table 2). The biggest differences in BMD or
BMC between progressors and non-progressors were found
in the regions close to the joint space (superior and medial
part of the head and the outer arcs 3 and 4, Table 3 and Figure
1). As expected, these values were higher (Z-score 0.39 to
0.48) for the progressors. The area of the entire femoral head
(all four quarters) and the femoral neck width also were signif-
icantly higher in the progressor group (Table 3).
Table 1
Baseline population characteristics of studied population
Characteristic n = 189 Progressor
n = 43
Non-progressor
n = 146
Age (years) mean +/- SD 63.5 +/- 9.0 64.2 +/- 8.7 63.2 +/- 9
- Age 41-60, n (%) 72 (38) 16 (37) 56 (38)
- Age 60-70, n (%) 117 (62) 27 (63) 90 (62)
Female, n (%) 131 (69) 26 (60) 105 (72)
Height, mean +/- SD 1.69 +/- .08 1.69 +/- .08 1.69 +/- .08
Weight, mean +/- SD 78.8 +/- 12.5 80 +/- 11.5 78.5 +/- 12.8
BMI (kg/m
2
), mean +/- SD 27.7 +/- 4.0 27.9 +/- 3.3 27.7 +/- 4.2
K-L score 0 12 0 12
K-L score 1 95 6 89
K-L score 2 57 21 36
K-L score 3 25 16 9
K-L score = Kellgren and Lawrence.
Available online />Page 5 of 8
(page number not for citation purposes)
Model results
The Kellgren and Lawrence score (K-L) proved to be a signifi-
cant predictor for progression. After cross-validation the area
under the Receiver Operator Curve (AUC) for Model 1 was
0.76 (Table 4). The true positive rate (TPR) of this model is
37.2%.
In the next model we analyzed the DXA scan parameters of the
affected side. The backward stepwise regression left only
three variables in the model: the BMC of the medial part of the
femoral head, the BMC of the inferior part of the femoral head
and the BMC of the femoral neck (Model 2). After cross-vali-
dation the model's performance was inferior to K-L in Model 1
(AUC = 0.69, Table 4). Similarly the true positive rate (TPR) of
this model was lower (9.3%).
In Model 3 we combined the predictors from Model 1 (K-L
score) with the predictors from Model 2 (the three BMC DXA
variables), which resulted in a model with reasonable good
predictive performance after cross-validation (AUC = 0.83).
The difference in AUC score of this model with the previous
two models proved to be significant (P < 0.05). The TPR of
34.92 was slightly less than Model 1, Table 4.
In Model 4 we added the K-L score difference (ΔK-L) between
the hips of each patient as a predictor to model 1 (K-L score
of the affected side only). Adding ΔK-L resulted in a significant
increase in AUC (P < 0.05) compared to Model 1. Both the
AUC (0.82) and the TPR (34.9%) were similar to the values for
Model 3, Table 4.
In the last model (Model 5) we combined K-L of the affected
side (Model 1) with the difference in DXA values between the
most affected and contralateral hip. The backward regression
resulted in a different set of DXA parameters than those iden-
tified by Model 2: The area size of the superior part of the fem-
oral head, the area of the major trochanter, the
intertrochanteric area and both the BMD and BMC of the
superior part and medial part of the femoral head were
selected (Figure 2). This model is significantly different to the
model that only includes K-L score of the affected side (Model
1) and to the model that uses the K-L score difference and the
value of the K-L score of the affected side (Model 4) based on
comparing AUC differences after cross-validation (P < 0.05).
The AUC of Model 5 (0.84) was not different from the AUC of
Model 3 (K-L + DXA most affected side; AUC: 0.83), but the
model is much better in the prediction of progressive cases
(with a TPR of 51.2%). Additionally, this model has the lowest
-2Log Likelihood ratio and AIC value (Table 4).
Discussion
In this study we analyzed how well selected DXA parameters
of the hip that were specifically chosen to be relevant for oste-
oarthritis, together with the accepted Kellgren & Lawrence
score contribute to the prediction of OA progression.
We found that both the K-L score and the selected DXA
parameters alone were not good predictors for OA progres-
sion, with K-L performing marginally better than the DXA
parameters alone. Interestingly, when both models were com-
bined the resulting model exhibited a small but significant
increase in performance as shown by the increase in AUC.
Apparently, the DXA parameters that were investigated in this
study refer to measures of OA that are relatively independent
of the Kellgren & Lawrence score. Many of the DXA parame-
ters themselves however, were not independent but highly
correlated among each other. The number of DXA variables
used in the regression models was reduced using the back-
ward stepwise method in the likelihood ratio test. Therefore
the resulting regression models are dependent on the back-
ward stepping procedure and other models that include other
parameters (representing similar aspects) might work just as
well. What is important here is not so much the meaning of the
specific parameters used in the regression models, but the
potential of DXA parameters for the prediction of OA progres-
sion, which justifies a more in depth study.
We further investigated if the prediction based on DXA param-
eters would improve when the difference between most
affected and contralateral side was used rather than the
affected side itself. We assumed that looking at the DXA dif-
ference between the most affected and contralateral side
would correct at least partly for the biological variation in bone
sizes and bone density. Thus, this measure could highlight
how the disease process has affected the bone and therefore
be a better predictor for disease progression. Even though the
AUC for the model that included this ΔDXA (Model 5) was only
slightly higher than the AUC of Model 3 (DXA parameters of
the most affected side and K-L score of the most affected
side), the percentage of correctly classified progression cases
(TPR) is much higher than in Model 3. Additionally, this model
(Model 5), showed a better statistical performance, lowest -
2Log, AIC and higher R
2
(Table 4: -2Log: 135.6, AIC: 153.6
and R
2
: 0.45) than any other model.
Table 2
JSW at baseline and follow up in progressor and non-
progressor groups according to KL score at baseline
K-L score Progressors Non-progressor
JSW bas JSW fu JSW bas JSW fu
0 N/A N/A 3.0 (0.7) 3.0 (0.6)
1 2.67 (0.9) 2.31 (1.2) 2.8 (0.5) 2.8 (0.6)
2 1.62 (0.83) 1.15 (0.64) 1.89 (0.75) 1.93 (0.73)
3 0.75 (0.7) 0.57 (0.7) 0.8 (0.9) 0.8 (1.1)
Values represent JSW in mm (mean and SD) at baseline and two
years follow up.
JSW = joint space width; KL score = Kellgren and Lawrence score
Arthritis Research & Therapy Vol 11 No 6 Betancourt et al.
Page 6 of 8
(page number not for citation purposes)
The definition of progression in this study included patients
with both JSN (more than 20%) and patients that received a
total hip replacement (THR) within the follow-up period of two
years [20]. The latter is maybe a possible limitation of this
study, because we cannot determine if the THR patients truly
exhibited joint space narrowing. We tested the effect of
excluding the THR patients to the models in a sensitivity anal-
ysis. In all models the exclusion of THR cases affects the per-
centage of correct predictions and AUC. However, the
general trends were similar and the model that included the
difference between the most affected- and the contralateral
side (Model 5) still remained the best predictive model.
Table 3
DXA variables for progressors and non-progressors
Variables Z-score
non-progressors
Z-score progressors Adjusted
p-value
BMC
Femoral Neck (FN) -0.07 0.16 0.17
Intertrochanteric Area (ITA) 0.02 0.07 0.9
Trochanteric area (TA) -0.01 0.02 0.6
Superior quart femoral head (S) -0.13 0.44 0.009
medial quart femoral head (M) -0.10 0.39 0.019
inferior quart femoral head (I) -0.07 0.24 0.08
lateral quart femoral head (L) -0.08 0.27 0.06
acetabular arc (A) -0.10 0.36 0.01
arc4 -0.12 0.45 0.003
arc3 -0.13 0.48 0.001
arc2 -0.11 0.37 0.02
arc1 -0.07 0.24 0.19
Areas/size
Femoral Neck (FN) -0.08 0.21 0.6
Intertrochanteric area (ITA) 0.02 -0.02 0.16
Trochanteric area (TA) 0 0 0.4
Superior quart femoral head (S) -0.15 0.47 0.002
medial quart femoral head (M) -0.12 0.50 0.002
inferior quart femoral head (I) -0.15 0.47 0.003
lateral quart femoral head (L) -0.15 0.49 0.003
Acetabular arc (A) -0.08 0.20 0.04
arc4 -0.01 0.04 0.005
arc3 -0.15 0.06 0.001
arc2 -0.10 0.10 0.007
Arc1 -0.07 0.32 0.2
Geometry
Neck width (NW) -0.14 0.38 0.04
Neck length (NL) 0.00 -0.04 0.41
Neck shaft angle (NSA) -0.02 0.08 0.7
Values represent the distance between the mean value of each variable for progressors and non progressors and the population mean in units of
the standard deviations. Z is negative when the group's mean is below the population mean. P value was adjusted by gender, age, height and
weight.
BMC = bone mineral content
Available online />Page 7 of 8
(page number not for citation purposes)
Other limitations of this study are related to the relatively short
follow-up and the inaccuracies inherent to the DXA measure-
ments. The limitations of the DXA method itself have been
exposed previously by other authors [23]. Radiological pro-
gression of osteoarthritis is better defined when patients have
longer follow up.
In addition the study population is rather heterogeneous with
patients that varied in (subjective) pain scores and ranged
from mild OA (K-L 0 and 1) to advanced stages (K-L 2 and 3).
It seems likely that the more degenerated joints at baseline
progress differently than a joint in the early phase of the dis-
ease. In terms of our definition of progression it is clear that
advanced OA joints with an already small JSW don't have to
progress much to reach a 20% narrowing. The majority of the
progressors are in the K-L scores 2 and 3 and since a K-L
score of 4 was an exclusion criterion we have no patients with
extreme low JSW (Table 2).
Different hypotheses exist about the role of BMD changes dur-
ing the osteoarthritis process. We had defined different
regions of interest of which some were close to the joint with
a putative effect on osteoarthritis development. Not only fem-
oral head regions were found to be relevant, but also the more
distant regions such as the femoral neck and trochanteric
regions. The difference in intertrochanteric area size (between
affected and contralateral hip) had a negative correlation with
progression and might be the consequence of muscular dys-
function of the hip abductor group that has been found in
patients with hip osteoarthritis [24,25].
Table 4
Models using clinical, radiological and DXA variables
Variables % Diff. & p -2 Log R
2
AIC AUC TNR TPR
1 KL score affected side: 30.7% (***) 159.5 0.31 163.5 0.76 93.2 37.2
2 DXA affected side: 184.2 0.15 192.2 0.69 97.3 9.3
- BMC medial part femoral head 13.9% (***)
- BMC inferior part femoral head 7.2% (***)
- BMC femoral neck 5%(*)
3 DXA affected side + KL: 148.6 0.38 158.6 0.83 93.9 34.9
- BMC medial part femoral head 13.9%(*)
- BMC inferior part femoral head 7.2%(*)
- BMC femoral neck 5%(**)
- KL affected side NA(***)
4 KL affected side + Delta KL 154.0 0.35 160 0.82 93.9 34.9
- KL score affected side NA(***)
- Delta KL 32%(*)
5 DXA ROI'S difference: 135.6 0.45 153.6 0.84 91.7 51.2
- Difference superior area fem head 16.5% (*)
- Difference trochanteric area size 2% (*)
- Difference BMD sup. part fem. head 5.7% (**)
- Difference BMC sup. part fem. head 9% (**)
- Difference BMD med. part fem. head 4.6% (**)
- Difference BMC med. part fem. head 4% (**)
- Difference Intertrochanteric area size -4.5% (*)
- KL score affected side NA(***)
The difference in values between affected hip and contralateral side is expressed in percentage (%). Positive values represent an increase in the
affected hip. No applicable (NA) in the cases that the variable only reflect the affected side. Level of significance codes: '***' P value < 0.001, '**'
P value < 0.01, '*' P value < 0.05. All models were corrected for patient characteristics. TPR and TNR columns correspond to the percentage
correctly predicted by the models. *Area under the curve value obtained after 10-fold cross validation process.
AIC = An Information Criterion; AUC = areas under the curve; DXA = dual energy X-ray absorptiometry; KL = Kellgren and Lawrence score of the
affected side; ROI = rate opf interest; TNR = true negative rate TPR = true positive rate
Arthritis Research & Therapy Vol 11 No 6 Betancourt et al.
Page 8 of 8
(page number not for citation purposes)
We also identified an increase in size at the femoral head and
trochanter and increased BMD and BMC of the superior and
medial part of the most affected femoral head compared to the
contra lateral side in the group of patients where the disease
progressed (Figure 2). The BMD and BMC increase in the
head regions is in concordance with published literature and
we suppose that the differences are acquired as part of the
osteoarthritis process and subsequent bone adaptation. How-
ever we cannot exclude the possibility that some of these left-
right differences existed previous to the onset of the disease.
Conclusions
We have shown that DXA scans of the hip contain information
that can be used to predict OA progression. Patients that pre-
sented OA progression had a higher BMC in the medial and
inferior region of the femoral head compared to those that did
not progress. Also, the bone mass in these regions was higher
in the most affected hip compared to the contralateral side.
These differences between the most affected hip and the con-
tralateral hip appear promising to predict progression of the
disease. Further study of DXA scans with improved resolution
could lead to the development of useful clinical tools to diag-
nose OA and predict the chances of fast progression.
Competing interests
The authors declare that they have no competing interests.
Authors' contributions
MC participated in the design of the study, analysis of DXA
images, performed the statistical analysis and drafts the man-
uscript. JL conceived the study and elaboration of the program
used to analyse the DXA images. RF participated in the statis-
tical analysis and helped to draft the manuscript. RR selected
the cohort and collected patient's information, SB participated
in the study design and helped to draft the manuscript. HW
conceived the study, participated in its design and coordina-
tion, and helped to draft the manuscript. JW participated in the
design of the study and design of the program used to analyse
the DXA images, helped to perform the statistical analysis and
draft the manuscript. All authors read and approved the final
manuscript.
Acknowledgements
Grant Support: This study was funded by the Dutch Arthritis Associa-
tion (nr. 04-1-402).
References
1. Burr DB: The importance of subchondral bone in the progres-
sion of osteoarthritis. J Rheumatol Suppl 2004, 70:77-80.
2. Radin EL, Rose RM: Role of subchondral bone in the initiation
and progression of cartilage damage. Clin Orthop Relat Res
1986, 213:34-40.
3. Li B, Aspden RM: Mechanical and material properties of the
subchondral bone plate from the femoral head of patients with
osteoarthritis or osteoporosis. Ann Rheum Dis 1997,
56:247-54.
4. Day JS, Linden J Van Der, Bank RA, Ding M, Hvid I, Sumner DR,
Weinans H: Adaptation of subchondral bone in osteoarthritis.
Biorheology 2004, 41:359-68.
5. Grynpas M, Alpert B, Katz I, Lieberman I, Pritzket K: Subchondral
bone in osteoarthritis. Calcif Tissue Int 1991, 49:20-26.
6. Bruno RJ, Sauer PA, Rosenberg AG, Block J, Sumner DR: The
pattern of bone mineral density in the proximal femur and radi-
ographic signs of early joint degeneration. J Rheumatol 1999,
26:636-640.
7. Gregory JS, Waarsing JH, Day J, Pols HA, Reijman M, Weinans H,
Aspden RM: Early identification of radiographic osteoarthritis
of the hip using an active shape model to quantify changes in
bone morphometric features: can hip shape tell us anything
about the progression of osteoarthritis? Arthritis Rheum 2007,
56:3634-43.
8. Buckland-Wright C: Subchondral bone changes in hand and
knee osteoarthritis detected by radiography. Osteoarthritis
Cartilage 2004, 12(Suppl A):S10-19.
9. Nevitt MC, Lane NE, Scott JC, Hochberg MC, Pressman AR,
Genant HK, Cummings SR: Radiographic osteoarthritis of the
hip and bone mineral density. The Study of Osteoporotic Frac-
tures Research Group. Arthritis Rheum 1995, 38:907-16.
10. Goker B, Sumner DR, Hurwitz DE, Block JA: Bone Mineral den-
sity varies as a function of the rate of joint space narrowing in
the hip. J Rheumatol 2000, 27:735-738.
11. Antoniades L, MacGregor AJ, Matson M, Spector TD: A cotwin
control study of the relationship between hip osteoarthritis
and bone mineral density. Arthritis Rheum 2000,
43:1450-5.
12. Makinen TJ, Alm JJ, Laine H, Svedstrom E, Aro HT: The incidence
of osteopenia and osteoporosis in women with hip osteoar-
thritis scheduled for cementless total joint replacement. Bone
2007, 40:1041-7.
13. Drees P, Decking J, Ghezel-Ahmadi V, Delank KS, Wilhelm B, Eck-
ardt A: The common occurrence of osteoarthritis and oste-
oporosis and the value of markers of bone turnover. Z
Rheumatol 2005, 64:488-98.
14. Sandini L, Jara PA, Jurvelin JS, Kroger H: Increased bone mineral
content but not bone mineral density in the hip in surgically
treated knee and hip osteoarthritis. J Rheumatol 2005,
32:1951-1957.
15. Beck TJ, Ruff CB, Warden KE, Scott WW Jr, Rao GU: Predicting
femoral neck strength from bone mineral data. A structural
approach. Invest Radiol 1990, 25:6-18.
16. Lievense AM, Bierma-Zeinstra S, Verhagen AP, Verhaar JA, Koes
BW: Prognostic factors of progress of hip osteoarthritis: a sys-
tematic review. Arthritis Rheum 2002, 47:556-62.
17. Rozendaal RM, Bart WK, Van Osch GJ, Uitterlinder EJ, Garling EH,
Willemsen SP, Ginai AZ, Verhaar JA, Weinans H, Bierma-Zeinstra
SM: Effect of glucosamine sulfate on hip osteoarthritis: a ran-
domized trial. Ann Intern Med 2008, 148:268-77.
18. Altman R, Alarcon G, Appelrouth D, Bloch D, Borestein D, Brandt
K, Brown C, Cooke TD, Daniel W, Feldman D: The American Col-
lege of Rheumatology criteria for the classification and report-
ing of osteoarthritis of the hip. Arthritis Rheum 1991,
34:505-14.
19. Kellgren JH, Lawerence JH: Radiological assessment of osteo-
arthrosis. Ann Rheum Dis 1957, 16:494-502.
20. Maillefert JF, Nguyen M, , Berdah L, Lequesne M, Mazieres B,
Vignon E, Dougados M: Relevant change in radiological pro-
gression in patients with hip osteoarthritis II Determination
using an expert opinion approach. Rheumatology (Oxford)
2002, 41:148-52.
21. Menard S: Statistical significance in logistic regression. In
Applied Logistic Regression Analysis. Series: Quantitative Appli-
cations in the Social Sciences 2nd edition. London: Sage Publica-
tions; 2002:43-47.
22. Gagne P, Dayton M: Best regression using information criteria.
University of Maryland; 2002.
23. Bolotin HH, Sievanen H, Grashuis JL, Kuiper JW, Jarvinen TL:
Inaccuracies inherent in patient-specific dual-energy X-ray
absorptiometry bone mineral density measurements: compre-
hensive phantom-based evaluation. J Bone Miner Res 2001,
16:417-26.
24. Amaro A, Amado F, Duarte JA Appell HJ: Gluteus medius muscle
atrophy is related to contralateral and ipsilateral hip joint oste-
oarthritis. Int J Sports Med 2007, 28:1035-1039.
25. Sims KJ, Richardson CA, Brauer SG: Investigation of hip abduc-
tor activation in subjects with clinical unilateral hip osteoarthri-
tis. Ann Rheum Dis 2002, 61:687-692.