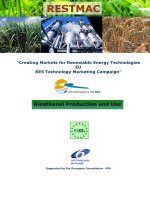
Renewable energy technologies for developing countries phần 5 docx
Bạn đang xem bản rút gọn của tài liệu. Xem và tải ngay bản đầy đủ của tài liệu tại đây (301.21 KB, 10 trang )
- 37 -
installed in Europe. A survey
14
showed the following details :
China = 4 million m
2
India = 2 million m
2
Turkey = 430,000 m
2
Israel = 400,000 m
2
South Korea = 40,000 m
2
Mexico = 11,000 m
2
USA = 25,000 m
2
Solar Water-Heating System :
A solar water-heater uses Sun’s energy rather than electricity or gas to
heat water, thus reducing the monthly utility bill. When installed properly,
solar-water heaters are more economical over the life of the system than
heating water with electricity, dedicated heat pumps, heat recovery units
or propane.There are about 10 million households with solar hot water
systems in the developing countries. In Pakistan, the solar systems used
are only at the research level in the laboratories. Three types of solar
systems are used : pumpedintegral Collector Storage (ICS), and thermo-
siphon solar water-heating system.
14. “Werne Weiss, “Time to come inform the cold the Solar Thermal Market in Europe”,
REW July August 2002, p. 92.
Source : REW/July - August 2002 (page 92)
Fig. 14 : Breakdown of enrgy consumption in residential
buildings in the EU, 1998
- 38 -
The direct circulation system circulates potable water from the water
storage tank through one or more collectors and back into the tank. The
solar collector is the main component of solar system. It is usually a metal
box with insulation and a black absorbing plate that collects solar radiation
and heats the water. The circulating pump is regulated by an electronic
controller, a common appliance timer, or a photovoltaic (PV) panel.
The Integral Collector Storage systems (ICS), the solar water storage
system is built into the collector. The potable water in the collector unit is
heated by the sun and delivered by water pressure to an auxiliary tank
(which contains non-solar back-up heating) or directly to the point of use.
A Thermo-siphon system has a tank mounted above the collector
(normally on the roof) to provide a natural flow of water through gravity .
Hot water rises through pipe in the collector, which is mounted below the
tank; heavier cold water sinks to the lowest point in the system (the
collector), displacing the lighter hot water, which rises to the tank. The
ICS and thermosiphon systems are simple since they use no pumps or
controllers and water always flows through the collector. There are about
10 million household with solar water systems in the developing countries.
iii) Small-Scale Uses :
Vegetable Dehydration : Various designs of solar dehydrators have
been tried all over the world. PCSIR has made a significant change
recently in Pakistani design which incorporates a solar-heated air current,
Figure 16 : Solar Water Heater
- 39 -
using a flat-plate collector. The hot air produced thus rises convectively,
enters the dehydration-chamber, and removes the evaporated moisture,
without adversely cooling the dehydrating batch. Thus both cleanliness of
the product and fueleconomy are ensured. These units have considerable
application for hygienically drying vegetables in villages, and fruits in
remote areas, which can then be packaged for marketing.
Solar Cooking : Numerous designs of Solar Cookers have been
developed and tested, varying in cost from US$ 2 to US$ 40 per unit.
About 800,000 small scale industries developing solar cookers, are also
functioning in the developing countries. The essential features are a set of
reflectors or a curved mirror for catching and concentrating Sun’s rays onto
the actual cooking chamber, and in some cases, a heat-storage material to
enable the cooker to be used when the sun is not shining.
(D) Wind energy
The non-uniform distribution of heat due to solar energy causes the
movement of hot and cold air over the earth’s surface, the winds being more
abundant on some areas of the earth than on others. An equivalent of 100
billion watts per year of wind energy is available on the earth. At sea, the
winds are even stronger than on the surface of land. On suitable windy
regions and particularly in coastal areas, windmills can be installed to produce
mechanical energy. Traditionally, windmills have been in use in China,
Iran, the Mediterranean and Northern Europe for a variety of purposes.
Simple windmills can be locally fabricated from local materials, but many
modern high-speed, horizontal as well as verticalaxis machines have been
designed, to give much higher efficiencies than the traditional designs.
Figure 17 : Solar Cooker
- 40 -
Source : Michael Grub and Niels Meyer, 1994
NB : The total potential (land with an average wind speed
above 5.1 m/s at 10 m height) has been reduced by 90% to
take into acount other uses, population density etc. The
assessment does not include Greenland, the Antarctic or
offshore areas. Figures not available for OECD Pacific Region
(Australia, New Zealand and Japan) or the Middle east.
Figure 18 : The World’s wind resources. World total = 53,000 TWh
OECD Europe
OECD North America
OECD Pacific
Latin America
East Asia
South Asia
China
Middle East
Transition economies
Africa
World
Average annual
growth in
electricity
demand
1997 2020
1.9 %
1.3 %
1.5 %
3.8 %
4.5 %
5.1 %
5.1 %
4.0 %
2.6 %
3.4 %
2.7 %
Electricity
demand
by 2020
(TWh/
year)
4515
5729
1745
2041
2081
1695
3691
907
2615
864
25,883
20% of
2020
demand
(TWh/
year)
903
1146
349
408
416
339
738
181
523
173
5177
Land : 630
Offshore
313
14,000
3600
5400
4600
N/A
10,600
10,600
49743
1.04
12.2
10.3
13.2
3.1
20.3
61.3
9.6
Table 3.9 : Available wind resources and future electricity demand
Region of the
World
Wind
resource
(TWh/
year
Factor
of the
resource
exceeding
- 41 -
Many countries have been over the last few decades, taking keen
interest in the generation of wind power particularly remote areas, which
cannot be supplied from the main electrical networks at reasonable costs.
For this purpose, wind-surveys in various countries have been undertaken
e.g. in France, Germany, Great Britain, Ireland, Spain, Denmark, Somaliland,
China, Egypt, Israel, India, Australia, U.S.A., Canada, Canary Isles, Tabago,
Uruguay and formar U.S.S.R. A wind speed of at least 6 to 10 miles per
hour is considered to be suitable
15
. Anemometers have been used to define
areas considered favourable from the point of view of wind-speed and
which lack power-supplies.
If the wind energy produced, is in the form of electricity, if can be fed
into the local or sub-grid network directly. Wind energy is now a growing
energy-source, providing sustainable and pollution-free renewable energy.
14 Million houses around the world are connected with windpower
(facilitating about 35 million people). There are about 55,000 wind-mills
installed and 70,000 people are employed in this industry globally. It is an
industry worth US$ 5 billion and is growing at a rate of 40% per year.
Wind-energy can supply 12% of the word’s electricity. The wind-resources
are shown in figure 17 and available world-wind resources and future
electricity demand. The total installed capacity around the world in 2001
was 24,900 MW. The growth between 2002 & 2007 is estimated to be 25%
per annum, thus going up to 120,600 MW by the end of 2007. By 2020, an
installed capacity of 1,260 GW could well be achieved.
Most common power-plants in the world are thermal, large scale
Hydro power-plants, or nuclear-reactors developed in the middle of this
century. It took 40-50 years for these to become the main technologies.
Similarly wind-energy is capable of becoming the mainstream source of
electricity. The cost per unit (kWh) of wind-electricity has already came
down from 16.9 cents/kWh to 6.15 cents/kwh during the period 1981-1995.
With the introduction of 500 kW turbines, the cost has been further reduced
and with 2.5 MW, the cost will further be reduced to 3.61 cents/kWh and
15. “Wind Froce 12-A Blueprint to achieve 12% of the World’s electricity from wind
power by 2020”, Europen Wind Energy Associaiton and Greenpeace, May 2002,
REW/July-August 2002. p. 76.
- 42 -
investment cost to $765/kW (less than thermal power-plant). Moreover it
is expected that the cost will further decrease to 2.62 cent/kWh by 2010.
(investment = US$555/kW). By 2020, it may be 2.11 cents/unit and
investment cost to be reduced to 447 per kW. This is most viable and
promising renewable energy for developing countries in accordance with
its wind resources.
(E) Geothermal energy
It is well know that as we travel towards
the center of the earth, the temperature rises
due to the geology of the gases of earth and
this effect is known for sunshield. Human
beings are using Geothermal resources for
over 10,000 years. In the past which includes
Romans, Japanese, Turkish, Icelanders,
Central European and the Maori of New
Zealand made most use of it.
The hot springs were used for heating
and space heating in the era of Roman
Empire. Chinese Kingdoms, Turk’s and
Ottomans were some of the early users of
Figure 19 : Schematic design of an ideal geothermal system. Not
to scale
The 46 MW Sonoma geothermal
power plant, California, which began
commercial operation in 1983. Photo :
Calpine
Figure 20
- 43 -
various healthcare treatments. This custom has been extended to geothermal
spas in Japan, Germany, Iceland, America and New Zealand. In 1977 Boric
Acid was discovered in the hot pools and these minerals were being used in
1810; nine factories were built in 1816 to 1835. A flourishing Chemical
industry at Chaudes-Aigues in France, the world’s first geothermal heating
system was established in 14th century and it is still working. The first
plant of Geothermal Electricity was installed in Italy between 1900 and 1902.
The plant was 250 kW and commissioned in 1993, which was followed
by New Zealand, Mexico and US in 1960. Now, the world’s geothermal
power-generating capacity has increased from 800 (in 1999) Megawatt to
1423 Megawatt, and is expected to reach over 11,000 Megawatt by 2050.
Geothermal energy within the earth is the energy produced through
geological phenomena, such as earthquakes and volcanoes, and human
being would be using only a fraction of it.
The Geothermal energy is the heating source which may be available
at a relatively less depth of earth 5-10 Km, where we can get a high
geothermal grid and high geothermal energy in producing system.
Geothermal Energy is a clean renewable energy, sustainable and
independent of both time and weather; and operatable 24 hours a day. In
1998, percentage of Geothermal Energy was 42% of the total electric power
installed and 70% of total electricity generated by other renewable energy.
It can be converted directly into electric energy or it can be used as a
heating source. The electricity can be produced through conventional
system out-points. The capacity of such plants varies from 2.5 – 5 Megawatt
using steam, (at least 150OC) . The larger plants of 55-60 Megawatt
capacity are also very common, where electricity can be generated from
low to medium temperature (steam) of the Geothermal Energy.
In year 2000, the total capacity of Geothermal plants, all over the
world, has increased to 1,141 Megawatt since 1915. It is expected that by
the year 2050, this will rise to 11,414 Megawatt). There are about 20
countries, which produced Geothermal electricity in 1995, including
- 44 -
countries from the developing world, viz China, Ethiopia, El Selvadore,
Guetemala, Indonesia, Kenya, Philippines, Pourtagal. Now, 58 countries
are utilizing geothermal energy in direct application, with a total capacity
of 15,000 Megawatt. The distribution is as under
16
1. 42% for Geothermal heat pumps
2. 31% for Space heating
3. 11% for Bathing
4. 9% for Greenhouses
5. 3% for Industrial
6. 1% for Agricultural
Worldwide Resources of Geothermal potential
The growth-rate for installed electric capacity from 1940 to 1960
was 5.6% annually, and dropped due to the world war, then back during
1960-1970 period to 5.8% per annum and then increased in 1970-80 to
12%, but in 1980-90 dropped to 10.7%. It is very interesting to note that
from 1990 onward, this has declined 2.3% per years, which may be due
to slowdown of world economy. The average growth-rate over 20 years
has been 8.6% per year.
Conclusion
Geothermal energy is one of the oldest forms of renewable energy
with the longest industrial history. Worldwide, geothermal power could
serve the electricity needs of 865 million people or about 17% of the
world’s population. 39 countries have already been identified that could
be powered 100% through geothermal resources, mostly in Africa,
Central and South America and the Pacific – representing 620 million
people (according to UN population data for 1998).
16. Jhon Lund,, “World Status of Geothermal Energy Use Past and Potential”, REW/July -
August, 2000, pages 123-4 & 131.
- 45 -
CHAPTER 4
THE MAJOR OPTIONS FOR VARIOUS
CATEGORIES OF COUNTRIES
1. The Present Situation
It is well known that nearly all renewable energy sources on the earth,
e.g. hydro, biomass, ultimately derive their energy from the sun, which
itself gets energy from the basic fusionreaction that converts Hydrogen
into Helium, with the release of 2 neutrons and a tremendous amount of
energy. The basic differences between the various forms of renewable
energy lie in the fact that (a) the vehicle is readly availabile, e.g. biomass,
wind or water, and (b) the overall cost of obtaining the energy in a usable
form for industry, transportation is relatively low.
In 2001, China was far ahead in Solar Thermal Systems and Biogas
and Small / Micro Hydropower plants while India has excelling in the
region in Wind Power as per the figures of 2001. These figures given in
Table 4.1 reflect the growing importance of renewable-energy sources in
the region
1
, which comprises both developing and developed countries.
During the last two decades, a tremendous amount of work has been
done on the various renewable-energy technologies, so that today many
of them are commercially viable and even available in units of medium to
large size. A summary of the overall picture, as of now, is presented in
the accompanying Table 4.2, taken from World Energy Assessment :
Energy and the Challenges of Sustainability”, in 2000 by UNDP
2
report.
1. Ralph Sims, “Energy for Tomorrow’s World a Renewable Energy Perspective”, Rene-
wable Energy World review issue-2000-2001, p. 24.
2. Wim C. Turkenburg, “Renewable Energy Technologies”, World Energy Assessment :
Energy and Challenge of Sustainability, 2000 UNDP report. p. 226.
- 46 -
3. Govinda Timilsine, Thierry Lefevre and S.K. Noim uddin “New and Renewable
Energy Technologies in Asia”, Renewable Energy World July-August 2001, p. 53.
Bangladesh
China
India
Indonesia
Japan
Korea
Malaysia
Nepal
Pakistan
Philippines
Sri Lanka
Thailand
Vietnam
Solar ther-
mal system
(1000m
2
)
5000
467
- -
57
- -
- -
10
- -
- -
- -
50
- -
0.15
6.00
50
5
3.6
0.48
2
1.08
0.44
0.52
- -
5
0.47
344
1167
0.5
75
- -
0.15
0.02
- -
0.06
3
0.2
0.1
Small/micro
hydropower
plants (mW)
- -
20,000
217
54
- -
5
24
11.46
20
70
6
128
95
Power
plants
(mW)
- -
800
272.74
178
- -
- -
200
- -
- -
- -
- -
1230
- -
Biogas
plants
(1000 units)
1
6800
3000
- -
- -
- -
- -
49.28
4.13
- -
4
10
3.08
Improved cook-
stoves (1000
units)
82
180,000
32,000
- -
- -
- -
- -
250
68
- -
- -
500
- -
Source
3
: Govinda Timilsina, Thierry lefevre and S.K. Noim uddin “New and Renewable Energy Technologies in Asia”, Renewable
Energy World/July-August 2001, p. 53.
The plant size of small/micro hydro plants varies widely across Asian countries, from 5kW in Vietnam to 50 MW in
China; they are classified as ‘small/micro’ because they receive special incentives from the corresponding governments
for their implementation, these also includes waste-fired power plants.
Table - 4.1: Renewable Energy Technologies in Selected Asian Countries as of December 2000.
Country
PV system
(mW
p
)
Wind power
plants (mW)