General ultrasound In the critically ill - part 8 pptx
Bạn đang xem bản rút gọn của tài liệu. Xem và tải ngay bản đầy đủ của tài liệu tại đây (1.75 MB, 20 trang )
Acute Medlastinitis 135
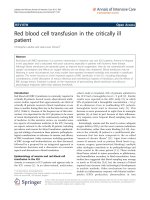
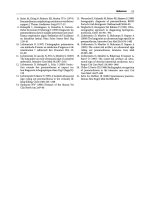
Fig.
19.3.
Rare observation of the aortic arch in a young
woman with a favorable morphotype, suprasternal
approach. The origin of the supra-aortic trunks (ar-
rows)
and the right pulmonary artery
(PA)
in transverse
section are exposed in detail
Fig.
19.5.
Terminal aorta, sequel of Figs. 19.4 and 4.1.
Arrows,
origin of the iliac arteries. This type of image
can replace more invasive modalities such as CT or
angiography in emergency situations
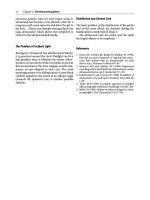
Fig.
19.4.
The descending thoracic aorta is exposed over
12
cm in this scan that exploits the cardiac window (api-
cal scan of the heart)
Fig.
19.6.
Thoracic aorta aneurysm. Suprasternal scan in
a patient in shock with thoracic pain. Note the substan-
tial thrombosis, with regular layers.
A,
circulating lumen
of the aorta
back to the periphery a few millimeters in each
systole.
In the case of thoracic aortic dissection
(Fig. 19.7), an enlarged lumen of the aorta can be
observed, and in some cases the intimal flap. This
flap has an anatomical shape, i.e., never complete-
ly regular, and in our opinion is easily distin-
guished from the numerous artifacts that are
always too regular and generally located in a strict-
ly parallel or meridian plane. However, the search
can be difficult, depending on the morphotype, the
situation of the flap with respect to the probe axis,
and probably also the operator's experience here.
The supra-aortic vessels can be followed to var-
ious lengths, but the application seems rare, at least
in medical ICU use (see Chap. 21).
Acute Medlastinitis
Studying the mediastinal content after cardiac
surgery can be delicate. However, the smallest ster-
136 Chapter
19
Mediastinum
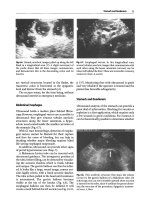
Fig.
197.
An 80-year-old female with violent chest pain.
Suprasternal scan demonstrating an enlarged aortic
lumen with an internal image that is irregular, nonarti-
factual, and mobile indicating intimal flap (arrow).
Dissection of the thoracic aorta
Fig.
19.8.
Substantial collection
(M)
visible
by the
trans-
sternal
route,
in
a
recently operated patient.
The
collec-
tion is echoic and tissue-like. The tap withdrew frank
pus.
Note
the heart
(LV)
located more deeply
nal disunity can offer a large route for the ultra-
sound
beam.
Acute
mediastinitis can then be diag-
nosed. In a patient who had sepsis 1 month after
aortic dissection cure, the transsternal route
showed a large, echoic mass of the retrosternal
space (Fig.
19.8).
An ultrasound-guided puncture
of this mass immediately withdrew frank pus.
Staphylococcus was isolated in a few minutes by
the laboratory, and adapted antibiotic therapy was
begun before prompt surgery.
Acute mediastinitis can often be diagnosed by
the anterior parasternal route, if the collection is
anterior and voluminous, and extends beyond the
sternum.
In mediastinitis with the thorax opened, we
have not yet seen an advantage to in situ ultra-
sound analysis. If indicated, the probe can be
inserted in a sterile sheath.
It is assumed that the possibility of early diag-
nosis of acute mediastinitis by transesophageal
echography
is
promising.
Esophageal rupture is an emergency whose
infrequency
makes
it all the more
severe,
since this
diagnosis is rarely evoked immediately. Our obser-
vations show that a routine ultrasound examina-
tion of any thoracic drama will promptly recognize
these disorders: partial pneumothorax, pleural
effusion (with alimentary particles yielding
a
com-
plex echostructure), and frank pus withdrawn
from the ultrasound-guided thoracentesis.
In the critically ill patient, the gastric tube and
above all its frank acoustic shadow make a good
Thoracic Esophagus
Thoracic esophagus cannot
be
explored by
a
retro-
tracheal approach. It can be approached below the
carina as a tubular flattened structure that passes
in the dihedral angle between the heart and
descending aorta (Fig. 19.9). Its analysis is uncer-
tain but should always be tried.
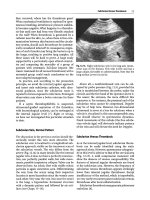
Fig. 19.9.
Location of the thoracic esophagus (0) in a
transverse, pseudo-apical scan of the heart. The eso-
phagus is surrounded by the rachis (i?), the right
auricle
(RA),
the left ventricle
(LV)
and the descending
aorta
(A)
Other Mediastinal Structures 137
Fig,
19.10.
Inflated esophageal balloon of a Blakemore
probe
(asterisk)y
driving the posterior aspect of
the
left
auricle
(LA)
away
Fig.
19.12.
False aneurysm of the left internal mammary
artery.
Transverse scan of
a
parasternal intercostal spa-
ce.
Egg-shaped mass with vertical long axis. In real-
time,
an echoic whirling flow indicated the arterial na-
ture of this
mass.
H,
heart
view (Fig. 19.11). Detection of a frank blood clot
using this route is
rare,
but can provide immediate
diagnosis of severe pulmonary embolism.
Fig.
19.11.
Another transverse scan of the right pulmo-
nary artery
(PA)y
surrounded by the aortic arch (A),
Suprasternal scan.
A
pulmonary embolism could thus
be
proven in extreme emergency
Internal Mammary Artery
The internal mammary artery crosses just outside
the sternal border. Locating it can be useful before
certain punctures.
An internal mammary artery false aneurysm
once had this very suggestive pattern: an egg-
shaped, vertical, long-axis
mass.
Ultrasound analy-
sis of its content showed a blatant whirling flow
(Fig. 19.12). The vascular origin of this mass was
proven, once again without Doppler. It goes with-
out saying that this pattern seriously contraindi-
cates diagnostic puncture.
landmark that facilitates the location of the esoph-
agus.
The esophageal balloon of a Blakemore tube
can be visualized posterior to the left auricle
(Fig. 19.10). Ultrasound help in this situation is
discussed in
Chap.
6.
Pulmonary Artery
In patients with
a
favorable morphotype, the aortic
arch can be exposed by suprasternal route. In the
concavity of the aorta, a transverse scan can more
or less easily bring the right pulmonary artery into
Other Mediastinal Structures
The recognition of the following elements, even if
they are responsible for disorders such as tracheal
compression, rarely leads to therapeutic decisions
in the emergency
room.
Diving
goiter,
adenomegaly
or mediastinal tumors can be quietly diagnosed
when not compressive (see
Fig.
12.8,
p
73).
An ante-
rior mediastinal mass in a clinical context of
myas-
thenia gravis will be suggestive of thymoma. A
pneumomediastinum yields, in our observations,
a
complete acoustic barrier, of value if (1) the heart
was previously located in this area and (2) lung
138 Chapter
19
Mediastinum
sliding is recognized outside this
area,
which rules References
out pneumothorax.
Let us remind the reader here that complete
atelectasis can considerably favor the ultrasound
analysis of the mediastinum by the external
approach (see
Fig.
12.20,p 80,and
Fig.
17.11,p 124).
Matter
D,
Sick
H,
Koritke
JG, Warter
P (1987) A
supra-
sternal approach
to the
mediastinum using real-time
ultrasonography, echoanatomic correlations. Eur J
Radiol
7:11-17
CHAPTER
20
General Ultrasound of the Heart
We could have placed the heart first, because of its
strategic importance, or last (another mark of
recognition).
As
the heart can be considered
a
vital
ultrasound-accessible organ like others, a logical
place was here.
Obviously, reference textbooks treat this subject
exhaustively
[1,
2]. The notions which follow are
intentionally simplified to the maximum in a dou-
ble aim: to remain faithful to the title of the book
(hence the title of this chapter) and, as a conse-
quence,
be
able to show to a non-cardiologist some
of the characteristic features seen in the emergency
situation: left heart hypokinesis, right heart dilata-
tion, pericardial tamponade, hypovolemic shock,
etc.
The physician who is not a cardiologist exam-
ines the heart, then requests confirmation from a
specialist - unless time does not allow. Because
time is always a critical
issue,
an intensivist trained
in emergency ultrasound should clearly
be
trained
in applying the probe on the heart.
The reader is therefore invited to acquire the
basic knowledge necessary. This chapter could
have been written by a cardiologist. Yet echocar-
diography is usually done using sophisticated
material and highly trained personnel, with com-
plex thought
processes.
Simple material and a sim-
ple technique can yield useful information. Having
accrued experience in a pioneering institution in
echocardiography since 1989, the authors have
come to the tentative conclusion, open to consider-
ation, that simple therapeutic procedures can be
deduced from the observation of simple phenom-
ena. For instance. Chap. 28 shows that, in the pre-
cise setting of searching for the origin of acute
dyspnea, extremely limited investigation of the
heart can be sufficient: in particular, the right ven-
tricle status can be deduced from lung analysis.
Deliberating on echocardiography without men-
tioning the Doppler in 2004 may appear overly
bold and thus requires explanation. The drawbacks
of Doppler equipment were detailed in
Chap.
2.
All
ICUs are not equipped with transesophageal
Doppler echocardiography - far from it - most are
even not equipped with simple units. Some new
techniques such as the PICCO aim to replace
echocardiography. Yet a simple, two-dimensional
heart examination will give vital information in
the emergency setting.
Let us recall a basic point: acquiring an ultra-
sound dedicated to the transesophageal route
blocks the way to general ultrasound and con-
demns the user to visualizing only the heart. The
reader will therefore not take offense if trans-
esophageal ultrasonography is not discussed in
this chapter. Here again, reference textbooks exist
on this semi-invasive technique. Even minimal
but basic information can always or nearly always
be extracted from a surface ultrasound examina-
tion [3].
One advantage of Doppler
is
monitoring cardiac
output using an endoesophageal system [4]. The
question of whether these parameters are manda-
tory in emergency care is a source of controversy
[5].
Rather than sustaining these controversies, we
suggest one basic point: two-dimensional ultra-
sound cannot give parameters obtained by inva-
sive or semi-invasive techniques. However, it inte-
grates data that are not only cardiac, but also
venous, abdominal (inferior vena cava) and above
all pulmonary (status of the artifacts). The level of
investigation will be altered in such a way that the
amount of information lost in hemodynamic
terms is regained in terms of
diagnosis.
For exam-
ple,
fine analysis of the Doppler signal of the pul-
monary veins in a critically ill patient can be less
useful if one has made the diagnosis of tension
pneumothorax, for instance, or massive pul-
monary embolism. In other words, our logic is to
favor the urgent needs first.
Finally, it must be noted that the hemodynamic
investigation, either invasive (Swan-Ganz) or semi-
invasive (transesophageal echocardiography) leads
to three simple alternatives: whether to give fluid
therapy, inotropic agents, or vasopressors. It is of
140 Chapter 20 General Ultrasound of
the
Heart
great interest to note that surface examination,
including the heart but also the lungs and veins,
can be compared with these complex approaches
when only the medical prescription changes are
taken into account. In terms of therapeutic
impact, our daily experience is edifying (study in
progress).
Heart Routes
The parasternal route lies in the left parasternal
area. The apical route corresponds to systolic
shock. Positioning the patient in the left lateral
decubitus, the reference in cardiology, is not always
easy in a critically ill patient
(Fig.
20.1).
Mechanical ventilation often creates
a
barrier to
the transthoracic approach of the heart. Fortu-
nately, the subcostal route is a frequent answer to
the poor-quality images resulting from the tho-
racic routes. This route is widely employed in the
intensive care unit in sedated supine patients. This
is an abdominal approach, with the probe applied
just to the xiphoid, the body of the probe applied
almost against the abdomen.
It is rare that cardiac function cannot be
assessed in the emergency situation. Several tech-
niques can
be
used.
In the parasternal approach, for
instance, care should be taken to wait for the end-
expiratory
phase.
It is often possible to obtain, even
if only for a fraction of a second, a dynamic image
of the heart that suffices for a rough evaluation of
the left heart status. If needed, one can lower the
respiratory rate for a short time in order to prolong
this instant. The quality of the subcostal route is
improved if the hepatic parenchyma is used as an
acoustic window. Therefore, in some instances the
probe should be moved far from the thorax.
A
right
intercostal approach through the liver can analyze
the auricles, or even more. This route (not yet
described to our knowledge) should be tried when
no other route
is
possible.
The
stomach can
be
filled
with fluid in order to create an acoustic window
making the subcostal approach easier. A right
parasternal approach will be contributive if the
right chambers are dilated and extend to the right.
All these techniques, when they provide an
answer to the clinical question, should theoretical-
ly decrease the need for the transesophageal tech-
nique. Above
all,
they respond to
a
precise philoso-
phy: simplicity. If this approach has answered the
question, one can consider that simplicity was the
winning choice.
Fig.
20.1.
The three classic routes of the heart. A The
parasternal route. B The apical route.
C
The subcostal
route,
a basic
approach to the ventilated patient
Notions of Ultrasound Anatomy of the Heart
The heart is a complex mass, which one can
schematize from the left ventricle. The left ventri-
cle is like an egg-shaped mass with a long axis
pointing leftward, downward and forward. It has a
base (where the aorta and left auricle are located),
an apex, and four walls: inferior, lateral, anterior,
and the right wall, which is called the septal wall.
This wall is made by the septum. The right ventri-
cle has more complex anatomy. Its apex covers the
septum, its base (infundibulum) covers the initial
aorta. It has a septal wall and a free
wall.
Intracavi-
tary structures are the valves and the left ventri-
cular pillars. The auricles are visible behind the
ventricles.
The
cardiac muscle
is
echoic.
The
cham-
bers are anechoic (except for situations of cardiac
arrest).
An excellent way to learn heart anatomy is to
use ultrasound, since it reduces a rather complex
three-dimensional structure to more simple two-
dimensional structures.
Normal Ultrasound Anatomy of the Heart
• The parasternal route, long-axis view, studies
the left ventricle (except the apex), the left au-
ricle,
the initial aorta, the right ventricular
infundibulum, and the dynamics of the mitral
and aortic valves
(Fig.
20.2).
Normal Ultrasound Anatomy of the Heart 141
Fig.
20.2.
Long-axis view of the heart, left parasternal
route.
A
concession to cardiology was made, since this
figure is oriented with the patient's head at the right of
the image. LA, left auricle;
LV,
left ventricle;
JR^,
right
ventricle;
A,
initial aorta
Fig.
20.4.
Small-axis parasternal view of the base. RA,
right auricle;
RV,
right ventricle, prolonging by the pul-
monary artery
(PA),
which surrounds the initial aorta
(A).
Right (**) and left (*) branches of the pulmonary
artery
Fig.
20.3.
Small-axis biventricular parasternal view. The
left ventricle
(LV)
section is round. The two prominent
structures are the pillars of the mitral valve. The right
ventricle (RV) surrounds the septal aspect of the left
ventricle
The parasternal route, short-axis view, studies
the two ventricles and the septum at the bottom
(Fig. 20.3). Higher up, it shows a view where the
right auricle, the tricuspid valve, the basal por-
tion of the right ventricle, the pulmonary artery
and its two division branches, which surround
the initial aorta, are visible (Fig. 20.4).
The apical route, four-chamber view, provides
an overview of the four chambers. This view
gives the most information, and shows the heart
in its true symmetry axis: ventricles anterior
and auricles posterior, left chambers to the
right, right chambers to the left (Fig. 20.5). The
Fig.
20.5.
Four-chamber view, apical window. Here, the
heart seems to be a symmetric structure.
LV,
left ven-
tricle, LA, left auricle, RV, right ventricle; RA, right
auricle.
This incidence allows immediate comparison of
the volume and dynamics of each chamber. Note that
the plane of the tricuspid
valve
is more anterior than the
plane of the mitral valve. In other words, right auricle
and left ventricle are in contact
(arrow),
a detail which
allows correct recognition of each chamber
142 Chapter 20 General Ultrasound of
the
Heart
Fig. 20.6.
Subcostal view of the heart. This approach is a
classic in the intensive care unit. It is a truncated equiva-
lent of the four-chamber
apical
view in
Fig. 20.5.
RV, right
ventricle; RAy right auricle; LV, left ventricle;
LAy
left
auricle.
This fixed image is insufficient and the operator
must scan this area by pivoting the probe from top to
bottom to acquire a correct three-dimensional represen-
tation of the
volumes.
The pericardium is virtual here
Fig. 20.7.
Time-motion recording of the mitral valve. A
kind of
»M«
is displayed inside the left ventricle. Long-
axis parasternal view
lateral and septal walls and the apex of the left
ventricle are visible.
• The apical route, two-chamber view, is obtained
by rotating the probe 90° on its long axis, and
allows analysis of the anterior and inferior walls
of the left ventricle.
• The subcostal route gives a truncated view of
the heart. It thus cannot help for precise mea-
surements. However, this route is easily accessi-
ble in a critically ill patient and thus is of major
interest (Fig. 20.6). An overview of the pericar-
dial status, chamber volume and myocardial
performance is available.
All the routes allow analysis of the pericardium,
normally virtual or quasi-virtual.
Normal Measurements
Static Measurements
Only rough estimates will be given. In a short axis
at the pillar level, the left ventricular walls (septal
or posterior) are 6-11 mm thick in diastole. The
left ventricle chamber caliper is 38-56 mm. The
right ventricle free wall is less than 5 mm thick, but
a precise measurement should include subtle crite-
ria, since the shape of the right ventricle is com-
plex. In an apical four-chamber
view,
the right ven-
tricle size is less than that of the left ventricle.
Fig.
20.8.
When the left ventricle is bisected by the time-
motion line (see
Fig.
20.3),
its
contractility can be objec-
tified on paper. The narrower the sinusoid wave, the
more the contractility is decreased. If precise data are
preferred to a visual impression, a very rigorous techni-
que is required, using a perfectly perpendicular axis,
thus avoiding distortions due to tangency, and a mea-
sure between pillars and coaptation of the mitral valve,
a reproducible area. The
arrows
indicate diastolic then
systoHc diameter of the left
ventricle.
The
contractility
is
normal here, not exaggerated (shortening fraction,
28%).
Muscle thickness variations may also be measu-
red on this figure
Dynamic Measurements
Real-time analysis allows appreciation of the ven-
tricular contractility and, more secondarily for us,
wall thickening and valve movements (Fig.
20.7).
A
time-motion image through the ventricular small
axis can measure (Fig. 20.8):
• The left ventricular chamber caliper in diastole,
which indicates whether there is dilatation.
• This caliper in systole, which defines contractil-
ity. The difference of these two values, divided
Left Ventricular Failure 143
Fig.
20.9.
Left ventricle hypocontractility. The sinusoid
wave is
near the horizontal
line
in this patient with car-
diac failure because of dilated cardiomyopathy (diasto-
lic
diameter,
({1
mm)
Fig.
20.10.
Dilated cardiomyopathy, with massive enlar-
gement of
the
four chambers
by the diastolic caliper, defines the left ventricle
shortening fraction, a basic parameter of the
ventricular systolic function. It is normally
28-38%.
This information does not replace the
ejection fraction, but it is easy to obtain in the
emergency situation.
• The parietal thickening fraction (the ratio of the
difference of diastolic and systolic thickening
over diastolic thickening, normal range from
50%
to 100%) is less useful in our daily (and
above all nighttime) routine.
The changes in these parameters is assessed with
treatment.
Left Ventricular Failure
when systolic function is impaired, global con-
tractility is decreased, with low shortening frac-
tion (Fig. 20.9). This profile can be seen in left
ventricular failure of ischemic origin, dilated car-
diomyopathies
(Fig.
20.10),
septic shock with heart
failure, and drug poisoning from carbamates with
heart injury.
The impairment of the diastolic function of the
left ventricle
is
more delicate to detect if Doppler is
not
used. However,
in
a certain percentage of
cases,
diastolic dysfunction is due to myocardial hyper-
trophy. This profile, which is accessible to simple
two-dimensional ultrasound, can provide a strong
argument for this etiology
(Fig.
20.11).
It should be stated here that in a patient sus-
pected of pulmonary edema, the usual procedure
Fig.
20.11.
Left ventricle hypertrophy with parietal
thickness at
20
mm.
A
sort of parietal
shock was
percei-
ved in this patient (not reproduced
here
since there
was
no time-motion acquisition). It was synchronized with
the auricle systole and probably indicated a sudden
increase in pressure in a chamber whose volume could
not
increase.
Long-axis parasternal view
is to search for cardiac failure. However, an initial
step would sometimes avoid faulty shuntings: first
checking for pulmonary edema by searching for
lung rockets (see Chap. 17). An absence of lung
rockets means no pulmonary
edema.
Lung rockets
give qualitative information on capillary wedge
pressure and may also be useful in measuring lung
water(Chap. 17,pl22).
144 Chapter 20 General Ultrasound of
the
Heart
Fig.
20.12.
Massive dilatation of the right ventricle in a
four-chamber view using the apical
route.
Massive pul-
monary embolism
Fig.
20,13.
Peculiar pattern evoking a royal python's
head.
It is in fact
a
parasternal long-axis view of
a
mas-
sively
dilated right ventricle.
Young
patient with
ARDS
Right Heart Failure
In normal conditions, the right ventricle works
under a low-pressure system. Any hindrance to
right ventricular ejection will quickly generate
dilatation
[1].
Acute right heart failure associates
early right ventricular dilatation,
a
displacement of
the septum to the left, and a tricuspid regurgita-
tion. This regurgitation can, if needed, be objecti-
fied without Doppler, in patients with a sponta-
neously echoic flow: analysis of the inferior vena
cava will show this particular dynamics. The free
wall of the right ventricle is not thickened in case
of
a
recent obstacle.
This ultrasound pattern can be seen in severe
asthma, adult respiratory distress syndrome,
extensive pneumonia, and in pulmonary embolism
with hemodynamic disorders
(Figs.
20.12,20.13).
If the right heart is not accessible to transtho-
racic ultrasound, note that numerous diagnoses of
acute dyspnea can nonetheless be made (see
Chaps. 18 and 28).
Chronic pulmonary diseases generate adapta-
tion of the right heart muscle, and COPD patients
with acute exacerbation will also have thickened
free
wall.
The dilatation is often major
(Fig.
20.14).
Pulmonary Embolism
The characteristic ultrasound features are described
in Chaps. 17, 18 and 28. In our approach, for the
diagnosis of pulmonary embolism alone, heart
analysis has a small place. Analysis of the lung sur-
Flg.
20.14. Major right ventricle dilatation with flat-
tening of the left ventricle. Note the substantial thick-
ening of the free wall of the right ventricle. Short-axis
parasternal view
face and the venous system (inferior as well as
superior) contribute major information. Note that
the echocardiographic findings of pulmonary
embolism are nonspecific, as they are common to
a number of causes of acute right ventricular
pressure overload such as the ARDS or status
asthmaticus [6]. The lung pattern, if normal in a
dyspneic patient, is predictive of right heart fail-
ure.
The combination of a normal lung pattern
with venous thrombosis in a dyspneic patient is
highly characteristic, and precious time can be
saved. Our experience shows that most patients
can be treated in the emergency room before inva-
sive steps are taken. During a transthoracic exam-
ination, observation of a blood clot in the right
Pericardial Tamponade 145
pulmonary artery may appear anecdotal, but when
present, the diagnosis of pulmonary embolism
should be considered definite (see Fig. 19.11).
The diagnosis of pulmonary embolism in a
patient with
ARDS
may be a challenge - if venous
thrombosis is no longer visible
[6].
Here,
the
trans-
esophageal approach should be accorded its prop-
er
place.
Ultrasound proof of embolism is the visu-
alization of an embolus in a main pulmonary
artery
[7].
The endovascular ultrasound approach
was proposed long ago and may also provide a
bedside diagnosis [8].
Acute Pericarditis
This diagnosis is
a
basic illustration of
the
concept
of general ultrasound of the heart, a diagnosis
which should be within every intensivist's reach.
The two layers of the pericardium are separated by
a more or less anechoic collection.
A
sort of sinu-
soid is visible, i.e., the thickness of the effusion
varies during the heart cycle. A pericardial effu-
sion is first detected posterior to the left ventricle,
then anterior to the right ventricle, then becomes
circumferential.
Hemopericardium can be more or less echoic.
Purulent pericarditis can contain visible septations
(Fig.
20.15).
Fig.
20.15.
Fluid collection in the pericardial space (E).
The septations indicate an infectious cause. Note that
the effusion surrounds the entire heart: it is visible
posterior
to the
left
ventricle in
this subcostal approach.
Pleuropericarditis due to pneumococcus
Pericardial Tamponade
When pericardial effusion is detected in an unsta-
ble patient, the possibility of tamponade must be
raised.
A pericardial tamponade is always abundant
and circumferential (Fig. 20.16) except in some
postoperative cases, where small effusions can
have consequences.
Within a distended pericardial sac, the heart
appears to be swimming.
The description of minute signs using Doppler
data will have two effects. One effect will be bene-
ficial: the tamponade feature will be highlighted.
One effect will be deleterious: time will be lost in
searching for a specialist or opportunities will be
lost if the logistics (trained operator, sophisticated
unit) are not present on site. As always in emer-
gency situations, the place for academic approach-
es is limited. The opportunity to insert a needle,
monitored by ultrasound, in an unstable patient
with abundant pericardial effusion will be less
Fig.
20.16.
Pericardial
tamponade.
The
heart
is
surroun-
ded by an
abundant fluid collection (*).
A
swinging pat-
tern was visible in real-time. The right chambers are
collapsed, with collapse of the right ventricle free wall
(arrow).
This
subcostal figure also
shows
the route for
a
life-saving tap
often missed than any loss of time or intellectual
attitude. In other words, in such patients, there is
httle place for other diagnoses.
Time permitting, simple devices make it possible
to observe signs in rhythm with cardiac and respira-
tory
cycles
in the spontaneously breathing patient:
• Inspiration facilitates venous return, and the
right ventricle dilates at the expense of the sep-
tum, which is more compliant than the free wall.
The septum is shifted to the left and compresses
146 Chapter
20
General Ultrasound
of
the
Heart
the left ventricular chamber (hence the pulsus
paradoxus).
• Diastole creates a decrease in intracavitary pres-
sures,
whereas intrapericardial pressure remains
constant. The right chambers are thus collapsed
by the surrounding pressure. The right auricle
wall collapses first, an early sign. Then, the free
wall of the right ventricle is
involved.
In extreme
cases,
right chambers can
be
undetectable.
Right-
chamber collapse is amplified by hypovolemia.
Pericardial Drainage
When the clinical situation is critical, ultrasound
allows an immediate and safe pericardial tap. A
minor fluid withdrawal can dramatically improve
the circulatory status.
In such situations, the type of material does not
matter. If there is evidence of viscous fluid, a large
caliper of needle will be preferred. One can use a
90-mm-long lumbar tap needle or material devot-
ed to thoracentesis such as the Pleurocath, a thin
chest tube Such materials should at best remain
permanently on the trolley, in a dedicated place.
The pericardium
is
best approached via the sub-
costal route with ultrasound guidance. The probe
is applied next to the needle, which should be
inserted in the plane of the
probe.
An
aseptic tech-
nique depends on the clinical situation
(i.e.,
mini-
mal in case of cardiac arrest). As for any ultra-
sound-guided procedure, the progression of the
needle can be followed through the liver parenchy-
ma (Fig. 20.17). When the tip of the needle is
located in the fluid collection, a second operator
aspirates the syringe, whereas the first operator
firmly maintains the needle under permanent con-
trol on the
screen,
since
the heart
is
not
far.
If blood
is
withdrawn, the second operator reinjects it with-
out disconnecting the syringe. If this blood origi-
nated from the pericardial sac, this maneuver
creates visible echoic turbulence within the collec-
tion. This turbulence cannot be seen if the blood
comes from a heart chamber, a situation which
should not occur if the ultrasound guidance is
effective. Microbubbles (contrast echography) can
also be used, time permitting.
Hypovolemic Shock
Comments on the role of general ultrasound in
assessing blood volume are available in Chap. 28.
When all ultrasound data
agree,
the typical profile
Fig.
20.17.
Ultrasound-guided pericardial tap via the
subcostal approach. The needle is totally visualized
within the hepatic parenchyma when penetrating the
pericardial
cavity.
Purulent pericarditis
due to
pneumo-
coccus
Fig.
20.18.
Hypercontractile pattern of the left ventricle
during hypovolemic
shock.
Time-motion acquisition in
a short-axis parasternal
view.
Small diastolic chamber.
Quasi-virtual systolic
chamber.
Tachycardia
includes hypercontractile left ventricle, with small
or sometimes virtual end-systolic chamber volume
(Fig.
20.18),
flattened inferior vena
cava,
and
a
lung
surface free of any lung rockets, especially in the
dependent areas.
Gas Tamponade
With the ultrasound device immediately available,
in a critical situation it is possible to immediately
detect collapsed chambers, without pericardial
effusion. The subcostal approach is usually the
only contributive approach. This pattern will
Gas Embolism
147
Fig.
20.19.
Voluminous thrombosis (M) at the left ven-
tricle apex. Subcostal view
Fig.
20.20.
Partial visualization of a Swan-Ganz catheter
in the right ventricle. The balloon inflation and the
route of the catheter toward the pulmonary artery can
be followed on the screen
contrast with enlarged jugular veins found clini-
cally or with ultrasound. Searching for bilateral,
compressive pneumothorax completes this explo-
ration.
Intracavitary Devices
Intracardiac thromboses can be identified
(Fig. 20.19). They give a regular echoic pattern,
sometimes mobile.
A
foreign body such as the dis-
tal end of a catheter should be searched for in
the right chambers. These applications are highly
dependent on the quality of the available windows.
More interesting is the ability to check, in real-
time,
the proper position of a electrosystolic probe
in the right ventricle. If a Swan-Ganz catheter is
judged necessary, its on-target progression within
the pulmonary artery can be verified with appro-
priate incidences (Fig. 20.20). We have proceeded
with two operators. One, sterile, inserts the mater-
ial,
the other guides the distal end of the catheter
using the subcostal approach. Asepsis can be effi-
ciently controlled.
Gas Embolism
The ultrasound diagnosis of gas embolism is pos-
sible at the heart (Fig. 20.21). Gas embolism yields
large, rough hyperechoic echoes, with posterior
shadow, and is highly dynamic. In a supine patient,
these gas bubbles collect at the anterior part of the
right ventricle and travel little by little in the pul-
monary artery - unless the patient is promptly
turned to the left lateral decubitus position. Gas
embolism compUcating the insertion of a venous
central catheter can be predicted when an inspira-
tory venous collapse is identified (see Chap. 12).
Fig.
20.21.
Gas embolism. In this short-axis parasternal
view of the base, real-time visuaHzation allows imme-
diate diagnosis. Hyperechoic images
(arrows)
are iden-
tified at the roof of the right ventricle (RV), highly
mobile, as gas bubbles can be within a dynamic hydrau-
lic circuit. They repeatedly appear and progressively are
drawn toward the pulmonary artery
(PA).
Suboptimal
quality figure, obtained in emergency setting.
RAy
right
auricle;
LA,
left auricle;
A,
aorta
148 Chapter 20 General Ultrasound of the Heart
Fig.
20,22.
Tissue-like mass depending on the tricuspid
valve. A diagnosis of endocarditis in a young drug
addict
was
immediately made using this subcostal ultra-
sound view, quickly confirmed by positive hemocultu-
res (staphylococcus).
M,
vegetation
Fig.
20.23.
Frank akinesia of the septal wall of the left
ventricle. Short-axis parasternal view, time-motion
mode. Note the hypercontractility of the lateral wall,
located opposite the septal
wall.
Anteroseptal myocardi-
al infarction seen at the 3rd h
Endocarditis
Endocarditis can be suspected when an echoic
image, arising at the free part of a valve, can be
detected (Fig. 20.22). Traditionally, the gold stan-
dard is the transesophageal approach. However, in
our experience, the cases we have encountered all
gave signs that were already very suggestive, not to
say specific, before being confirmed by semi-inva-
sive or invasive procedures.
Myocardial Infarction
The ischemic wall is motionless, which contrasts
with the normal or exaggerated dynamics of the
other walls. This pattern is not always characteris-
tic.
The diagnosis of segmental anomalies is often
subtle and certainly requires extensive experience
(Fig. 20.23).
The investment is worthwhile if it is accepted
that ultrasound anomalies are visible very early,
thus altering immediate management [9]. Emer-
gency ultrasound in a patient with suspected
myocardial infarction has the merit of being able
to immediately rule out other diagnoses such as
pericarditis or sometimes aortic dissection, whose
management differs.
(Fig. 20.24). The wide-ranging potentials of a sim-
ple device are detailed in Chap. 28.
Miscellaneous
Many anecdotal situations can be encountered in
the emergency room, but their exhaustive descrip-
tion would overburden this book. To give one
example, in a young woman admitted for severe
shock with massive pulmonary edema, transtho-
racic ultrasound objectified a retroauricular mass
Cardiac Arrest
Using emergency ultrasound to detect cardiac
arrest should become routine in the years to come
Fig. 20.24. In this subcostal view, all chambers have
echoic homogeneous content. This sludge pattern is the
result of cardiac arrest. The chambers will become nor-
mally anechoic after recovery of
a
cardiac activity
References 149
Fig.
20.25.
Subcostal view of a young woman in shock
with white
lungs.
A
mass is visible at the location of the
left auricle
(M).
This is an esophageal abscess that com-
plicated local surgery performed weeks before. The
shock was caused by septic disorders (with positive
hemocultures) as well as by a hindrance to pulmonary
venous return.
We
reassure the reader; the diagnosis was
not immediate but rather perioperative (an emergency
transesophageal ultrasound examination was also per-
formed, and was ineffective as well)
compressing the left auricle (Fig. 20.25). Emer-
gency surgery revealed an esophageal abscess,
which was responsible for both septic shock and
hemodynamic failure due to impairment in pul-
monary venous return.
Valvular diseases, problems with mechanical
valves, certain mechanical complications of myo-
cardial infarct, hypertrophic asymmetric cardio-
myopathies cannot be described here. Numerous
subtleties depending on Doppler would also be
beyond the scope of this book. Specialized tech-
niques such as transesophageal Doppler echocar-
diography, used by specialists, will provide the best
logistical conditions [10].
In Conclusion
Let us recall that the device described in Chap. 2
is appropriate for two-dimensional cardiac imag-
ing.
Moreover, the approach described here is sim-
plified. General ultrasound of the heart does not
provide the same information as transesophageal
echocardiography, but it does not answer the same
questions, and is performed for different purposes.
Finally, integrating this simplified cardiac approach
into a whole-body framework, including in partic-
ular the lung and venous status, will provide basic
information. In the emergency situation, this
information allows an investigation at a level close
to,
and in certain cases better than, the traditional
approach, which is based on the heart alone and
can sometimes suffer from inadequacy. Studies in
progress will soon confirm this
belief.
References
1.
Jardin
F,
Dubourg 0 (1986) ^exploration echocar-
diographique en medecine d'urgence.
Masson,
Paris
2.
Braunwald E (1992) Heart disease. Saunders, Phila-
delphia
3.
Vignon
P,
Mentec H, Terre S, Gastinne H, Gueret P,
Lemaire F (1994) Diagnostic accuracy and thera-
peutic impact of transthoracic and transesophageal
echocardiography in mechanically ventilated pa-
tients in the
ICU.
Chest 106:1829-1834
4.
Diebold B (1990) Interet de Fechocardiographie
Doppler en reanimation. Rean Soins Int Med Urg
6:501-507
5.
Jardin F (1997) PEEP, tricuspid regurgitation and
cardiac output. Intensive Care Med 23:806-807
6. Schmidt GA (1998) Pulmonary embolic disorders.
In: Hall
JB,
Schmidt
GA,
Wood
LDH
(eds) Principles
of critical care, 2nd edn. McGraw Hill, New York,
pp 427-449
7.
Goldhaber SZ (2002) Echocardiography in the
management of pulmonary embolism. Ann Intern
Med 136:691-700
8. Tapson
VF,
Davidson
CJ,
Kisslo
KB,
Stack RS (1994)
Rapid visuaHzation of massive pulmonary emboli
utilizing intravascular ultrasound. Chest 105:888-
890
9. Horowitz RS, Morganroth J, Parrotto C, Chen CC,
Soffer J, Pauletto FJ (1982) Immediate diagnosis of
acute myocardial infarction by two-dimensional
echocardiography. Circulation 65:323
10.
Vignon P, Goarin JP (2002) Echocardiographie-
Doppler en reanimation, anesthesie et medecine
d'urgence.
Elsevier,
Amsterdam
CHAPTER
21
Head
and Neck
Here
again,
analysis of a
field
that
is
not yet routine
in emergency ultrasound can perform unexpected
services in the ICU.
Maxillary Sinuses
Maxillary sinusitis is a basic concern in the venti-
lated patient. It is assumed to give infectious pneu-
monia [1] and is subject to diagnostic problems:
radiographs with a vertical beam cannot detect
air-fluid levels, whereas radiographs with a hori-
zontal beam are not yet routine (and remain irra-
diating). The usual solution is, once again, refer-
ring the patient to CT.
If ultrasound can play even a minimal role, this
role should be carefully considered. Available data
in the literature regard studies conducted in
otorhinolaryngological patients with the
A
mode.
We intentionally did not speak of the A mode in
Chap.
1,
since this technique is extremely abstract
if compared with
real-time.
The
opinion
was
divid-
ed on use of the
A
mode between the advocates [2,
3] and those preferring a cautious outlook
[4].
We
have previously written, in error, that conclusion
on this aspect was impossible, until the day when,
applying our probe on the paranasal
areas,
we
were
surprised to see an anatomical view of
a
maxillary
sinus on the screen. This proved that the ultra-
sound beams were able to cross bones. Note that
the scapula or the iliac aisle also do not hinder the
beam.
The probe is transversally applied on the square
area located between the eye, nose and teeth. The
normal image is an absence of signal (Fig. 21.1).
This is an artifactual image that is not a posterior
shadow, as a bone would
generate,
but a repetition
echo,
with dark and clear lines: it is indeed an air
artifact. This simple distinction proves that the
beam is not stopped by the bone. A pathological
signal is the visualization of the sinus
itself,
i.e.,
an anechoic image surrounded by two lateral
Fig.
21.1.
A
Normal maxillary
sinus.
The
ultrasound pat-
tern (top) is made up of repetition artifacts
(arrows)y
which indicate an air barrier. B Total opacity of the
sinus.
On ultrasound
(top),
the shape of the sinus is out-
lined: sinusogram in transverse scan. Note the frank
pattern, with indicates the total opacity as seen on the
CT scan (top)
walls and a posterior wall. This pattern was
labeled the sinusogram, a self-explanatory term
(Fig.
21.1).
Maxillary sinusitis gives a two-step sign. At the
first
level,
there can be a sinusogram, according to
an all-or-nothing rule. At the second level, the
sinusogram is either complete, with frank visual-
ization of the three walls over the entire area of
projection
(Fig.
21.1),
or incomplete
(Fig.
21.2).
One hundred maxillary sinuses of critically
ill patients were analyzed in our institution. For
simple and clinically relevant correlations, it was
necessary to use complex routes, as four pairs of
hypotheses were opposed. The relevance of ultra-
sound is a function of the precision of the words
used.
Maxillary
Sinuses
151
Fig.
21.2A,
B.
Examples of incomplete sinusograms. A
This image corresponds to subtotal opacity
with a
bub-
ble trapped at the
top.
B
This one is caused by substan-
tial mucosal
thickening.
The white arrows
designate the
missing
walls,
not visualized
by the
ultrasound
In a ventilated patient, a sinus can (1) be nor-
mal, (2) have mucosal thickening, (3) have an
air-fluid level, (4) be totally opaque. Only the
air-fluid level and total opacity need specific treat-
ment since there is production of pus, logically
stemming from drainage.
»Pathological sinus« was an ultrasound term
created to designate either hypertrophy on
CT,
the
air-fluid level on CT or total opacity on CT. This
term is opposed to »normal sinus«.
»Radiological maxillary sinusitis« is a CT term
implying fluid accumulation, i.e., the air-fluid level
or total opacity of the sinus. This term contrasts
with normal sinus on CT as well as mucosal thick-
ening on CT.
»Total opacity of the sinus« was a CT term
implying a complete fluid accumulation. This term
contrasts with »normal sinus« and »mucosal thick-
ening«, but also with »sinusitis with the air-fluid
level«,
a distinction necessary for precise data.
A dynamic maneuver means that the head is in
the supine position first, then raised in an upright
position. The specification that no dynamic
maneuver be done meant that that the patients
were studied head supine, as opposed to a dynam-
ic maneuver positioning the head upright.
From these precise definitions, the 100 sinuses
comprised 33 radiological maxillary sinusitis cas-
es (with
21
cases of complete opacity), 14 cases of
mucosal thickening and 52 normal sinuses. All
were studied by
CT.
Ultrasound performance was
as follows [5]:
1.
A
sinusogram diagnoses pathological maxillary
sinus,
dynamic maneuvers not taken into
account, with a 66% sensitivity and a 100%
specificity.
2.
A sinusogram diagnoses radiological maxillary
sinusitis (vs hypertrophy or normal sinus)
with a 67% sensitivity and an S7% specificity,
dynamic maneuvers not taken into account.
3.
A sinusogram diagnoses total opacity of the
sinus,
when compared to
a
partially opacified or
mucosal thickening or normal sinus, with a
100%
sensitivity and an
86%
specificity, dynam-
ic maneuvers not taken into account.
4.
A complete sinusogram (as opposed to an
incomplete or absent sinusogram) diagnoses
total opacity of the sinus (if opposed to partial
opacity, i.e., the air-fluid level, hypertrophy or
normal sinus) with a 100% sensitivity and a
100%
specificity, dynamic maneuvers not taken
into account.
In practice, as shown in Table 21.1, a complete
sinusogram is specific to total opacity. An incom-
plete sinusogram, or one detected in
a
limited area,
can indicate either subtotal opacity, with small
bubbles trapped against the anterior wall, or sub-
stantial mucosal thickening. In a supine patient,
the absence of signal can indicate either a normal
Table
21.1.
Ultrasound diagnosis of maxillary sinusitis
Complete sinusogram
Incomplete sinusogram
No sinusogram
Normal
sinus
0
0
52
Mucosal
thickening
0
8
6
Miscellaneous
(polyp)
0
1
0
Maxillary
sinusitis
(fluid level)
0
2
10
Maxillary
sinusitis
(total opacity)
10
11
0
152 Chapter 21 Head and Neck
3.
Return of the first pattern after positioning the
head supine again.
Lastly, subtleties exist in the signs, such as the
possibility to differentiate tissue-like hypertrophy
from fluid-like sinusitis (Fig. 21.3), a result CT
rarely achieves. On the other hand, ultrasound, as
well as
CT,
will not be able to predict the nature of
the fluid (pus or blood or noninfected fluid).
Ultrasound is being investigated to determine
whether it detects the correct position of
a
sinusal
drain by injecting sterile fluid.
Ultrasound beams cross air (see Chaps. 15-18),
they also happen to cross bones.
Fig.
21.3.
Complete sinusogram. In this case of purulent
sinusitis,
a double
pattern
is
visible:
an internal anecho-
ic area, an external hypoechoic regular frame 4 mm
thick.
This is an
association of
a mucosal
thickening and
a fluid accumulation
Fig.
21.4.
Ophthalmic ultrasound. Multiple echoes as in
weightlessness in aqueous humor, which are mobile
with the eyeball
movements.
Vitreal hemorrhage. Dia-
sonic
Vingmed unit with a 7.5-MHz probe
The Eyeball
The eyeball is accessible through the eyelid, pro-
vided no pressure is exerted on the eye so that any
vagal reaction is avoided. As for any other exami-
nation,
the
probe is firmly held
like a
pen, the oper-
ator's hand lies firmly on the patient's face, and the
probe is gently applied toward the eyelid. The pro-
gression of the probe ceases from the instant an
image is obtained at the screen. Ophthalmological
occult emergencies in comatose patients can
therefore be diagnosed
(Fig.
21.4).
In case of ocular trauma, a critical issue is the
presence of an eye injury. Ultrasound can be con-
tributive,
a
normal state showing an
anechoic,
per-
fectly round organ. In terms of spatial resolution,
ultrasound is clearly superior to
CT,
which irradi-
ates the crystalline lens.
Daily concerns such as the search for ocular
candidosis or other disorders may be solved using
this
technique,
we
await enough cases to conclude.
A retinal hemorrhage would give isoechoic or
hyperechoic images anterior to the retina [6].
sinus or an air-fluid level, which, although sub-
stantial, will not be detected if it does not touch the
anterior wall.
The diagnosis of air-fluid level (study in
progress) requires a dynamic maneuver and gives
these signs:
1.
No signal with head supine.
2.
Detection of a sinusogram in the lower part
of the sinus area after positioning the head
upright.
A
small delay will be needed since the
fluid can be viscous.
Optic Nerve and Intracranial Hypertension
The search for intracranial hypertension should
ideally be routine in a comatose patient, although
it would be inconceivable to perform CT in all
comatose patients. However, a system allowing the
intensivist to avoid unnecessary erroneous orien-
tation in cases of so-called alcoholic comas, or
those that are assumed to be such, would be wel-
come. The principle of using optic fundus exami-
nation was based on the fact that cerebral edema
had a centrifuge extension along the optic nerve to
Optic Nerve and Intracranial Hypertension 153
the papilla, a clinically accessible area. Meanwhile,
CT has replaced this antique examination, which
was not sensitive enough. However, this means,
once again, transportation of a critically ill patient.
Like any macroscopic structure that is not sur-
rounded by air or bone, the optic nerve is accessi-
ble to ultrasound.
Yet
the optic nerve is an evagina-
tion of the brain and is therefore surrounded by
meninges. This space is normally virtual. It is logi-
cal that any increase in intracerebral pressure will
distribute cerebrospinal fluid in all the possible
centrifuge directions, including the optic nerve
meningeal spaces, even a minute amount. The
apparent caliper of the optic nerve will thus be
increased.
The technique is detailed in the previous sec-
tion. The 5-MHz probe can detect, posterior to the
eyeball, a sinuous hypoechoic tubular structure
that is usually well outlined by hyperechoic fat
(Fig. 21.5). Detecting the optic nerve can require
some skill. The curves of the nerve must be recog-
nized before any measurement can be taken. If not,
in some instances posterior shadows (which are
straight) will be confused with the optic nerve. The
caliper of the optic nerve can be measured. This
caliper is 2.6 mm on average (range, 2.2-3.0 mm).
Note that a cardiac probe is totally inappropriate
for this application, which requires submillimeter
precision.
Before analyzing the data, let us survey some of
the theoretical advantages of ultrasound:
1.
Bedside technique, immediately implemented.
2.
Ultrasound provides in-depth visualization of
the optic nerve, whereas optic fundus examina-
tion can only analyze the very end of the nerve.
Let us imagine, for instance, assessment of the
nose.
Measuring the length of the nose, should
full-face or profile photographs be used? How
far does this superiority of ultrasound over
optic fundus bring ultrasound compared to CT
in the search for intracranial hypertension?
3.
Compared with optic fundus examination, ultra-
sound does not require atropine administration
(a time-consuming and sometimes harmful
procedure) and is not hindered by cataract.
4.
Extremely simple technique. But does it really
work?
Let us now analyze our data. On-site observations
confirm all these theoretical points. An enlarged
optic nerve is pathological (Fig. 21.6). We com-
pared 25 cases of intracranial hypertension proven
on CT with 100 critically ill patients with proven
Fig.
21.5.
Normal pattern of the eyeball and of the optic
nerve in a scan through the eyelid. The optic nerve
(arrows) has a normal caliper (2.6 mm). Note the
sinuous route of the nerve. It should be remembered
that the pressure of the probe should be almost null in
this kind of approach
Fig.
21.6.
In this scan, the apparent caliper of the optic
nerve is markedly enlarged: 5.3 mm (black
arrows).
In
addition, the papilla (white
arrow)
bulges in the lumen
of the eyeball. There was diffuse brain edema on CT.
Diasonic Vingmed unit with a 7.5-MHz probe
154 Chapter 21 Head and Neck
absence of intracranial hypertension. Patients with
cerebral edema had enlargement of the optic nerve.
In this study, the best cut-off
was
4.5 mm. Patients
who had
a
greater
value
had cerebral edema in
80%
of cases, patients with a lower value had normal
brain status in
83%
of cases [7].
Since we prefer values near 100% (see lung
ultrasound performance, for instance, in Chaps.
15-18),
we
were not fully satisfied by these results.
Yet
several other signs can be analyzed in this field:
does the papilla protrude in the eyeball? Is the end
of the optic nerve enlarged, bulging or conversely
thinned? Is there a visible splitting of the optic
nerve? Are the measurements strictly stable or is
there imprecision when several measurements are
taken? Is there a frank asymmetry between the left
and the right? One of these items, or other not yet
noted items, may increase ultrasound accuracy:
rendezvous in the next edition.
Other applications are being investigated. For
instance,
we
would like to be able to do a spinal tap
without losing time in order to check whether this
procedure is
dangerous.
However, it
is
possible that
meningitis always has a minimal degree of intra-
cranial hypertension. This may result in an overly
sensitive test. If ultrasound detects minimal brain
edema too
easily,
the benefit of ultrasound may be
lost in this particular application. Experience and
more extensive data will allow us to conclude.
In practice, when we receive a comatose or
encephalopathic patient, we systematically mea-
sure the optic nerve. In the absence of strong clin-
ical evidence (of either extreme surgical emergency
or ordinary drug poisoning), patients having val-
ues below 4.5 mm are monitored at the bedside,
and patients with a higher value are referred for
emergency CT. Using this policy, we sometimes
undertake CT for nothing, but the misdiagnosis
of patients with alcoholic coma who do not
wake up because they had violent head trauma
accompanied by alcoholic intoxication is becom-
ing extremely rare.
The Brain
A
probe appUed at a precise location of the tempo-
ral bone displays a characteristic image, which
ends in a structure interpreted as the contralateral
bone
(Fig.
21.7).
This again proves that ultrasound
crosses the bones. Brain
images,
not yet fully iden-
tified in the present state of our knowledge, can be
described. One aim is to determine whether ultra-
Fig. 21.7.
Transverse scan of the brain. The biparietal
diameter is 13.5
cm,
the usual value in the adult. Many
details
are
visible between the
two
parietal bones
sound can detect a shift in these images. Earlier,
the
A
mode, a rudimentary ultrasonic system, was
used to determine whether the median structures
were shifted, thus indicating surgical emergencies
[8].
CT now provides accurate answers, but we
would be interested to see whether relevant infor-
mation can be obtained at the bedside, in order to
decrease the need for CT in certain instances, or
accelerate referral to CT in others.
Data on transcranial Doppler is not included
here.
This technique is probably of interest in the
traumatized patient
[9].
We deliberately have not
used the Doppler throughout this book, because
we believe in a light, unsophisticated, simple and
noninvasive tool. In the precise domain of cranial
trauma,
we
maybe commit an injustice. This
is
why
we hope that the measurement of the optic nerve
caliper will fill this gap.
The Face
The submaxillary glands and the lingual muscle
are accessible using ultrasound. Parotiditis, a clas-
sic compUcation of mechanical ventilation, should
give an enlarged, hypoechoic gland, which should
be sought between the ear and the maxilla.
We
lack
observations on this obviously rare or perhaps
misdiagnosed complication.