Báo cáo sinh học: " A simulation study of the effect of connectedness on genetic trend" potx
Bạn đang xem bản rút gọn của tài liệu. Xem và tải ngay bản đầy đủ của tài liệu tại đây (862.97 KB, 16 trang )
Original
article
A
simulation
study
of
the
effect
of
connectedness
on
genetic
trend
E
Hanocq*
D
Boichard,
JL
Foulley
Station
de
génétique
quantitative
et
appliquée,
Institut
national
de
la
recherche
agronomique,
78352
Jouy-en-Josas
cedex,
France
(Received
20
February
1995;
accepted
9
October
1995)
Summary -
A
breeding
scheme
was
simulated
with
four
subpopulations
over
seven
separate
generations.
Males
were
progeny
tested
before
selection.
A
varying
proportion
of
link
sires
were
used
across
populations
to
estimate
the
genetic
level
of
each
subpopulation.
The
male
replacement
policy
allowed
some
gene
flow
across
subpopulations.
Without
any
connection
between
subpopulations,
the
genetic
differences
between
subpopulations
were
not
estimable
and
the
overall
genetic
trend
was
limited.
With
few
connections
(proportion
of
link
sires
=
1/16),
the
accuracy
of
the
contrast
between
subpopulations
was
poor
but
the
gene
flow
between
subpopulations
made
it
possible
to
increase
the
overall
genetic
trend,
particularly
for
the
first
generations.
A
high
level
of
connections
improved
the
accuracy
of
the
genetic
evaluation
but
only
slightly
increased
the
genetic
trend.
connectedness
/
genetic
trend
/
progeny
testing
/
design
efficiency
/
selection
strategy
Résumé -
Étude
par
simulation
de
l’effet
du
degré
de
connexion
sur
le
progrès
génétique.
Un
schéma
de
sélection
constitué
de
quatre
sous-populations
est
simulé durant
sept
générations
séparées.
Les
mâles
sont
sélectionnés
à
l’issue
de
leur
testage
sur
descendance.
Des
mâles
de
connexion
sont
utilisés
en
proportion
variable
afin
d’estimer
le
niveau
génétique
de
chaque
sous-population,
ou
groupe
de
taureaux.
La
politique
de
renouvellement
adoptée
permet
l’existence
de
flux
de
gènes
entre
les
sous-populations.
En
l’absence
de
connexion,
les
différences
génétiques
entre
groupes
de
taureaux
ne
sont
pas
estimables
et
le
progrès
génétique
global
est
limité.
En
présence
de
connexions
en
faible
quantité
(proportion
de
taureaux
de
connexion
de
1/16),
la
précision
des
contrastes
entre
sous-populations
est
réduite
mais
le
flux
de
gènes
existant
permet
l’augmentation
du
progrès
génétique
global,
en
particulier
à
la
première
génération
de
sélection.
Un
degré
de
connexion
important
améliore
la
précision
de
l’évaluation
génétique
mais
l’accroissement
supplémentaire
du
progrès
génétique
est
faible.
connexion
/
progrès
génétique
/
testage
sur
descendance
/
efficacité
des
dispositifs
/
stratégie
de
sélection
*
Correspondence
and
reprints
to
SAGA,
INRA,
BP
27,
31326
Castanet-Tolosan
cedex,
France.
INTRODUCTION
The
animal
model
BLUP
has
become
the
method
of
choice
for
genetic
evaluation
with
linear
models
because
of
its
desirable
properties.
One
of
these
properties
is
that
breeding
values
are
estimated
at
the
population
level
and
can
be
compared
across
levels
of
fixed
effects,
for
instance,
across
herds
or
regions.
However,
this
property
is
true
only
if
the
corresponding
contrasts
are
accurately
estimable
or,
equivalently,
if
the
design
is
connected.
The
concept
of
connectedness
in
experimental
design
was
first
defined
by
statisticians
(Bose,
1947;
Weeks
and
Williams,
1964;
Searle,
1986).
To
prevent
lack
of
connectedness,
Foulley
and
Clerget
Darpoux
(1978)
and
Foulley
et
al
(1983)
developed
the
use
of
reference
sire
progeny
testing
schemes.
Application
of
reference
sire
systems
has
been
of
major
importance
in
the
development
of
selection
schemes
in
sheep
and
beef
cattle
(Foulley
and
M6nissier,
1978;
Foulley
and
Bib6,
1979;
Morris
et
al,
1980;
Foulley
and
Sapa,
1982;
Miraei
Ashtiani
and
James,
1991, 1992,
1993).
Geneticists
also
developed
methods
to
check
for
disconnection
(Peterson,
1978;
Fernando
et
al,
1983)
or
to
measure
the
degree
of
connectedness
in
a
design
(Foulley
et
al,
1984,
1990,
1992).
The
latter
authors
introduced
a
continuous
measure
of
the
orthogonality
of
a
design,
instead
of
the
previous
all-or-none
statistical
definition
of
connectedness.
All
these
methods
analyze
the
structure
of
the
experimental
design,
ie,
the
distribution
of
data
across
the
levels
of
factors
involved
in
the
model.
By
influencing
data
structure,
and
consequently
the
structure
of
the
error
variance-covariance
matrix
of
the
estimators,
connectedness
also
affects
the
effi-
ciency
of
a
breeding
program.
Foulley
et
al
(1983)
and
Miraei
Ashtiani
and
James
(1991,
1992)
showed
how
prediction
error
variances
(PEV)
of
estimated
breeding
values
or
linear
combinations
of
estimated
breeding
values
are
affected
by
the
de-
gree
of
connectedness.
Spike
and
Freeman
(1977)
analytically
derived
the
effect
on
selection
differential
of
a
loss
of
accuracy
in
estimated
breeding
values.
Simianer
(1991)
illustrated
this
effect
by
simulation.
Although
the
PEV
approach
is
very
useful
in
optimizing
a
breeding
scheme,
as
in
Miraei
Ashtiani
and
James
(1992),
it
provides
only
a
limited
picture
of
the
effect
of
connectedness.
The
analytical
study
of
the
effect
of
connectedness
on
response
to
selection
requires
the
calculation
of
selection
intensity,
as
in
Smith
and
Ruane
(1987)
or
Ducrocq
and
Quaas
(1988),
in
a
complex
population
with
subpopulations
of
different
genetic
levels.
Such
an
analytical
approach
assumes
that
the
genetic
differences
between
subpopulations
are
known.
Because
the
degree
of
connectedness
affects
the
accuracy
of
these
contrasts,
it
seemed
to
be
more
convenient
to
study
the
effect
of
connectedness
on
genetic
gain
by
simulation.
The
goal
of
this
paper
was
to
study
the
relationship
between
connectedness
and
genetic
trend
in
a
simple
but
realistic
breeding
scheme.
The
simulated
population
was
originally
derived
from
French
Holstein
dairy
cattle.
In
this
real
population,
the
candidates
for
selection
are
ranked
on
a
national
level,
although
breeding
is
organized
at
a
regional
level
with
AI
studs
independent
of
each
other.
MATERIAL
AND
METHODS
Description
of
the
simulated
breeding
scheme
General
overview
The
population
was
divided
into
M
subpopulations
of
the
same
size
and
structure.
Each
subpopulation
corresponded
to
an
independent
company
operating
in
its
own
region
and
included
N
males
and
N.n
females
per
generation.
The
generations
were
separate
and
there
were
no
female
exchanges
between
subpopulations.
Selection
was
applied
on
a
single
trait,
with
heritability
h2,
phenotypic
variance
2
and
genetic
variance
Q
a.
The
expression
of
the
trait
was
limited
to
the
females
and
was
affected
by
a
region
x
generation
environmental
effect.
The
females
were
not
selected.
After
a
progeny
test,
M.N.
1f
sires
of
males
were
selected
for
each
generation
to
sire
1/1f
sons
each.
Males
were
simulated
individually,
whereas
the
females
were
only
considered
via
cohorts
defined
according
to
subpopulation
and
generation.
This
assumption
reduced
the
computational
requirements
to
a
large
extent
but
remained
realistic,
because
there
was
neither
selection
of
females
nor
within-subpopulation
assortative
matings.
Table
I
shows
the
parameters
used
in
the
simulation.
The
connections
among
subpopulations
were
initially
nonexistent
and
were
gradually
generated
through
two
different
mechanisms.
First,
planned
connections
were
established
using
a
proportion
p
of
link
sires
in
several
subpopulations.
Each
link
sire
belonging
to
subpopulation
i
sired
nq/2
daughters
in
subpopulations
i
+
1
and
i - 1,
and
n(1 -
q)
daughters
in
subpopulation
i.
The
other
males
sired
n
daughters
in
their
own
subpopulation
only.
Secondly,
unplanned
links
were
generated
through
the
policy
of
male
replacement,
which
allowed
some
exchange
among
subpopulations.
Each
subpopulation
partly
replaced
its
males
by
keeping
the
sons
of
its
own
O
:1!&dquo; N
best
sires.
The
rest
were
supplied
from
the
whole
population
according
to
the
following
procedure.
Among
the
(1 —
a!r).N.M
sires
who
were
still
candidates,
the
(1 -
a).!r.N.M
best
ones
were
selected
and
randomly
mated
to
females
from
their
own
subpopulation
to
procreate
1/
7r
young
males
each.
These
young
males
were
allocated
in
priority
to
their
subpopulation
of
origin.
Males
in
excess
in
one
subpopulation
were
then
randomly
allocated
across
the
other
subpopulations.
Therefore,
the
rate
of
male
replacement
within-subpopulation
might
vary
from
a
to
1,
and
on
average
increased
with
the
genetic
level
of
the
subpopulation.
Such
a
policy
allowed
large
gene
flows
across
subpopulations,
while
maintaining
a
clear
advantage
for
the
best
ones.
Simulation
procedures
At
generation
1,
the
subpopulations
were
completely
disconnected
and
independent
of
each
other.
The
males
were
unrelated.
The
average
genetic
level
of
males
(gmi
ll
)
and
females
(g¡}1J)
was
the
same
within
a
subpopulation
i,
but
differed
among
subpopulations.
It
was
arbitrarily
fixed
to
gm!1]
=
g fil 1
1]
=
0.4(i -
This
assumption
corresponded
to
a
between-subpopulation
variance
equal
to
0.05.
At
generation
1,
the
breeding
value
of
male j
of
subpopulation
i
was
written
as
where
s
zj
was
assumed
to
be
normally
distributed
N(0,
Q
a).
At
generation
t
(t
>
1),
the
breeding
value
of
male
k
offspring
of
sire j
was
simulated
as
follows:
where £
k
was
assumed
to
be
normally
distributed
A!(0,3/4c!).
The
dam
of
k
belonged
to
the
subpopulation
i
of
the
sire
j.
The
average
female
genetic
level
gIl
t]
in
subpopulation
i at
generation
t
was
simulated
according
to
equation
[3]
where
a!t-1!
is
the
vector
of
breeding
values
of
the
males
at
generation
t -
1
and
xit-l]
is
the
vector
of
numbers
of
daughters
of
each
male
of
generation
t
-
1
in
subpopulation
i.
Because
of
the
large
number
of
females
contributing
to
gilt],
no
random
variation
was
assumed
to
affect
gilt],
which
was
assumed
to
be
equal
to
its
expectation.
The
average
female
genetic
level
per
subpopulation
and
generation
accounted
for
the
individual
breeding
value
of
each
sire
used,
weighted
by
the
number
of
daughters.
Therefore
females
profited
from
the
genetic
gain
due
to
male
selection,
and
transmitted
this
advantage
to
their
male
and
female
progeny.
Notice
that
the
breeding
value
ai
l
of
each
male
and
the
expected
level
of
each
female
group
g f/!l
at
generation
t could
be
written
as
a
linear
combination
of
the
initial
levels
(gm!l!,
gill])
and
the
within-group
breeding
values
of
males
of
generations
1
to
t -
1.
This
property
was
used
in
the
genetic
evaluation,
as
will
be
explained
later.
At
generation
1,
the
environmental
effect
((3)
differed
across
subpopulations
and
was
defined
arbitrarily
as
0111 -
-0.4(i -
1)!P.
During
the
succeeding
generations,
it
was
defined
according
to
the
following
rule
(0!’l
=
¡3l!-;.l];
i
=
1,
M -
1
and
¡3rJ
=
¡3
i
t-ll),
to
avoid
any
systematic
association
between
genetic
and
environ-
mental
effects.
A
sire
born
at
generation
t had
daughters
with
performance
in
generation
t +
1.
The
average
performance
y
jr
of
n
jr
daughters
of
sire j
in
subpopulation
r
was
simulated
according
to
equation
[4]
where
p
is
a
mean
and
e!tr+1]
is
assumed
to
be
normally
distributed:
Genetic
evaluation
It
was
not
possible
to
fit
an
animal
model
to
the
data
since
the
individual
female
records
were
not
generated.
Its
use
would
actually
be
of
limited
interest
due
to
the
absence
of
assortative
mating
and
female
selection.
However,
the
model
of
analysis
should
adequately
fit
the
simulated
situation
and
should
explicitly
account
for
the
differences
in
female
genetic
levels
across
subpopulations
and
generations.
Because
the
female
genetic
level
was
entirely
determined
by
the
contribution
of
founder
groups
and
the
male
ancestors,
an
equivalent
model
involving
only
the
environmental
effects
{3,
the
founder
effects
and
the
within-subpopulation
sire
effects
s,
could
be
written
as
follows,
by
using
equations
!1-4!:
with
Var(s)
=
AQ
a,
where
A
is
the
relationship
matrix
between
males,
ignoring
relationships
through
females,
and
H
is
an
incidence
matrix
containing
the
proba-
bility
that
genes
of
females
with
records
originated
from
each
founder
group.
The
matrix
W
could
be
expressed
as
W
=
Z
+
!,
where
Z
was
the
incidence
matrix
relating
each
sire
to
the
performance
of
his
daughters. 0
was
defined
in
such
a
way
that
it
accounted
for
all
the
males
who
determined
the
genetic
level
of
the
female
ancestors
of
the
females
with
records.
Its
general
term
6
zj
was
not
zero
for
any
sire j
,?
of
a
female
ancestor
of
the
cohort
i
of
females
with
data.
Its
value
was
the
expected
proportion
of
i’s
genes
originating
from
j.
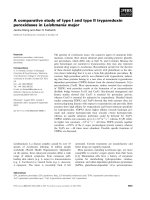
For
instance,
as
shown
in
figure
1,
the
contribution
6
12
of
male
2
to
the
female
cohort
1
with data
was
n
2/
4Nn,
assuming
n2
was
the
number
of
daughters
of
sire
2
in
cohort
3.
As
a
consequence,
0
was
quite
dense.
In
practice,
because
the
number
of
generations
remained
low
(seven
in
the
present
simulation),
0
was
restricted
to
the
relationships
presented
in
figure
1
with
negligible
consequences.
This
methods
was
validated
by
the
good
agreement
between
true
and
estimated
genetic
trends
and
was
found
to
satisfactorily
describe
the
gene
flow
through
the
females.
This
model
was
solved
iteratively
as:
where
I
is
the
iteration
number.
Situations
compared
Four
situations
were
compared:
one
situation
denoted
Sl
without
any
connection
(p
=
0 and
a
= 1)
and
three
situations
with
increasing
connection
levels
(S2:
p
= 1/16;
S3:
p
= 1/4;
S4:
p
=
1)
and
a
limited
replacement
rate
forced within-
subpopulation
to
a
=
0.25.
For
each
situation,
60
replicates
were
run.
Each
replicate
involved
the
following
sequence
repeated
over
seven
generations:
generation
of
animals,
genetic
evaluation,
selection
of
sires,
and
computation
of
connectedness
criteria.
The
evaluation
step
used
FSPAK
software
(Perez-Enciso
et
al,
1994).
Criteria
for
measuring
the
effect
of
connectedness
The
impact
of
connectedness
was
measured
in
different
ways.
The
first
criterion
was
the
true
genetic
trend.
This
illustrates
both
the
gene
flow
between
subpopulations
and
the
increase
in
the
accuracy
of
the
evaluation,
particularly
among
subpopula-
tions.
Moreover,
it
is
the
most
direct
method
of
appreciating
the
efficiency
of
the
design.
The
quality
of
the
genetic
evaluation
was
measured
by
the
bias
in
the
estimated
genetic
trend,
by
the
mean
square
error
(MSE)
pertaining
to
either
individual
sires
or
subpopulation
x
generation
means,
and
by
the
squared
correlation
between
true
and
estimated
breeding
values
over
seven
generations.
This
criterion
was
quite
similar
to
a
coefficient
of
determination
and
was
called
’CD’,
although
it
was
not
defined
in
reference
to
the
genetic
variance
of
the
base
population.
The
connection
level
of
the
design
was
ascertained
via
the
sampling
error
variance
of
the
male
and
female
founder
group
effects
as
proposed
by
Foulley
et
al
(1992).
Three
criteria
were
used:
the
determinant
of
the
error
variance-
covariance
matrix
of
the
group
effects,
with
or
without
the
environmental
effect
in
the
model
(!CF!(1/(M-1))
and
!CRI(1/(’vt-1))
respectively),
and
the
criterion
proposed
by
Foulley
et
al
(1992)
applied
to
those
group
effects.
y*
measures
the
relative
loss
in
accuracy
due
to
the
fitting
of
the
environmental
effect
in
the
model.
RESULTS
Effect
of
connectedness
on
genetic
trend
Genetic
trend
in
the
whole
population
Figure
2
shows
the
change
of
the
overall
genetic
level
in
the
absence
of
connectedness
(situation
S1).
The
pattern
of
this
trend
was
typical
and
found
for
every
situation.
It
reflected
the
absence
of
selection
between
generations
1
and
2,
a
large
genetic
gain
(0.46o
a)
between
generations
2
and
3,
ie,
during
the
first
selection
cycle,
and
afterwards,
a
quasi-linear
genetic
trend
from
generation
3
to
generation
7
(0.21
Q
a).
The
overall
genetic
trend
was
satisfactorily
estimated
(0.47
Qa
in
generation
3,
0.19Q!
thereafter)
but
the
genetic
level
was
severely
underestimated
(-0.60o,,,).
In
connected
situations
(S2
to
S4),
the
effect
on
the
overall
genetic
trend
was
found
to
be
quite
similar
whatever
the
connection
level.
Figure
3
presents
the
situation
S3
with
p
=
1/4.
After
a
first
stage
without
selection,
which
generated
the
first
links
between
groups,
the
genetic
gain
reached
0.61(ja
at
the
first
selection
cycle
and
0.25o!
thereafter.
The
initial
genetic
level
was
slightly
underestimated,
as
was
the
asymptotic
genetic
trend.
These
small
biases
tended
to
disappear
when
the
connection
level
increased.
The
major
contribution
of
connectedness
to
the
whole
population
was
a
large
increase
in
genetic
trend
(+
20%)
at
each
selection
cycle.
However,
increasing
connectedness
only
slightly
improved
the
estimation
of
genetic
trend.
genetic
trend
Figure
4
shows
the
change
in
genetic
level
of
each
subpopulation
without
connec-
tions.
Mean
trends
were
parallel
and
depended
only
on
the
initial
level.
However,
the
estimated
curves
(fig
5)
were
confounded,
illustrating
that
genetic
differences
among
groups
were
not
estimable.
In
the
connected
situations
(fig
6),
the
response
was
very
different
across
sub-
populations.
At
the
first
selection
cycle,
genetic
gains
reached
0.88,
0.61,
0.47
and
0.47(j
a
for
the
subpopulations
1
to
4,
respectively,
and
0.28, 0.26,
0.23
and
0.21
in
the
subsequent
steps.
The
subpopulations
with
the
lowest
initial
level
exhibited
the
largest
gains
due
to
a
significant
gene
flow
between
populations.
Genetic
differences
across
subpopulations
decreased
over
time.
Between
extreme
subpopulations,
this
difference
decreased
from
1.2o,,,
initially
to
0.49o,,,
at
generation
7.
However,
due
to
the
replacement
policy
chosen
in
this
study,
the
subpopulations
with
the
highest
initial
level
kept
a
clear
advantage
over
time,
while
strongly
contributing
to
the
overall
genetic
gain.
The
genetic
trend
was
always
well
estimated
(fig
7):
0.89,
0.66,
0,50
and
0.46a&dquo;
at
the
first
selection
cycle,
and
0.25, 0.24,
0.20
and
0.20
thereafter.
In
contrast,
differences
among
subpopulations
were
unbiased
only
in
the
highly
connected
situation
(p
=
1).
These
differences
appeared
to
be
overestimated
in
S2
(ie,
when
the
proportion
of
link
sires
was
p
=
1/16)
and
underestimated
in
S3
(p
=
1/4).
However,
these
biases
were
small
enough
to
provide
the
correct
ranking
between
subpopulations
and
to
efficiently
orientate
the
gene
flows.
The
true
genetic
trends
consequently,
only
slightly
affected
by
the
connection
level,
provided
that
it
was
not
zero.
Gene
flows
across
subpopulations
and,
therefore,
the
overall
genetic
gain
de-
pended
on
both
differences
in
initial
genetic
levels
and
the
replacement
policy.
When
the
differences
in
initial
genetic
levels
were
fixed
to
zero,
connectedness
did
not
succeed
in
increasing
the
genetic
trend.
Similarly,
when
the
replacement
pol-
icy
did
not
allow
gene
flow
across
subpopulations
(a
=
1),
the
genetic
differences
across
subpopulations
were
well
estimated
but
could
not
be
used
in
selection,
and
the
genetic
trend
was
not
increased.
Influence
of
connectedness
on
the
accuracy
of
estimates
Except
for
!y*,
which
is
a
relative
measure
of
connectedness,
all
the
criteria
showed
an
increase
in
accuracy
with
an
increase
in
the
proportion
p
of
connecting
males
(tables
II
and
III).
This
trend
was
not
linear.
The
gain
in
individual
accuracy
was
very
large
for
the
introduction
of
a
small
level
of
connections,
from
p
=
0 to
p
=
1/16,
whereas
it
was
much
less
for
a
higher
level
of
connections,
ie,
from
p
= 1/4
to
p
=
1.
As
an
illustration,
the
MSE
pertaining
to
individual
male
breeding
values
was
divided
by
2.03
when
p
increased
from
0
to
1/16,
and
by
only
1.14
when
p
increased
from
1/4
to
1.
Similarly,
the
CD
reached
0.67, 0.77,
0.81
and
0.83
for
p
equal
to
0,
1/16,
1/4
and
1,
respectively.
The
advantages
of
having
a
high
connectedness
level
were
more
obvious
for
cri-
teria
related
to
group
means.
The
MSE
for
the
average
male
level
per
generation
x
subpopulation
decreased
gradually
when
p
increased.
A
similar
pattern
was
ob-
served
with
the
standardized
error
variance
of
the
groups.
These
determinants
de-
creased
when
p
increased,
illustrating
the
increase
in
accuracy
due
to
connectedness.
This
increase
was
much
more
rapid
for
male
than
for
female
founder
groups
when
the
full
model
was
used.
As
there
were
no
female
exchanges
between
subpopula-
tions,
the
only
connections
among
the
female
founder
groups
were
due
to
the
genes
of
the
dams
of
the
connecting
or
exchanged
sires.
Whatever
the
considered
situa-
tion,
the
inequality
!CR!(1/(‘vt-1))
<
ICFI!1/i‘vt-1))
showed
that
the
introduction
of
environmental
effects
always
induced
a
loss
in
accuracy.
Surprisingly,
criterion
q*
became
worse
when
the
connectedness
increased.
In
fact,
!y*
is
a
relative
criterion
measuring
the
cost
of
estimating
an
effect
in
a
given
design.
The
decrease
in
-y
*
when
p
increased
simply
means
that
the
relative
loss
in
accuracy
due
to
the
estima-
tion
of
environmental
effects
was
proportionally
larger
when
there
was
more
overall
connectedness.
DISCUSSION
AND
CONCLUSION
The
genetic
response
is
highest
after
the
first
cycle
of
selection.
This
is
due
to
the
initial
male
and
female
genetic
level,
assumed
to
be
the
same
within
a
subpopulation.
During
the
first
cycle
of
selection
only
males
were
selected.
This
results
in
a
one-generation
genetic
lag
(Bichard,
1971)
between
unselected
male
and
female
populations.
Without
connections,
subpopulations
with
the
same
structure
and
size
apply
independently
the
same
selection
intensity
and
have
the
same
genetic
response.
Establishing
connections
boosts
the
genetic
trend
of
the
whole
population
and
introduces
a
heterogeneity
of
response
between
subpopulations.
The
response
of
the
lowest
level
subpopulations
strongly
increases.
These
results
are
in
agreement
with
Smith
and
Banos
(1991)
who
compared
the
efficiency
of
selection
applied
within
either
the
whole
population
or
closed
subpopulations.
They
also
found
that
connections
were
more
beneficial
for
subpopulations
with
a
lower
initial
genetic
level
and
a
smaller
size.
However,
the
present
study
shows
that
the
subpopulation
with
the
highest
initial
level
can
also
obtain
a
genetic
trend
equal
to
or
greater
than
that
without
connections.
The
increase
in
genetic
trend
with
connections
is
due
to
a
gene
flow
from
subpop-
ulations
having
a
high
genetic
level
to
subpopulations
with
a
low
genetic
level.
The
differences
in
the
average
genetic
levels
gradually
decrease
across
subpopulations.
The
convergence
rate
depends
strongly
on
the
replacement
policy,
particularly
on
the
proportion
of
forced
within-subpopulation
replacement.
Homogenization
is
also
faster
when
the
initial
genetic
differences
are
larger,
in
agreement
with
Smith
and
Banos
(1991).
It
also
depends
on
the
selection
intensity.
The
higher
the
selection
intensity,
the
greater
the
proportion
of
selected
animals
from
the
best
subpopu-
lation
and
the
larger
the
gene
flow
between
subpopulations.
This
is
in
agreement
with
many
studies
(Robertson,
1961;
Burrows,
1984;
Verrier
et
al,
1990;
Wray
and
Thompson,
1990;
Quinton
et
al,
1992).
The
impact
of
gene
flow
can
be
illustrated
by
the
change
over
time
of
the
contribution
of
founder
groups
to
the
gene
pool
of
the
population.
Another
more
classical
interpretation
of
the
advantage
of
using
connections
to
increase
genetic
trend
is
the
increase
in
genetic
variance,
due
to
the
additional
between-subpopulations
variability,
which
is
not
available
with
traditional
selection
using
closed
subpopulations
(James,
1982).
This
study,
in
agreement
with
Miraei
Ashtiani
and
James
(1993),
shows
that
establishing
connections
within
a
large
population
does
not
improve
the
genetic
response
when
the
initial
genetic
differences
across
subpopulations
are
non-existent,
provided
that
subpopulations
are
large
enough.
The
lack
of
connection
induces
a
large
bias
in
the
estimation
of the
genetic
level
of
the
subpopulations,
because
the
differences
among
subpopulations
are
not
estimable
and
are
assumed
to
be
zero.
However,
even
without
connections
between
subpop-
ulations,
the
overall
genetic
trend,
identical
to
the
average
within-subpopulation
genetic
trend,
is
estimable.
In
contrast,
the
differences
between
subpopulations
be-
come
estimable
even
with
a
limited
degree
of
connectedness
(p
=
1/16),
which
turned
out
to
be
sufficient
to
direct
gene
flows
across
subpopulations
in
the
ex-
pected
direction.
However,
the
accuracy
of
the
estimated
mean
genetic
level
per
generation
x
subpopulation
gradually
increases
with
the
connection
level.
Finally,
it
could
be
concluded
that
genetic
trend
could
be
increased
when
subpopulations
have
different
initial
genetic
levels,
when
connectedness
is
large
enough
to
make
these
differences
estimable,
and
when
the
selection
and
replacement
policy
allows
one
to
take
advantage
of the
best
genes
by
appropriate
gene
flows.
Although
planned
connections
are
usually
hard
to
establish,
at
least
at
the
beginning,
a
rather
small
amount
may
be
sufficient
because
they
are
rapidly
and
involuntarily
completed
by
the
quantitatively
larger
gene
flows.
The
accuracy
of
the
individual
genetic
evaluation
increases
with
the
proportion
of
connecting
sires
but
this
increase
is
not
linear
with
p.
The
marginal
increase
is
high
when
p
is
close
to
zero
and
is
much
lower
for
higher
values
of
p.
Similarly,
in
connected
situations,
the
accuracy
of
the
estimated
genetic
trend
only
slightly
increases
with
p.
This
relatively
small
impact
of
the
proportion
of link
sires
may
be
explained
by
replacement
rules
which
strongly
connect
the
different
subpopulations.
The
accuracy
of
the
estimates
of
contrasts
between
groups,
measured
in
the
full
model
by
ICFI
(’I(
M-1
))
or
in
the
reduced
model
by
!CR!(1/(‘!’I-1)),
increased
as
expected,
with
p.
However,
it
increases
more
rapidly
in
the
reduced
model
than
in
the
full
model.
Consequently,
the
ratio
q*
decreases
with
p.
This
trend
means
that
accounting
for
the
environmental
effect
leads
to
a
higher
relative
loss
in
accuracy
when
the
connectedness
is
high.
In
contrast,
when
connectedness
is
low,
the
accuracy
is
already
low
in
the
reduced
model
and
the
relative
loss
of
accuracy
is
limited
when
adding
the
environmental
effect
to
the
model.
This
result
shows
clearly
that
q*
is
a
qualitative
measure
of
connectedness
in
a
design,
whereas
the
other
criteria
provide
an
absolute
measure
of
accuracy,
suggesting
that
the
three
criteria
CR,
CF
and
y*
should
be
used
jointly
to
compare
different
designs.
Theoretically,
connectedness
should
be
analyzed
at
the
individual
level,
by
comparing
the
prediction
error
variance
of the
contrasts
of interest
between
breeding
values.
When
the
model
includes
a
fixed
group
effect,
as
in
the
present
study,
the
breeding
value
has
a
fixed
component
due
to
groups
and
a
within-group
random
component.
Because
the
error
variance
of
the
random
component
is
upwardly
bounded
while
that
of
the
fixed
component
is
not,
the
limiting
factor
in
the
genetic
evaluation
is
the
group
effect
in
situations
of
low
level
of
connectedness.
Studying
connectedness
for
individuals,
within
groups,
is
only
relevant
when
the
connection
between
groups
is
not
limiting.
When
computation
of PEV
is
impossible,
Kennedy
and
Trus
(1993)
proposed
using
the
proportion
of
founder
genes
to
obtain
an
approximate
measure
of
connectedness.
Connectedness
has
its
own
dynamics
closely
linked
to
the
selection
policy
applied.
For
instance,
better
connections
in
the
first
generations
lead
to
a
higher
realized
selection
intensity
and
therefore
a
higher
diffusion
of
the
genes
of
the
best
groups
in
the
whole
population.
Because
the
contribution
of
the
weaker
groups
decreases,
the
between-group
connection
measure
after
several
generations
may
be
worse
than
in
a
design
with
less initial
connections,
which
preserves
more
efficiently
the
original
genetic
diversity.
In
contrast,
when
the
emphasis
is
put
on
the
random
component,
particularly
when
there
is
no
group
effect
in
the
model,
the
generalized
CD,
as
proposed
by
Laloe
(1993),
is
appropriate
for
characterizing
the
quality
of
the
evaluation.
It
accounts
for
the
amount
of
information
as
well
as
the
balance
of
the
design.
As
proposed
by
Foulley
et
al
(1983),
it
would
also
be
possible
to
compute
the
CD
of
the
linear
combinations
of
breeding
values
for
a
restricted
number
of
contrasts
of
major
interest.
As
connectedness
is
closely
related
to
gene
flows,
breeding
companies
may
be
concerned
by
its
advantage
for
their
own
interest.
Connectedness
is
essential
for
an
objective
inter-line
comparison.
Notice
that
the
attitude
of
breeding
companies
to-
wards
connectedness
may
heavily
depend
on
the
economic
context,
eg,
competition
vs
cooperation
or
a
mixture
of
both.
An
appropriate
replacement
policy
may
en-
sure
that
companies
with
the
highest
level
maintain
their
leadership,
but
it
cannot
prevent
a
massive
gene
flow
and
a
dramatic
decrease
in
differences
across
subpop-
ulations
after
only
one
or
two
generations.
In
the
international
context,
such
a
study
may
be
useful
to
assess
the
minimum
level
of
connection
required
to
compare
the
genetic
levels
between
countries
and
thus
derive
conversion
formulae
between
countries,
as
in
dairy
cattle.
This
study
is
also
an
illustration
of
the
complex
relationships
existing
between
selection
strategy
and
selection
efficiency.
Chevalet
(1974),
Katz
and
Young
(1975),
Madalena
and
Robertson
(1975),
Wright
(1978),
and
more
recently
Smith
and
Banos
(1991)
and
Smith
and
Quinton
(1993)
studied
the
relative
efficiency
of
selection
within
large
populations
or
in
populations
divided
into
several
more
or
less
connected
subpopulations.
In
this
respect,
connectedness
can
be
viewed
as
an
intermediate
and
flexible
policy
between
selection
across
subpopulations
(family,
strain,
etc)
and
selection
in
a
single
whole
population.
REFERENCES
Bichard
M
(1971)
Dissemination
of
genetic
improvement
through
a
livestock
industry.
Anim
Prod
13,
401-411
Bose
RC
(1947)
Presidential
Address.
Proc
34th
Indian
Sci
Congress
Burrows
PM
(1984)
Inbreeding
under
selection
from
unrelated
families.
Biometrics
40,
357-366
Chevalet
C
(1974)
Nouvelles
voies
d’approche
pour
les
etudes
g6n6tiques
des
populations
animales.
In:
Ist
World
Congress
of
Genetics
Applied
to
Livestock
Production,
Madrid,
Spain,
October
7-11,
Madrid
Editorial
Garsi,
2,
327-343
Ducrocq
V,
Quaas
RL
(1988)
Prediction
of
genetic
response
to
truncation
selection
across
generations.
J
Dairy
Sci
71,
2543-2553
Fernando
RL,
Gianola
D,
Grossman
M
(1983)
Identifying
all
connected
subsets
in
a
two-
way
classification
without
interaction.
J
Dairy
S’ci
66,
1399-1402
Foulley
JL,
Clerget
Darpoux
F
(1978)
Progeny
group
size
for
evaluating
natural
service
bulls
using
AI
reference
sires.
Ann
Génét
Sel
Anim
10,
541-556
Foulley
JL,
M6nissier
F
(1978)
Arguments
in
favour
of
an
evaluation
system
for
natural
service
bulls
belonging
to
beef
breeds,
by
taking
into
account
the
diffusion
of
the
best
AI
bulls.
Charolais
52,
53-57
Foulley
JL,
Bib6
B
(1979)
Utilisation
conjointe
de
1’insemination
artificielle
et
de
la
saillie
naturelle
en
vue
de
1’indexation
des
reproducteurs.
In:
5&dquo;
journée
de
la
recherche
ovine
et
caprine,
Paris,
5-6
December
1979,
INRA-ITOVIC,
205-211
Foulley
JL,
Sapa
J
(1982)
The
French
evaluation
program
for
natural
service
beef
bulls
using
AI
sire
progeny
as
herd
ties.
Digest
37,
64-67
Foulley
JL,
Schaeffer
LR,
Song
H,
Wilton
JW
(1983)
Progeny
group
size in
an
organized
progeny
test
program
of
AI
beef
bulls
using
reference
sires.
Can
J
Anim
Sci
63,
17-26
Foulley
JL,
Bouix
J,
Goffinet
B,
Elsen
JM
(1984)
Comparaison
de
p6res
et
connexion.
In:
Insemination
artifccielle
et
am6lioration
génétique :
Bilan
et
perspectives
critiques
(JM
Elsen,
JL
Foulley,
eds),
Colloque
de
1’INRA,
Toulouse-Auzeville,
France,
23-24
November,
29,
131-176
Foulley
JL,
Bouix
J,
Goffinet
B,
Elsen
JM
(1990)
Connectedness
in
genetic
evaluation.
In:
Advances
in
Statistical
Methods
for
Genetic
Improvement
of
Livestock
(D
Gianola,
K
Hammond,
eds),
Springer-Verlag,
Heidelberg,
277-308
Foulley
JL,
Hanocq
E,
Boichard
D
(1992)
A
criterion
for
measuring
the
degree
of
connectedness
in
linear
models
of
genetic
evaluation.
Genet
Sel
Evol
24,
315-330
James
JW
(1982)
Influences
of
population
structure
and
size
on
genetic
progress.
In:
Proc
Wld
Cong
Sheep
and
Beef
Cattle
Breed
(RA
Barton,
WC
Smith,
eds),
Palmerston
North,
New
Zealand,
3-12
November,
1, 283-290
Katz
AJ,
Young
SSY
(1975)
Selection
for
high
adult
body
weight
in
Drosophila
populations
with
different
structures.
Genetics
81,
163-175
Kennedy
BW,
Trus
D
(1993)
Considerations
on
genetic
connectedness
between
manage-
ment
units
under
an
animal
model.
J
Anim
Sci
71,
2341-2352
Laloe
D
(1993)
Precision
and
information
in
linear
models
of
genetic
evaluation.
Genet
Sel
Evol
25,
557-576
Madalena
FE,
Robertson
A
(1975)
Population
structure
in
artificial
selection:
studies
with
Drosophila
melanogaster.
Genet
Res
Camb
24,
113-126
Miraei
Ashtiani
SR,
James
JW
(1991)
Efficient
use
of
link
rams
in
Merino
sire
reference
schemes.
Proc
Aust
Assoc
Anim
Breed
Genet
9,
388-391
Miraei
Ashtiani
SR,
James
JW
(1992)
Optimum
distribution
of
progeny
in
sire
reference
schemes. Proc
Aust
Assoc
Anim
Breed
Genet
10,
476-479
Miraei
Ashtiani
SR,
James
JW
(1993)
Optimum
family
size
for
progeny
testing
in
populations
with
different
strains.
Genet
Sel
Evol
25,
339-352
Morris
CA,
Jones
LP,
Hopkins
IR
(1980)
Relative
efficiency
of
individual
selection
and
reference
sire
progeny
test
schemes
for
beef
production.
Aust
J
Agric
Res
31,
601-613
Perez-Enciso
M,
Misztal
I,
Elzo
MA
(1994)
FSPAK:
an
interface
for
public
domain
sparse
matrix
subroutines.
In:
5th
World
Congress
on
Genetics
Applied
to
Livestock
Production.
Guelph,
Ontario,
Canada,
August
7-12
(C
Smith
et
al,
eds),
22,
87-88
Petersen
PH
(1978)
A
test
for
connectedness
fitted
for
the
two-way
BLUP
sire
evaluation.
Acta
Agric
Scand
28,
360-362
Quinton
M,
Smith
C,
Goddard
ME
(1992)
Comparison
of
selection
methods
at
the
same
level
of
inbreeding.
J
Anim
Sci
70,
1060-1067
Robertson
A
(1961)
Inbreeding
in
selection
programmes.
Genet
Res
2,
189-194
Searle
SR
(1986)
Linear
Models.
Wiley,
New
York
Simianer
H
(1991)
Prospects
for
third
generation
methods
of
genetic
evaluation.
In:
42nd
Annual
Meeting
of
the
EAAP,
Berlin,
Germany,
Sept
8-12,
13
p
Smith
C,
Ruane
J
(1987)
Use
of
sib
testing
as
a
supplement
to
progeny
testing
to
improve
the
genetic
merit
of
commercial
semen
in
dairy
cattle.
Can
J
Anim
Sci
67,
985-990
Smith
C,
Banos
G
(1991)
Selection
within
and
across
populations
in
livestock
improve-
ment.
J
Anim
Sci
69,
2387-2394
Smith
C,
Quinton
M
(1993)
Effect
of
selection
in
sublines
and
crossing
on
genetic
response
and
inbreeding.
J
Anim
Sci
71,
2631-2638
Spike
PL,
Freeman
AE
(1977)
Effect
of
genetic
differences
among
herds
on
accuracy
of
selection
and
expected
genetic
change.
J
Dairy
Sci
60,
967-974
Verrier
E,
Colleau
JJ,
Foulley
JL
(1990)
Predicting
cumulated
response
to
directional
selection
in
finite
panmictic
populations.
Theor
Appl
Genet
79,
833-840
Weeks
DL,
Williams
DR
(1964)
A
note
on
the
determination
of
connectedness
in
an
N-way
cross
classification.
Technometrics
6,
319-324
Wray
NR,
Thompson
R
(1990)
Prediction
of
inbreeding
in
selected
populations.
Genet
Res
55,
41-54
Wright
S
(1978)
The
relation
of
livestock
breeding
to
theories
of
evolution.
J
Anim
Sci
46,
1192-1200