Báo cáo y học: " Preferential binding of HIF-1 to transcriptionally active loci determines cell-type specific response to hypoxia" docx
Bạn đang xem bản rút gọn của tài liệu. Xem và tải ngay bản đầy đủ của tài liệu tại đây (1.9 MB, 12 trang )
Open Access
Volume
Xia and 10, Issue 10, Article R113
2009 Kung
Research
Preferential binding of HIF-1 to transcriptionally active loci
determines cell-type specific response to hypoxia
Xiaobo Xia and Andrew L Kung
Address: Department of Pediatric Oncology, Dana-Farber Cancer Institute, Children's Hospital Boston, and Harvard Medical School, Binney
Street, Boston, MA 02115, USA.
Correspondence: Andrew L Kung. Email:
Published: 14 October 2009
Genome Biology 2009, 10:R113 (doi:10.1186/gb-2009-10-10-r113)
Received: 11 June 2009
Revised: 18 September 2009
Accepted: 14 October 2009
The electronic version of this article is the complete one and can be
found online at />© 2009 Xia and Kung; licensee BioMed Central Ltd.
This is an open access article distributed under the terms of the Creative Commons Attribution License ( which
permits unrestricted use, distribution, and reproduction in any medium, provided the original work is properly cited.
active genes.
ChIP-chip and microarray
Cellular response to hypoxia expression studies show that, in response to hypoxia, HIF-1 preferentially binds to and up-regulates already
Abstract
Background: Hypoxia-inducible factor 1 (HIF-1) plays a key role in cellular adaptation to hypoxia.
To better understand the determinants of HIF-1 binding and transactivation, we used ChIP-chip and
gene expression profiling to define the relationship between the epigenetic landscape, sites of HIF1 binding, and genes transactivated by hypoxia in two cell lines.
Results: We found that when cells were acutely subjected to hypoxia, HIF-1 preferentially bound
to loci that were already transcriptionally active under normal growth conditions characterized by
the presence of histone H3 lysine 4 methylation, the presence of RNA polymerase II, and basal
production of mRNA. Cell type-specific differences in HIF-1 binding were largely attributable to
differences in the basal gene expression patterns in the cells prior to the onset of hypoxia.
Conclusions: These results suggest that the repertoire of genes active in a cell (for example,
through lineage specific transcription factors) defines the subset of genes that are permissive for
binding and transactivation by stimulus-responsive transcription factors.
Background
Hypoxia, a reduction in the normal level of oxygen in tissues,
occurs during various physiological and pathological conditions, such as embryonic development, ischemic disease, pulmonary disease, and cancer [1]. The transcription factor
Hypoxia-inducible factor 1 (HIF-1) is a key mediator of cellular homeostasis in response to hypoxia. HIF-1 transactivates
genes that facilitate metabolic adaptation by shifting from
oxidative phosphorylation to anaerobic glycolysis, and
enhances oxygen delivery by inducing vasodilatation,
increasing vascular permeability, enhancing erythropoiesis,
and angiogenesis [1]. Our previous studies have also suggested a third compensatory program consisting of up-regu-
lation of multiple members of the 2-OG-dioxygenase family,
which all require molecular oxygen for their enzymatic activity [2].
Several hundreds of genes have been validated as direct targets of HIF-1 transactivation in a variety of biological systems
[2-4]. Alignment of the sequences encompassing these HIF-1
binding sites has revealed a consensus core motif of 5'-A/
GCGTG-3'. However, it is clear that this promiscuous motif
cannot be the sole determinant of HIF-1 binding and transactivation. As is the case for other transcription factors such as
E2F1, Myc, estrogen receptor, FoxA1, and p63 [5-8], HIF-1
binds to only a small proportion of predicted binding sites
Genome Biology 2009, 10:R113
/>
Genome Biology 2009,
under hypoxic conditions [2,4], although the basis for selectivity is incompletely understood.
The binding of certain transcription factors to chromatin can
be modulated by DNA methylation - for example, Myc and
CREB binding is precluded by methylation of their cognate
DNA binding sites [9,10]. Previous studies have demonstrated that HIF-1 binding to the 3' enhancer of the erythropoietin (EPO) gene is also modulated by methylation of the
hypoxia response element within the enhancer [11,12].
Expression of EPO is restricted to cell types in which the
hypoxia response element is unmethylated. Furthermore,
expression of the HIF-1 target BNIP3 is selectively silenced by
histone deacetylation and methylation in colorectal cancer
[13]. Together, these single-locus studies suggest that epigenetic modifications may, in part, modulate the binding of
HIF-1 to chromatin and subsequent gene transactivation.
Gene expression profiling studies have revealed thousands of
genes whose expression changes with hypoxia, with vast differences between cell types in the specific genes induced [1421]. In previous studies we used chromatin immunoprecipitation (ChIP) coupled with analysis on tiled microarrays (ChIPchip) to identify HIF-1 binding sites across the human
genome in HepG2 cells [2]. When coupled with gene expression profiling, our studies revealed hundreds of primary targets of HIF-1 transactivation in this cell type. To more broadly
understand the basis for the selectivity of HIF-1 binding and
cell-type-specific differences in response to hypoxia, in the
current study we assessed HIF-1 binding in a second cell type,
U87 glioma cells, and assessed the epigenetic landscape
across the genome of these two cell types. We integrated these
results with gene expression profiles to elucidate the determinants of HIF-1 binding, transactivation, and cell type specificity.
Results
HIF-1 binds to transcriptionally active genes
The subsets of genes induced by hypoxia vary greatly amongst
different cell types. Some of these differences may be due to
variations in culture conditions, length of exposure to
hypoxia, degree of hypoxia, and microarray platforms. However, even after standardizing all of these variables, we verified by gene expression profiling that most hypoxia-induced
changes in mRNA expression were cell type specific (Figure
1a). When comparing the genes induced or repressed by
hypoxia in HepG2 hepatoma cells, U87 glioma cells and
MDA-MB231 breast cancer cells, only a minority of all genes
were concordantly up- or down-regulated across all three cell
types (Figure 1a).
Volume 10, Issue 10, Article R113
Xia and Kung R113.2
(Figure 1a) under hypoxia resulted from differential HIF-1
binding, we used ChIP-chip to identify HIF-1 binding sites in
U87 glioma cells. Since a majority of HIF-1 binding sites in
HepG2 cells were within promoter regions [2], we analyzed
U87 HIF-1 ChIP samples on tiled arrays covering approximately 10 kb surrounding the transcriptional start sites (TSS)
of all known genes. We used the Model-based Analysis of Tiling-array (MAT) algorithm [22] to identify HIF-1 binding
sites comparing triplicate hypoxic (0.5% O2, 4 h) to triplicate
normoxic samples. Peaks of probe intensity were morphologically similar comparing previous whole genome (HepG2)
data to the current promoter array (U87) data (Figure 1b). To
ensure specificity, we used a stringent cutoff (P-value < 1 × 10⁸) above which all loci checked by quantitative PCR (qPCR)
were true positives (Figure 1c). With this cutoff, 387 binding
loci were identified as HIF-1 binding sites in U87 cells (Additional data file 1). We used gene set enrichment analysis
(GSEA) [23] to determine whether HIF-1 binding was associated with altered gene expression under conditions of
hypoxia. Similar to what we found for HepG2 cells [2], HIF-1
bound genes were highly associated with up-regulated gene
expression under hypoxic conditions (nominal P-value and
false discovery rate q-value < 0.001; Additional data file 2).
To enable comparison between the two cell types and to
ensure specificity, the same stringent cutoff was applied to
HIF-1 binding sites previously identified in HepG2 cells [2].
Furthermore, HIF-1 binding sites in the HepG2 dataset were
restricted to those that mapped to probes represented on the
promoter arrays used in this study. Among 201 HepG2 HIF-1
binding sites that were above this cutoff, 117 were in regions
represented on the promoter arrays.
When we integrated sites of HIF-1 binding (after 4 h of
hypoxia) with gene expression profiles over a time course of
hypoxia (0, 4, 8 and 12 h of hypoxia), we noted that loci that
were bound by HIF-1 were biased towards genes that were
already active prior to induction of hypoxia. Under normal
growth conditions (t = 0 h), there were roughly equal numbers of genes with and without basal mRNA production
('present' and 'absent' MAS5 calls) in each cell type (Figure 1d,
'All'). However, most genes bound by HIF-1 (82% and 88%)
in each cell type had present calls prior to the onset of hypoxia
(Figure 1d, 'HIF1-bound'). Consistent with this, the basal
expression levels of all genes had a bimodal distribution in
both cell types (Figure 1e, 'All'), but the distribution of genes
bound by HIF-1 was significantly skewed towards higher levels of basal expression (Figure 1e, 'HIF1-bound'). Together,
these results demonstrate that when HIF-1 is acutely stabilized by hypoxia (4 h), there is a striking bias for its binding to
loci that were already transcriptionally active under normal
growth conditions (prior to onset of hypoxia).
To better understand HIF-1 binding and transactivation, we
previously identified HIF-1 binding sites across the human
genome in HepG2 cells by ChIP-chip [2]. To determine if
some of the cell-type specific responses in gene expression
Genome Biology 2009, 10:R113
/>
U87
1027
766
209
475
205 147
967
97
HepG2
301
1285
246
MB231
276
146
HepG2
351
MB231
GAPDH
MLL5
PPME1
(d)
1000.0
p=1.1e-41
100%
20
47
8406
75%
p=4.6e-12
7179
100.0
50%
10.0
25%
0%
MAT+ (p < 1e-8)
0.1
All
HIF1bound
All
5kbUP
EFNA1
10kbUP
PPME1
PEX3
NARF
1NHA
RUNX1
CP
UXT
P4HB
ENO1
DDIT4
HSPA9
STAMBP
AK2
ALDOA
GAPDH
MLL5
VEGFA
JMJD1A
1.0
PFKFB4
ChIP-qPCR fold enrichment
CP
U87
MAT-
HepG2
Present
(e)
0.15
All
15
0.00
0.1
0.04
0.2
0.08
0.3
All
HIF1-bound
0.0
0.00
10
Density
0.10
0.05
0.20
0.10
0.00
Density
0.30
All
HIF1-bound
5
Absent
HepG2
HepG2
U87
mRNA
0
(log2 scale)
HIF1bound
mRNA
0
5
10
All
HIF1bound
HIF1bound
p<2.2e-16
p=2.1e-15
Figure 1 (see legend on next page)
Genome Biology 2009, 10:R113
0.12
(c)
(b)
Down at 12h
U87
Xia and Kung R113.3
U87
Up at 12h
Volume 10, Issue 10, Article R113
HepG2
(a)
Genome Biology 2009,
15
/>
Genome Biology 2009,
Volume 10, Issue 10, Article R113
Xia and Kung R113.4
Figure 1 (see previous page)
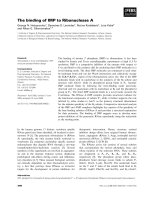
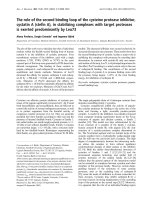
HIF-1 preferentially binds to promoters of transcriptionally active genes
HIF-1 preferentially binds to promoters of transcriptionally active genes. (a) Proportional Venn diagrams of genes with mRNA expression significantly (Pvalue < 0.01) up- or down-regulated after 12 h of hypoxia in U87, HepG2, and MDA-MB231 cells. (b) Results of HIF-1 ChIP-chip analysis on promoter
arrays (U87) was highly similar to analysis on whole genome arrays (HepG2). Representative Integrated Genome Browser tracks are shown with the same
scale for both cell types. (c) ChIP-quantitative PCR validation of U87 HIF-1 ChIP hits. Data expressed as fold enrichment relative to input (mean ±
standard deviation of independent replicates). An increase of more than two-fold (red dashed line) was considered positive for HIF-1 binding. 10 kbUP and
5 kbUP are negative control regions. (d) Approximately half of all genes in the genome are expressed (Present MAS5 call) and half are not expressed
(Absent MAS5 call) under normal growth conditions (All) in both cell lines. Upon stabilization by hypoxia, HIF-1 preferentially binds (HIF1-bound) to the
promoter of genes that are present under normal growth conditions. Statistical significance determined by Fisher exact test. (e) Genes bound by HIF-1 in
U87 or HepG2 cells (HIF1-bound) have higher levels of basal mRNA expression than the normal distribution of all genes (All). Top panel: density plots of
genes at indicated mRNA levels. Bottom panel: box plot of all genes (All) compared to genes bound by HIF-1 (HIF1-bound). Statistical significance
determined by Student's t-test. For box plots, the median is indicated by a dark bar, the box bounds the lower and upper quartiles, the whiskers define the
data range, and the notches represent the 95% confidence interval.
HIF-1 preferentially binds to transcriptionally active
loci
Since histone H3 trimethyl-lysine 4 (H3K4 me3) modification and the presence of RNA polymerase II (RNA Pol II) are
associated with active promoters [24,25], we used ChIP-chip
to assess H3K4 me3 modifications and RNA Pol II occupancy
in promoter regions in both normoxic U87 and HepG2 cells
and compared their distribution with that of the HIF-1 binding sites. We identified 7,536 non-repeat binding regions for
H3K4 me3 and 7,513 for RNA Pol II in U87 cells. For HepG2
cells, 10,082 non-repeat binding regions were identified for
H3K4 me3 and 7,333 for RNA Pol II. Consistent with previous
findings [26], in both cell types genes with mRNA production
(present MAS5 call) were strongly associated with the presence of H3K4 me3 and RNA Pol II, whereas genes without
mRNA production (absent MAS5 call) had a counter-relationship with these marks (Figure 2a). On a gene-specific
level, the amount of H3K4 me3 modification and RNA Pol II
binding were strongly correlated with the level of mRNA
expression from the locus (Figure 2b; Additional data file 3).
The promoters bound by HIF-1 (after 4 h of hypoxia) were
characterized by H3K4 me3 and RNA Pol II occupancy under
normal growth conditions prior to the onset of hypoxia (Additional data file 3). In both U87 and HepG2 cells, almost all
promoters bound by HIF-1 (95.0% for U87 and 94.6% for
HepG2) were positive for either H3K4 me3 or RNA Pol II
under basal conditions (Figure 2c, 'HIF1-bound'), which is
significantly skewed in comparison to the normal distribution
of all genes (Figure 2c, 'All'). The distribution of HIF-1 and
RNA Pol II binding sites were nearly identical, centered just
before the TSS (Figure 2d). In contrast, the distribution of
H3K4 me3 had a small dip at the TSS, consistent with prior
observations that activated promoters are characterized by
nucleasome-poor regions around the TSS [27,28].
In the minority of cases where HIF-1 bound to a gene with an
absent call, we usually found H3K4 me3 and/or RNA Pol II
present in the promoter despite the absent call (38 out 47 for
U87, 18 out 20 for HepG2). This is consistent with previous
reports that, in both embryonic stem cells and differentiated
cells, many genes show signs of transcriptional initiation (for
example, positive RNA Pol II) but produce no full length transcripts (for example, absent call) [29]. These genes are
thought to be poised for activation and inducible genes that
can respond rapidly upon particular stimulation. Only a small
minority (approximately 2%) of the HIF-1 bound genes (9 out
of 404 for U87 and 2 out of 111 for HepG2) had no evidence of
activation (no H3K4 me3 modification, no RNA Pol II occupancy, and an Absent call).
Together, these data indicate that, in both cell types, HIF-1
preferentially binds to loci that were already transcriptionally
active under normal growth conditions as indicated by the
presence of RNA Pol II, H3K4 me3 modification, and basal
mRNA production.
Cell-type specific differences in HIF-1 binding
Since HIF-1 preferentially binds to transcriptionally active
loci, we wondered whether cell-type-specific differences in
gene expression might underlie differences in HIF-1 binding.
We first compared HIF-1 binding between U87 and HepG2
cells. For HepG2 HIF-1 sites that were represented on promoter arrays, more than half (72 out of 117) were bound by
HIF-1 at the identical site in both cell lines under stringent
conditions (Additional data file 4). Only 24 sites bound by
HIF-1 in HepG2 cells had no evidence of HIF-1 binding in
U87 cells at any stringency, and these were considered
HepG2-unique binding sites.
The sites that were similarly bound by HIF-1 in both cell lines
were characterized by H3K4 me3 and RNA Pol II occupancy
in both cell lines (for example, DDIT4; Figure 3a). In the case
of loci in which HIF-1 binding was discordant between the
two cell lines, H3K4 me3 and RNA Pol II occupancy usually
predict the binding of HIF-1. Sites that were bound by HIF-1
only in HepG2 cells were characterized by the presence of
RNA Pol II and H3K4 me3 modification in HepG2 but not
U87 cells (for example, EFNA1; Figure 3b). The converse pattern was also observed for HIF-1 binding sites specific to U87
cells (for example, BHLHB3; Figure 3c). In addition, among
previously well-characterized HIF-1 bound loci [3] in which
we did not observe HIF-1 binding in either cell line, H3K4
me3 and RNA Pol II were generally absent in the basal state
Genome Biology 2009, 10:R113
/>
RNA Polll
3
2
1
Absent
mRNA:
high
medium
low
absent
0
H3K4me3
Present
Xia and Kung R113.5
-1
H3K4me3
Volume 10, Issue 10, Article R113
4
(b)
U87
H3K4me3-MATscore
(a)
Genome Biology 2009,
RNA Polll
-2000
0
2000
4000
-2000
0
2000
4000
Absent
Present
RNA Polll
6
4
H3K4me3
H3K4me3
mRNA:
high
medium
low
absent
2
HepG2
0
RNA Polll-MATscore
8
-4000
RNA Polll
-4000
Distance to TSS (bp)
(c)
H3K4me3/RNA PolII
!"#"$%&'()$
(d)
!"#"*%+'(,-
100%
ChIP-chip MATscore
8
75%
50%
25%
RNA polII
H3K4me3
HIF-1
6
4
2
0
0%
All
HIF1bound
U87
All
HIF1bound
HepG2
-4000
-2000
0
2000
4000
Distance to TSS (bp)
H3K4me3/RNA polII H3K4me3/RNA polII +
Figure 2
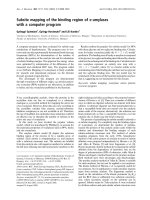
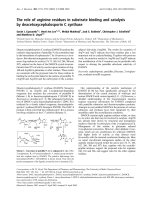
Determinants of HIF-1 binding
Determinants of HIF-1 binding. (a) H3K4 me3 modification and RNA Pol II binding at promoters are highly correlated with basal mRNA expression
(present call). Proportional Venn diagrams of H3K4 me3 mark, RNA Pol II binding, and present calls in normal growth conditions in U87 and HepG2 cells.
(b) mRNA expression levels are positively correlated with both H3K4 me3 and RNA Pol II binding intensities. All genes were separated into groups based
on mRNA expression levels. Probe level intensities for H3K4 me3 and RNA Pol II were plotted as the aggregated mean of all genes in each group relative
to the TSS. (c) Approximately half of all genes are marked with H3K4 me3 or the presence of RNA Pol II under normal growth conditions (All). Nearly all
loci bound by HIF-1 (HIF1-bound) are marked by H3K4 me3 or RNA Pol II. Statistical significance determined by Fisher exact test. (d) Aggregate probe
level intensities for H3K4 me3 (red), RNA Pol II (purple), and HIF-1 (blue) for all HIF-1 bound promoters are plotted relative to the TSS.
Genome Biology 2009, 10:R113
/>
(a)
Genome Biology 2009,
Volume 10, Issue 10, Article R113
(c)
Common hits
Xia and Kung R113.6
U87-unique hits
U87
HIF-1
RNA Pol II
H3K4me3
HepG2
H3K27me3
HIF-1
RNA Pol II
H3K4me3
H3K27me3
DDIT4
(b)
HIG2
ALDOA
BHLHB3
(d)
HepG2-unique hits
TSPAN5
ADAMTS9
Unbound HIF-1 targets
U87
HIF-1
RNA Pol II
H3K4me3
HepG2
H3K27me3
HIF-1
RNA Pol II
H3K4me3
H3K27me3
EFNA1
(e)
HNF1B
SLC30A10
ITGB2
CXCR4
CXCL12
(f)
U87-bound
p=1.3e-05
ChIP-qPCR fold enrichment
U87-unbound
U87-bound
p=2.1e-10
U87-unbound
U87-bound
p=3.9e-07
U87-unbound
Figure 3 (see legend on next page)
Genome Biology 2009, 10:R113
/>
Genome Biology 2009,
Volume 10, Issue 10, Article R113
Xia and Kung R113.7
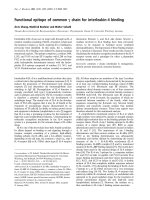
Figure 3 (see previous expression predicts HIF-1 binding
Cell-type specific gene page)
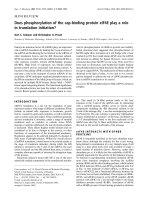
Cell-type specific gene expression predicts HIF-1 binding. For the indicated genes, IGB tracks for HIF-1, RNA Pol II, H3K4 me3 and H3K27 me3 are shown
with identical scales between cell types. Representative data are shown for (a) HIF-1 hits common to both cell types, (b) HIF-1 ChIP hits unique to
HepG2 or (c) U87 cells, and (d) HIF-1 binding sites reported in the literature but not bound in either cell type. (e) ChIP-qPCR analysis of HIF-1, H3K4
me3, RNA Pol II, and H3K27 me3 at the indicated loci. For HIF-1, H3K4 me3, and RNA Pol II ChIP, results are normalized to negative control regions
located 5 kb and 10 kb upstream of the vascular endothelial growth factor (VEGF) gene. For H3K27 me3 ChIP, results are normalized to the promoter
regions of the glyceraldehyde 3-phosphate dehydrogenase (GAPDH) and aldolase A (ALDOA) genes. Data expressed as mean ± SD of independent
replicates. (f) A set of well-validated HIF-1 target genes were partitioned based on whether HIF-1 binding was observed (U87-bound) or absent (U87unbound) in U87 cells. Binding of HIF-1 is highly correlated with H3K4 me3 modification, RNA Pol II occupancy, and basal mRNA production. Statistical
significance was determined by Student's t-test. For box plots, the median is indicated by a dark bar, the box bounds the lower and upper quartiles, the
whiskers define the data range, and the notches represent the 95% confidence interval.
(Figure 3d). Although we also performed ChIP-chip analysis
of the repressive histone H3 trimethyl-lysine 27 (H3K27 me3)
modification, the signal enrichment above input on the arrays
was too weak for us to feel confident that we had captured a
sensitive representation of this epigenetic mark. Nevertheless, at loci where the H3K27 me3 signal was positive, there
was usually an inverse relationship with RNA Pol II occupancy, H3K4 me3 modification and HIF-1 binding (for example, EFNA1 and BHLHB3; Figure 3b, c). These results were
verified at representative loci using ChIP-qPCR (Figure 3e),
and in all cases ChIP-qPCR results were concordant with the
ChIP-chip results.
To further analyze cell-type-specific binding, we next examined a set of 124 previously well-validated HIF-1 bound sites
composed of both high confidence binding sites found in
HepG2 cells [2] and well validated HIF-1 targets identified in
other cell types [3]. For this set of known HIF-1 binding sites,
77 loci were bound by HIF-1 in U87 cells, whereas 47 loci did
not have HIF-1 binding. Loci in which HIF-1 binding was
observed were characterized by high H3K4 me3, the presence
of RNA Pol II, and higher basal mRNA production by comparison to loci in which HIF-1 binding was not observed (Figure
3f). Together, these data demonstrate that although HIF-1 is
similarly stabilized in these two cell lines, the patterns of
binding only partially overlap, and that cell-type-specific differences in the epigenetic landscape and basal gene expression underlie cell-type-specific differences in HIF-1 binding.
Basal expression status determines response to
hypoxia
Although thousands of genes have altered expression under
hypoxia (Figure 1a), we have only identified a few hundred
direct HIF-1 targets. Therefore, a large proportion of hypoxiainduced transcriptional changes are mediated through secondary mechanisms (for example, transcription factors activated by HIF-1) or HIF-1-independent pathways. We
hypothesized that the finding that HIF-1 binds to transcriptionally active loci upon activation may be generalized to
many or most other transcription factors. As such, we predicted that genes that have altered expression under hypoxia
(inclusive of primary HIF targets, secondary targets, and
HIF-independent genes) would be those that were already
transcriptionally active under normal growth conditions.
Indeed, when genes were partitioned as absent or present by
MAS5 call under basal growth conditions, it was clear that the
absent genes very rarely changed upon hypoxia compared to
the present genes (Figure 4a). For example, in U87 cells the
expression of 35% of all genes that were present under normoxic conditions (t = 0 h) were either up- or down- regulated
after 12 h of hypoxia treatment. However, <2% of all absent
genes had expression changes upon induction of hypoxia
(Figure 4a).
As noted above, in some cases genes can be in a transcriptionally permissive state with H3K4 me3 modification and/or
RNA Pol II occupancy on the promoter, but without being
actively transcribed (absent MAS5 call). To further investigate the underlying mechanism for selective gene response
upon hypoxia, we partitioned all genes into 'permissive' or
'non-permissive' groups. The permissive group contained
genes with H3K4 me3 modification, RNA Pol II occupancy, or
transcribed mRNA (present MAS5 call). In contrast, the 'nonpermissive' group contained genes that were negative for
H3K4 me3, RNA Pol II, and mRNA production. Upon
hypoxia, >95% of all up-regulated genes and >99% of all
down-regulated genes in both U87 and HepG2 cells were permissive before the onset of hypoxia (Figure 4b). The rapidity
and magnitude of changes in expression were also far more
dramatic in permissive genes compared to non-permissive
genes (Figure 4c). These results support the notion that, upon
hypoxia, HIF-1 and other transcription factors are biased
towards binding to and transactivating (and transrepressing)
loci that are already active under normal growth conditions.
When comparing the gene expression profiles of the three cell
lines, we found that genes with present expression under
basal conditions largely overlapped (Figure 5a, 'Present in
normoxia'). For the minority genes that were uniquely
expressed in one cell line but not the other two, there was
absolutely no overlap in their response to the onset of hypoxia
(Figure 5a, 'Up-regulated in hypoxia'). Together, these results
suggest that cell-type-specific gene expression profiles dictate
the subset of genes that are permissive for regulation by stimulus-responsive transcription factors such as HIF-1 (Figure
5b). In the case of hypoxia-responsive genes, this concept
applies not only to HIF-1 (Figures 1, 2 and 3), but also to sec-
Genome Biology 2009, 10:R113
/>
Genome Biology 2009,
(a)
Volume 10, Issue 10, Article R113
Xia and Kung R113.8
(b)
Hypoxia 12h vs 0h
4hr
(c)
Nonpermissive
Permissive
Nonpermissive
mRNA level log2 change (hypoxia/normoxia)
HepG2
U87
Permissive
12hr
Figure 4
Basal expression level predicts hypoxia-inducibility
Basal expression level predicts hypoxia-inducibility. (a) Genes were divided based on their MAS5 present/absent calls under normoxic conditions (0 h). In
both cell types, most genes whose expression was up- (gray) or down-regulated (black) by hypoxia were already expressed under basal conditions
(Present). (b) Approximately 60% of all genes are permissive (H3K4 me3+, RNA Pol II+, or MAS5 present) under normal growth conditions (All,
normoxia). Most genes for which mRNA levels were significantly up- or down-regulated upon hypoxia were permissive under normoxia. Statistical
significance was determined by Fisher exact test, and was P-value <1e-150 for all pairwise comparisons. (c) For both cell types, genes were partitioned as
either permissive or non-permissive under normal growth conditions (t = 0 h). Changes in mRNA levels (log2 scale) after 4 h and 12 h of hypoxia
treatment are plotted, with non-significant changes (P-value > 0.01) represented as 0.
Genome Biology 2009, 10:R113
/>
(a)
Genome Biology 2009,
Present in
normoxia (t=0h)
(b)
Xia and Kung R113.9
Up-regulated in
hypoxia (t=12h)
U87
U87
HepG2
Volume 10, Issue 10, Article R113
MB231
HepG2
MB231
Permissive promoters are accessible to HIF-1
Non-permissive promoters are inaccessible to HIF-1
Figure 5
Basal gene expression predicts HIF-1 binding
Basal gene expression predicts HIF-1 binding. (a) Proportional Venn diagram of genes with MAS5 present calls under normoxic conditions. Genes with
basal mRNA production are largely overlapping among U87, HepG2, and MDA-MB231 cells (left panel). For the minority genes that were uniquely present
in one cell line but not the other two, there was no overlap in their response to the onset of hypoxia (right panel). (b) Our results suggest that the
repertoire of genes active in a cell (for example, through lineage specific transcription factors) defines the subset of genes that are permissive for binding
and transactivation by stimulus-responsive transcription factors such as HIF-1. In this way, cell-type-specific differences in response to the same stimulus
result, at least in part, from differences in basal gene expression profiles. Upon hypoxia, HIF-1 preferentially binds to active (permissive) loci, as indicated
by the presence of H3K4 me3, RNA Pol II, or active mRNA production.
ondary and HIF-independent modulators of gene expression
(Figures 4 and 5).
Discussion
We demonstrate here that when cells are acutely exposed to
hypoxia, newly stabilized HIF-1 preferentially binds to loci
that are already transcriptionally active under normal growth
conditions, as indicated by the presence of RNA Pol II, H3K4
me3 modification, and basal mRNA production. This is similar to the findings for Myc, which preferentially binds to sites
with H3K4 and H3K79 methylation and histone H3 acetylation [30,31]. Although Myc and HIF-1 binding to DNA can be
precluded by methylation of their cognate DNA binding
Genome Biology 2009, 10:R113
/>
Genome Biology 2009,
sequences [10,12,13,32], it has been shown that the presence
of CpG methylation can only account for a minority of Myc
binding exclusion and that Myc binding has a stronger
dependence on H3K4 me3 [30].
It is likely that preferential binding to transcriptionally active
loci is not specific to HIF-1 and Myc, but rather is generalizable to a variety of acutely activated transcription factors. For
example, CREB binding is highly tissue-specific, and binding
is apparent at genes that are transcriptionally active but not
at promoters of genes that are not expressed [33]. Therefore,
the panoply of epigenetic modifications that signify 'permissiveness' for binding is incompletely understood, but theses
studies all support a model in which acutely activated transcription factors preferentially bind to loci that are already
transcriptionally active. Of note, since normoxic cells have
low levels of HIF-1, it is possible that low levels of HIF-1 binding actually help maintain the permissive state of certain high
affinity sites under normoxic conditions. Furthermore,
hypoxia under physiological or pathophysiological conditions
can be acute, chronic or episodic. It is likely that with prolonged hypoxia, additional binding sites - for example, lower
affinity biding sites - become occupied by HIF-1.
Comparing two different cell types, U87 and HepG2 cells,
concordant HIF-1 binding was observed at many loci. Where
binding was found to be discordant, in most cases there were
differences in the epigenetic marking and basal transcriptional activity of the locus. These results suggest that the basal
gene expression profile of cells may dictate the subset of loci
to which stimuli-responsive transcription factors can bind.
This concept is supported by a genome-wide analysis of
FoxA1 binding in which cell-type-specific H3K4 me2 modification of enhancers predicted binding of FoxA1 [8]. Also,
STAT1 has been found to preferentially bind to H3K4 me1modified enhancers, thereby determining cell-type-specific
differences in target gene responsiveness to interferon-γ
treatment [34]. Together, these results suggest that the repertoire of genes active in a cell (for example, through lineagespecific transcription factors) defines the subset of genes that
are permissive for binding and transactivation by stimulusresponsive transcription factors. In this way, cell-type-specific differences in response to the same stimulus results, at
least in part, from differences in basal gene expression profiles.
Conclusions
Many transcription factors are acutely activated in a stimulus-responsive manner. Although the canonical binding
sequence is the same in all cells, there are often vast differences between different cell types in the loci bound by the
same transcription factor. With acute activation of HIF-1, we
have found that the transcription factor preferentially binds
to loci that are already transcriptionally active under basal
growth conditions. In two different cell lines, almost all HIF-
Volume 10, Issue 10, Article R113
Xia and Kung R113.10
1 binding sites are characterized by the presence of RNA Pol
II, histone H3 methylation at lysine 4, or basal mRNA production. In the two cell lines, differences in basal transcriptional activity predicted differences in HIF-1 binding. These
data, along with existing studies for Myc, STAT1, CREB and
FoxA1, suggest that when transcription factors are acutely
activated, they initially bind to loci that are already active.
Therefore, differences in basal gene expression (for example,
through lineage specific transcription factors) may largely
dictate the subset of genes available for binding by stimulusresponsive factors, and may be the basis for cell type specificity in the pattern of binding by many transcription factors.
Materials and methods
Chromatin immunoprecipitation
ChIPs were performed as previously described [2,5] with
minor modifications. Briefly, U87 cells were cultured for 4 h
under normoxic or hypoxic (0.5% O2) conditions. Cells were
fixed with 1% formaldehyde (37°C, 10 minutes) and lysed
with 0.5% SDS lysis buffer. Chromatin was then sonicated to
500- to 1,000-bp fragments and immunoprecipitation carried out with HIF-1α pAb (NB 100-134 - Novus Biologicals,
Littleton, CO, USA). RNA Pol II, H3K4 me3, and H3K27 me3
ChIPs were carried out using normoxic U87 or HepG2 cell
samples with RNA Pol II mAb (ab5408 - Abcam, Cambridge,
MA, USA), H3K4 me3 pAb (ab8580 - Abcam), and H3K27
me3 pAb (07-449 - Millipore, Billerica, MA, USA). DNA
amplification, fragmentation, labeling, and hybridization
were performed as previously described [5]. All ChIP samples
were hybridized onto Affymetrix Human Promoter Tiling
Array 1.0R.
Identification of ChIP hits
The MAT algorithm [22] was used to identify regions
enriched by ChIP-chip (ChIP hits). For the U87 HIF-1 ChIP,
the triplicate hypoxic U87 HIF-1 ChIP samples were compared directly to triplicate normoxic samples. MAT was run
with the parameters: bandwidth = 200, maximum gap = 400,
minimum probes = 10, and P-value cutoff = 1 × 10⁻⁵. For
H3K4 me3, H3K27 me3, and RNA Pol II ChIPs, normoxic
ChIP samples were compared to matched input samples; the
MAT parameters were increased to account for broader peaks
(bandwidth = 500, maximum gap = 400, minimum probes =
20, and P-value cutoff = 1 × 10⁻⁵). The MAT library and mapping files were based on the March 2006 Human Genome
Assembly (HG18). Hits flagged by MAT as mapping to repeat
regions were excluded from consideration in all cases.
Quantitative real-time PCR validation of ChIP hits
Primers were designed to span the peak intensity for each
region of interest and against two negative control regions.
For HIF-1, H3K4 me3, and RNA Pol II ChIPs, 5 kb and 10 kb
upstream of the vascular endothelial growth factor (VEGF)
gene were used as negative control regions. For H3K27 me3
ChIPs, promoter regions of the glyceraldehyde 3-phosphate
Genome Biology 2009, 10:R113
/>
Genome Biology 2009,
Volume 10, Issue 10, Article R113
dehydrogenase (GAPDH) and aldolase A (ALDOA) genes
were used as negative control regions. Fold enrichment was
assessed by performing qPCR for the target region on samples
taken before (Input) and after ChIP (ChIP) and calculated
from the critical threshold cycles (Ct) as: Fold enrichment =
Target region ratio [2ΔCt(Ct ChIP-Ct Input)]/Control region ratio
[2ΔCt(Ct ChIP-Ct Input)]. Specific binding was defined as a greater
than twofold enrichment compared to matched control samples.
Abbreviations
Expression microarray
Xia and Kung R113.11
Authors' contributions
HepG2 hepatoma, U87 glioma, and MDA-MB231 breast cancer cells were collected under normoxic conditions (approximately 19% O2, 0 h) and after 4, 8 and 12 h of hypoxia
treatment (0.5% O2). For each cell line, three replicates of
total RNA at each time point were prepared using Trizol and
submitted to the DFCI Microarray Core for labeling, hybridization to Affymetrix HG-U133Plus2 oligonucleotide arrays
and image scanning. We used GcRMA module on Bioconductor with an updated custom CDF file [35] to normalize the
microarrays. The MAS5 algorithm was used to make present/
absent calls. LIMMA was used to identify probe sets whose
expression levels were significantly changed after 4, 8, or 12 h
of hypoxia relative to the normoxic signal. The MAS5
present/absent calls were assigned values of absent = 0, marginal = 0.5, or present = 1. For each probe set, the sum of triplicate samples was partitioned into 'present' if sum ≥ 2, and
'absent' if sum <2.
ChIP: chromatin immunoprecipitation; ChIP-chip: ChIP coupled with analysis on tiled microarrays; GSEA: gene set
enrichment analysis; H3K4 me3: histone H3 trimethyl-lysine
4; H3K27 me3: histone H3 trimethyl-lysine 27; HIF-1:
Hypoxia-inducible factor-1; MAT: Model-based Analysis of
Tiling-array; qPCR: quantitative PCR; RNA Pol II: RNA
polymerase II; TSS: transcriptional start site.
XX and ALK designed the experiments. XX performed the
experiments and analyzed the data. XX and ALK wrote the
paper.
Additional data files
The following additional data are available with the online
version of this paper: a table listing all HIF-1 bound regions
identified by ChIP-chip in U87 cells (Additional data file 1);
GSEA analysis of HIF-1 binding and hypoxia-induced gene
expression (Additional data file 2); HIF-1 binding associations with RNA Pol II and H3K4 me3 (Additional data file 3);
a table listing all common HIF-1-bound loci identified by
ChIP-chip in U87 cells and HepG2 cells (Additional data file
4).
andHIF-1 cells. 3
HIF-1
sion. binding of 2
sion HepG2data
GSEA analysis associations with RNA ChIP-chip H3K4 me3.
Click herebound HIF-1 identified by Pol IIChIP-chip incells cells
All commoncellsfile 1
Additionalfor fileregionsbinding and hypoxia-induced gene expresHIF-1-bound loci identified by and in U87 cells.
4
me3
U87
Acknowledgements
Gene set enrichment analysis
We created gene sets containing all genes that could be associated with a ChIP hit. These sets were added to a file of gene
sets (c5.mf.v2.5.symbols.gmt) downloaded from the GSEA
website at the Broad Institute [36]. We used the command
line version of GSEA2.0 with gene set permutation to derive
significance, signal-to-noise as the distance metric and maximum expression to collapse probe sets to genes.
Linking ChIP hits to RefSeq genes and expression
profile
ChIP hits were associated with RefSeq genes from the University of California Santa Cruz (UCSC) RefGene table for HG18
based on chromosomal position. For analyzing the relationship between H3K4 me3, RNA Pol II and HIF-1 binding, only
hits for which the binding peaks are ± 5 kb from the TSS of a
gene were associated with the gene in order to minimize
ambiguous assignment.
This work was supported by the American Cancer Society and the National
Institutes of Health (ALK).
References
1.
2.
3.
4.
5.
6.
7.
Data access
The raw data are available from the NCBI Gene Expresion
Omnibus database with accession number [GEO:GSE16347]
for HepG2 HIF-1α ChIP-chip data and [GEO:GSE18505] for
all other microarray and ChIP-chip data.
8.
9.
Semenza GL: Targeting HIF-1 for cancer therapy. Nat Rev Cancer 2003, 3:721-732.
Xia X, Lemieux ME, Li W, Carroll JS, Brown M, Liu XS, Kung AL:
Integrative analysis of HIF binding and transactivation
reveals its role in maintaining histone methylation homeostasis. Proc Natl Acad Sci USA 2009, 106:4260-4265.
Wenger RH, Stiehl DP, Camenisch G: Integration of oxygen signaling at the consensus HRE. Sci STKE 2005, 2005:re12.
Mole DR, Blancher C, Copley RR, Pollard PJ, Gleadle JM, Ragoussis J,
Ratcliffe PJ: Genome-wide association of HIF-1alpha and HIF2alpha DNA-binding with expression profiling of hypoxia
inducible transcripts. J Biol Chem 2009, 284:16767-16775.
Carroll JS, Liu XS, Brodsky AS, Li W, Meyer CA, Szary AJ, Eeckhoute
J, Shao W, Hestermann EV, Geistlinger TR, Fox EA, Silver PA, Brown
M: Chromosome-wide mapping of estrogen receptor binding
reveals long-range regulation requiring the forkhead protein
FoxA1. Cell 2005, 122:33-43.
Bieda M, Xu X, Singer MA, Green R, Farnham PJ: Unbiased location
analysis of E2F1-binding sites suggests a widespread role for
E2F1 in the human genome. Genome Res 2006, 16:595-605.
Yang A, Zhu Z, Kapranov P, McKeon F, Church GM, Gingeras TR,
Struhl K: Relationships between p63 binding, DNA sequence,
transcription activity, and biological function in human cells.
Mol Cell 2006, 24:593-602.
Lupien M, Eeckhoute J, Meyer CA, Wang Q, Zhang Y, Li W, Carroll
JS, Liu XS, Brown M: FoxA1 translates epigenetic signatures
into enhancer-driven lineage-specific transcription. Cell 2008,
132:958-970.
Iguchi-Ariga SM, Schaffner W: CpG methylation of the cAMPresponsive enhancer/promoter sequence TGACGTCA abolishes specific factor binding as well as transcriptional activa-
Genome Biology 2009, 10:R113
/>
10.
11.
12.
13.
14.
15.
16.
17.
18.
19.
20.
21.
22.
23.
24.
25.
26.
27.
28.
Genome Biology 2009,
tion. Genes Dev 1989, 3:612-619.
Perini G, Diolaiti D, Porro A, Della Valle G: In vivo transcriptional
regulation of N-Myc target genes is controlled by E-box
methylation. Proc Natl Acad Sci USA 2005, 102:12117-12122.
Wenger RH, Kvietikova I, Rolfs A, Camenisch G, Gassmann M: Oxygen-regulated erythropoietin gene expression is dependent
on a CpG methylation-free hypoxia-inducible factor-1 DNAbinding site. Eur J Biochem 1998, 253:771-777.
Rossler J, Stolze I, Frede S, Freitag P, Schweigerer L, Havers W, Fandrey J: Hypoxia-induced erythropoietin expression in human
neuroblastoma requires a methylation free HIF-1 binding
site. J Cell Biochem 2004, 93:153-161.
Bacon AL, Fox S, Turley H, Harris AL: Selective silencing of the
hypoxia-inducible factor 1 target gene BNIP3 by histone
deacetylation and methylation in colorectal cancer. Oncogene
2007, 26:132-141.
Hu CJ, Wang LY, Chodosh LA, Keith B, Simon MC: Differential
roles of hypoxia-inducible factor 1alpha (HIF-1alpha) and
HIF-2alpha in hypoxic gene regulation. Mol Cell Biol 2003,
23:9361-9374.
Vengellur A, Woods BG, Ryan HE, Johnson RS, LaPres JJ: Gene
expression profiling of the hypoxia signaling pathway in
hypoxia-inducible factor 1alpha null mouse embryonic
fibroblasts. Gene Expr 2003, 11:181-197.
Greijer AE, Groep P van der, Kemming D, Shvarts A, Semenza GL,
Meijer GA, Wiel MA van de, Belien JA, van Diest PJ, Wall E van der:
Up-regulation of gene expression by hypoxia is mediated
predominantly by hypoxia-inducible factor 1 (HIF-1). J Pathol
2005, 206:291-304.
Chi JT, Wang Z, Nuyten DS, Rodriguez EH, Schaner ME, Salim A,
Wang Y, Kristensen GB, Helland A, Borresen-Dale AL, Giaccia A,
Longaker MT, Hastie T, Yang GP, Vijver MJ van de, Brown PO: Gene
expression programs in response to hypoxia: cell type specificity and prognostic significance in human cancers. PLoS Med
2006, 3:e47.
Vengellur A, Phillips JM, Hogenesch JB, LaPres JJ: Gene expression
profiling of hypoxia signaling in human hepatocellular carcinoma cells. Physiol Genomics 2005, 22:308-318.
Elvidge GP, Glenny L, Appelhoff RJ, Ratcliffe PJ, Ragoussis J, Gleadle
JM: Concordant regulation of gene expression by hypoxia and
2-oxoglutarate-dependent dioxygenase inhibition: the role
of HIF-1alpha, HIF-2alpha, and other pathways. J Biol Chem
2006, 281:15215-15226.
Katada K, Naito Y, Mizushima K, Takagi T, Handa O, Kokura S,
Ichikawa H, Yoshida N, Matsui H, Yoshikawa T: Gene expression
profiles on hypoxia and reoxygenation in rat gastric epithelial cells: a high-density DNA microarray analysis. Digestion
2006, 73:89-100.
Sung FL, Hui EP, Tao Q, Li H, Tsui NB, Dennis Lo YM, Ma BB, To KF,
Harris AL, Chan AT: Genome-wide expression analysis using
microarray identified complex signaling pathways modulated by hypoxia in nasopharyngeal carcinoma. Cancer Lett
2007, 253:74-88.
Johnson WE, Li W, Meyer CA, Gottardo R, Carroll JS, Brown M, Liu
XS: Model-based analysis of tiling-arrays for ChIP-chip. Proc
Natl Acad Sci USA 2006, 103:12457-12462.
Subramanian A, Tamayo P, Mootha VK, Mukherjee S, Ebert BL, Gillette MA, Paulovich A, Pomeroy SL, Golub TR, Lander ES, Mesirov JP:
Gene set enrichment analysis: a knowledge-based approach
for interpreting genome-wide expression profiles. Proc Natl
Acad Sci USA 2005, 102:15545-15550.
Bernstein BE, Kamal M, Lindblad-Toh K, Bekiranov S, Bailey DK, Huebert DJ, McMahon S, Karlsson EK, Kulbokas EJ, Gingeras TR, Schreiber SL, Lander ES: Genomic maps and comparative analysis
of histone modifications in human and mouse. Cell 2005,
120:169-181.
Kim TH, Barrera LO, Zheng M, Qu C, Singer MA, Richmond TA, Wu
Y, Green RD, Ren B: A high-resolution map of active promoters in the human genome. Nature 2005, 436:876-880.
Barski A, Cuddapah S, Cui K, Roh TY, Schones DE, Wang Z, Wei G,
Chepelev I, Zhao K: High-resolution profiling of histone methylations in the human genome. Cell 2007, 129:823-837.
Yuan GC, Liu YJ, Dion MF, Slack MD, Wu LF, Altschuler SJ, Rando OJ:
Genome-scale identification of nucleosome positions in S.
cerevisiae. Science 2005, 309:626-630.
Ozsolak F, Song JS, Liu XS, Fisher DE: High-throughput mapping
of the chromatin structure of human promoters. Nat Biotechnol 2007, 25:244-248.
29.
30.
31.
32.
33.
34.
35.
36.
Volume 10, Issue 10, Article R113
Xia and Kung R113.12
Guenther MG, Levine SS, Boyer LA, Jaenisch R, Young RA: A chromatin landmark and transcription initiation at most promoters in human cells. Cell 2007, 130:77-88.
Guccione E, Martinato F, Finocchiaro G, Luzi L, Tizzoni L, Dall' Olio
V, Zardo G, Nervi C, Bernard L, Amati B: Myc-binding-site recognition in the human genome is determined by chromatin
context. Nat Cell Biol 2006, 8:764-770.
Kim J, Chu J, Shen X, Wang J, Orkin SH: An extended transcriptional network for pluripotency of embryonic stem cells. Cell
2008, 132:1049-1061.
Prendergast GC, Lawe D, Ziff EB: Association of Myn, the murine
homolog of max, with c-Myc stimulates methylation-sensitive DNA binding and ras cotransformation. Cell 1991,
65:395-407.
Cha-Molstad H, Keller DM, Yochum GS, Impey S, Goodman RH:
Cell-type-specific binding of the transcription factor CREB
to the cAMP-response element. Proc Natl Acad Sci USA 2004,
101:13572-13577.
Heintzman ND, Hon GC, Hawkins RD, Kheradpour P, Stark A, Harp
LF, Ye Z, Lee LK, Stuart RK, Ching CW, Ching KA, AntosiewiczBourget JE, Liu H, Zhang X, Green RD, Lobanenkov VV, Stewart R,
Thomson JA, Crawford GE, Kellis M, Ren B: Histone modifications
at human enhancers reflect global cell-type-specific gene
expression. Nature 2009, 459:108-112.
Dai M, Wang P, Boyd AD, Kostov G, Athey B, Jones EG, Bunney WE,
Myers RM, Speed TP, Akil H, Watson SJ, Meng F: Evolving gene/
transcript definitions significantly alter the interpretation of
GeneChip data. Nucleic Acids Res 2005, 33:e175.
Gene Set Enrichment Analysis (GSEA) at the Broad Institute [ />
Genome Biology 2009, 10:R113