Báo cáo y học: "A blind deconvolution approach to high-resolution mapping of transcription factor binding sites from ChIP-seq data" pps
Bạn đang xem bản rút gọn của tài liệu. Xem và tải ngay bản đầy đủ của tài liệu tại đây (1.3 MB, 12 trang )
BioMed Central
Page 1 of 12
(page number not for citation purposes)
Genome Biology
Open Access
Method
A blind deconvolution approach to high-resolution mapping of
transcription factor binding sites from ChIP-seq data
Desmond S Lun
*
, Ashley Sherrid
†‡
, Brian Weiner
§
, David R Sherman
†¶
and
James E Galagan
§¥
Addresses:
*
Phenomics and Bioinformatics Research Centre, School of Mathematics and Statistics, and Australian Centre for Plant Functional
Genomics, University of South Australia, Mawson Lakes Boulevard, Mawson Lakes, SA 5095, Australia.
†
Seattle Biomedical Research Institute, 307
Westlake Avenue North, Suite 500, Seattle, WA 98109, USA.
‡
Molecular and Cellular Biology Graduate Program, University of Washington, Seattle,
WA 98195, USA.
§
Broad Institute of MIT and Harvard, 7 Cambridge Center, Cambridge, MA 02142, USA.
¶
Department of Global Health,
University of Washington, Seattle, WA 98195, USA.
¥
Department of Biomedical Engineering and Department of Microbiology, Boston University,
44 Cummington Street, Boston, MA 02215, USA.
Correspondence: Desmond S Lun. Email:
© 2009 Lun et al.; licensee Biomed Central Ltd.
This is an open access article distributed under the terms of the Creative Commons Attribution license ( />by/2.0), which permits unrestricted use, distribution, and reproduction in any medium, provided the original work is properly cited.
CSdeconv<p>CSdeconv is a novel method for determining the location of transcription factor binding from ChIP-seq data that discriminates closely-spaced sites.</p>
Abstract
We present CSDeconv, a computational method that determines locations of transcription factor
binding from ChIP-seq data. CSDeconv differs from prior methods in that it uses a blind
deconvolution approach that allows closely-spaced binding sites to be called accurately. We apply
CSDeconv to novel ChIP-seq data for DosR binding in Mycobacterium tuberculosis and to existing
data for GABP in humans and show that it can discriminate binding sites separated by as few as 40
bp.
Background
With the rapidly decreasing cost of DNA sequencing,
chromatin immunoprecipitation (ChIP) followed by
sequencing of the resulting DNA fragments (ChIP-seq) is
fast becoming the most attractive method for the study of
genome-wide protein-DNA interaction, yielding advan-
tages such as lower cost, higher resolution, and a lower
requirement for input material over the principal alterna-
tive, ChIP-chip, which involves hybridization of the
immunoprecipitated fragments to a genomic microarray
[1-3]. But to harness fully the potential of ChIP-seq, anal-
ysis techniques that accurately translate sequencing reads
into reliable calls of the genomic locations of the sites of
protein-DNA interaction are necessary. To date, a number
of such analysis techniques have been developed [2,4-14].
These methods, however, generally do not identify dis-
tinct binding sites lying close together (separated by a dis-
tance on the order of 100 bp or less), instead interpreting
such cases as a single, incorrectly located binding site.
Such cases of closely spaced binding sites arise regularly,
especially in prokaryotic genomes (see, for example,
[15,16]), and an analysis technique capable of making the
correct calls is necessary for the full potential of ChIP-seq
to be realized.
We present CSDeconv, a computational method that
accurately identifies binding sites, including closely
spaced binding sites, from ChIP-seq data. In contrast to
Published: 22 December 2009
Genome Biology 2009, 10:R142 (doi:10.1186/gb-2009-10-12-r142)
Received: 12 September 2009
Revised:
15 November 2009
Accepted: 22 December 2009
The electronic version of this article is the complete one and can be found
online at />Genome Biology 2009, 10:R142 />Page 2 of 12
(page number not for citation purposes)
prior methods that identify binding sites by searching for
enrichment peaks in sequenced reads, we recognize that
peaks cannot be clearly and distinctly resolved when
binding sites are separated by short distances, and we
therefore instead use a blind deconvolution approach in
which we simultaneously estimate the shape of an enrich-
ment peak as well as the location and magnitude of bind-
ing sites. Our work builds on many of the innovations
introduced by Valouev and colleagues [4] to the analysis
of ChIP-seq data in their method QuEST, including using
kernel density estimation [17,18] to estimate the proba-
bility density function associated with the location of
sequencing reads.
To demonstrate the capabilities of CSDeconv, we have
applied it to novel ChIP-seq data for the DosR (dormancy
survival regulator) transcription factor in Mycobacterium
tuberculosis (MTB) and to existing data collected by Val-
ouev and colleagues [4] for the GABP (growth-associated
binding protein) transcription factor in humans. The
DosR dataset is well-suited to CSDeconv because, in com-
parison to most mammalian transcription factors, DosR
binds only to a small number of sites, allowing the sites to
be studied in detail. Moreover, the computational require-
ments of CSDeconv restrict the number of binding sites
that can be analyzed to this scale. Nevertheless, CSDeconv
can be applied to mammalian data, and we demonstrate
this by analyzing GABP binding over a 2-Mbp segment of
human chromosome 19.
In our analysis of DosR binding, we found 24 distinct
binding sites distributed over 18 regions, of which 15
regions are upstream of genes whose hypoxic induction
has been previously shown to be dependent on DosR
[16]. Moreover, our predictions appear spatially accurate
with 23 of the 24 predicted sites located within 50 bp of a
motif closely resembling that previously identified by
Park and co-workers [16]. Notably, four binding sites
occur in two closely spaced pairs, and three occur in a
closely spaced triplet, and it is clear that these sites cannot
be distinguished by using prior peak-calling algorithms.
One of the closely spaced pairs occurs in the promoter
region of the gene acr (Rv2031c), where the centers of the
two distinct sites are separated by only 57 bp. That bind-
ing occurs at both of these sites was previously established
by mobility shift assays [16], and the relative contribu-
tions of the two sites to the induction of acr by DosR
under hypoxia corresponds qualitatively to the relative
binding magnitudes established by our algorithm. In our
analysis of GABP binding on chromosome 19, we found
23 distinct binding sites distributed over 15 regions. Of
the 23 binding sites, 18 are located within 50 bp of a motif
resembling that previously identified [4,19].
Owing to the ability of CSDeconv to call closely spaced
binding sites, it is capable of achieving a greater level of
accuracy, as determined by motif analysis, than do alter-
native methods when calling the same number of binding
sites. We demonstrate this capability by comparing the
performance of CSDeconv with MACS [7] and SISSRs [9],
two publicly available ChIP-seq peak finding methods.
Materials and methods
Density estimation of enriched regions
We divided the genome into N nonoverlapping bins. The
number of bins N was chosen so that the expected
number of reads in each bin, assuming a uniform distri-
bution, would be at least 10. For simplicity, we rounded
bin sizes up to the nearest 100. For the MTB genome, this
resulted in 4,412 nonoverlapping bins, each of length 100
bp, and, for the 2-Mbp segment of human chromosome
19 that we studied, this resulted in 182 nonoverlapping
bins, each of length 1,100 bp.
We took reads from a ChIP library and reads from a con-
trol library and placed them into these bins. We then cal-
culated the log-likelihood ratio (LLR) for independence of
the ChIP distribution from the control distribution for
each bin, which is given by
where n
ChIP
and n
ctrl
are the number of ChIP and control
reads in the bin, respectively, and N
ChIP
and N
ctrl
are the
total number of ChIP and control reads in the entire data-
set, respectively.
We selected those bins with more ChIP reads than control
reads whose LLRs exceeded a certain threshold. For each
selected bin, we added 300 bp on either side to ensure that
the entire enrichment peak is captured, and we call such a
genomic region an enriched region. Adjacent or overlap-
ping enriched regions are combined into a single enriched
region. Let k be the number of enriched regions.
For each enriched region, we applied kernel density esti-
mation with a gaussian kernel. By following the method
of [4], we chose kernel bandwidths empirically to be those
that yielded good performance. We chose a bandwidth of
30 for IP reads and a bandwidth of 300 for control reads.
For enriched region i, we obtain four density functions,
, , , , for the forward and
reverse ChIP reads and the forward and reverse control
reads, respectively. We then compute forward and reverse
LLR
ChIP
ChIP
ctrl
ctrl
ChIP ctrl Ch
=
⎛
⎝
⎜
⎞
⎠
⎟
+
⎛
⎝
⎜
⎞
⎠
⎟
+n
n
N
n
n
N
Nlog log (
IIP ChIP
ctrl ctrl
ChIP ChIP
ChIP
ctrl
−
−
⎛
⎝
⎜
⎞
⎠
⎟
+−
−
n
Nn
N
Nn
N
)log
()log
nn
N
nn
nn
NN
ctrl
ctrl
ChIP ctrl
ChIP ctrl
ChIP ctrl
⎛
⎝
⎜
⎞
⎠
⎟
−+
+
+
⎛
⎝
()log
⎜⎜
⎞
⎠
⎟
−+−−
+− −
()logNNnn
NNnn
N
ChIP ctrl ChIP ctrl
ChIP ctrl ChIP ctrl
CChIP ctrl
+
⎛
⎝
⎜
⎞
⎠
⎟
N
,
g
i
fw ChIP,
()
g
i
rc ChIP,
()
g
i
fw ctrl,
()
g
i
rc ctrl,
()
Genome Biology 2009, 10:R142 />Page 3 of 12
(page number not for citation purposes)
enrichment profiles, sampled at integer position values m,
according to
and
Initial peak shape estimation
We make an initial estimate of the shape of an enrichment
profile as follows. We aim to select a pulse that is strong
(of large amplitude) and narrow, such as to select a pulse
that is observed with low noise and that is likely to arise
from a single binding site. Thus, for each enriched region,
we compute the full width at half maximum (FWHM) and
amplitude of the forward and reverse enrichment profiles
and compute the average FWHM and amplitude for the
region by taking the mean of the forward and reverse val-
ues.
We then take the top quartile of the enriched regions
according to average amplitude and select the enriched
region i* with the smallest average FWHM in this set. In
effect, this selects the narrowest peak from among the
strongest pulses serving as a good initial estimate of a sin-
gle binding site. The enriched region i* thus selected is
used to compute the initial peak shape.
Specifically, we set the discrete function h
0
and the scalar
m
0
according to
where M
i*
is the length of the selected enriched region i*.
The function h
0
is normalized to a maximal amplitude of
unity, and the normalized function describes the initial
peak shape.
Iterative blind deconvolution
We initialize the procedure by setting h := h
0
. Then, for
each enriched region i, we solve
where M
i
is the length of enriched region i, and
α
is a reg-
ularization factor that biases solutions with fewer compo-
nents. The estimates a* and m* are of the amplitudes and
positions of the binding sites, and the estimate N* is of
the number of the components in the enriched regions.
We solve the minimization problem for each i by starting
with N
i
= 1 and solving the minimization over a
i
and m
i
by
random-restart gradient descent (see, for example, [33]).
We then increment N
i
and solve over a
i
and m
i
again, and
we continue in this fashion until the objective increases.
For a given (a*, m*, N*), we reestimate h by assuming that
(a*, m*, N*) are true and estimating the most likely h; that
is, we solve
which can be solved as a constrained linear least-squares
problem, and set h := h*. We repeat this iterative proce-
dure until convergence in h.
DosR ChIP-seq library construction and sequencing
MTB strains H37Rv and H37Rv:ΔdosR were grown to early
log phase and then exposed to 0.2% O
2
for 2 hours, as
described in [22]. The bacilli were fixed by addition of for-
maldehyde, lysed with bead beating (6 × 15 seconds with
cooling on ice between beats), and DNA sheared by soni-
cation. The extract was incubated with anti-DosR antibod-
ies and run over MagnaBind Protein A coated beads
(Thermo Fisher Scientific Inc., Rockford, IL, USA). The
antibody-bound complex was eluted from the beads,
crosslinking was reversed by the addition of SDS and incu-
bation at 65°C, and DNA fragments were purified by
using a QIAquick PCR Purification Kit (QIAGEN Inc.,
Valencia, CA, USA). The DNA was blunted, and adapters
were ligated to each end to facilitate Solexa sequencing.
PCR was then used specifically to enrich for DNA frag-
ments with adapter molecules ligated to both ends. DNA
obtained from H37Rv was used for the ChIP library,
whereas that from H37Rv:ΔdosR was used for the control
library. Sequencing was carried out by using the Illumina/
Solexa Genome Analyzer system, according to the manu-
facturer's specifications. We obtained a total of 8,361,463
reads in the ChIP library, of which 5,748,148 (68.7%)
were aligned (some reads were not aligned, as they were
not considered uniquely alignable), and a total of
9,627,826 reads in the control library, of which 6,041,158
fm
g
i
m
g
i
m
i
fw
fw chIP
fw ctrl
()
[]:
,
()
()
,
()
()
=
fm
g
i
m
g
i
m
i
rc
rc chIP
rc ctrl
()
[]:
,
()
()
,
()
()
.=
(, ): argmin [] [ ]
,
(*)
*
*
hm f m hmm f
hmM
i
m
M
i
i
00
01
2
1
=−−
′
()
+
≥≤
′
≤
=
∑
fw
rcc
(*)
[] [ ] ,
*
i
m
M
mhmm
i
−
′
−
()
⎛
⎝
⎜
⎜
⎜
⎞
⎠
⎟
⎟
⎟
=
∑
2
1
(, , ): argmin
[]
**
,,
,,,
()
,
amN
fm a
iii
amM
N
i
i
ii
i
i
∗
≥≤
′
≤
=
=
−
01
012…
fw
nnini
n
N
m
M
i
in
hm m a
fm ah
ii
()
[] (
,,
()
,
−
′
−
⎛
⎝
⎜
⎜
⎜
⎞
⎠
⎟
⎟
⎟
+−
′
==
∑∑
0
1
2
1
rc
mmma N
in i
n
N
i
m
M
ii
,,
)−−
⎛
⎝
⎜
⎜
⎜
⎞
⎠
⎟
⎟
⎟
+
⎛
⎝
⎜
⎜
⎜
⎜
⎜
⎜
⎜
⎜
⎞
⎠
⎟
⎟
⎟
⎟
⎟
⎟
==
∑∑
0
1
2
1
α
⎟⎟
⎟
,
h
fm ahmm a
i
in in i
n
N
i
*:argmin
[] ( )
()
,,
’*
,
=
−−−
⎛
⎝
⎜
⎜
⎜
⎞
⎠
⎟
⎟
⎟
∗
=
∑
fw
0
1
2
mm
M
i
in in i
n
h
N
i
i
fm ahm ma
=
∗
=
≥
∑
∑
+− −−
⎛
⎝
⎜
⎜
⎜
⎜
⎞
⎠
⎟
⎟
1
0
1
0
rc
()
,,
’*
,
[] ( )
⎟⎟
⎟
⎛
⎝
⎜
⎜
⎜
⎜
⎜
⎜
⎜
⎜
⎜
⎜
⎞
⎠
⎟
⎟
⎟
⎟
⎟
⎟
⎟
⎟
⎟
⎟
=
=
∑
∑
2
1
1
m
M
i
k
i
,
Genome Biology 2009, 10:R142 />Page 4 of 12
(page number not for citation purposes)
(62.7%) were aligned. Reads were aligned as described in
[3].
GABP ChIP-seq dataset
ChIP-seq data for the GABP transcription factor in
humans was obtained from Valouev and associates [4].
This dataset contains 7,862,231 aligned ChIP reads and
17,404,922 aligned control reads. We omitted from the
dataset all reads that did not lie on chromosome 19
between positions 60,000,000 and 62,000,000, which
resulted in 27,800 aligned ChIP reads and 19,930 aligned
control reads.
Software implementation
CSDeconv is implemented by using MATLAB R2009a
(The Mathworks, Inc., Natick, MA, USA) and is freely
available for nonprofit use [34].
Results and Discussion
An overview of CSDeconv is shown in Figure 1. CSDeconv
begins with an initial stage in which enriched regions are
identified and kernel density estimation is applied to esti-
mate the probability density functions associated with
ChIP and control read locations. For both ChIP and con-
trol reads, we estimate probability densities functions for
forward reads (reads that align to the forward strand) and
reverse reads (reads that align to the reverse strand). To
identify enriched regions, we divide the genome into non-
overlapping bins into which reads are binned, and we
search for significantly enriched bins by using a log-likeli-
hood ratio (LLR) test. The probability density functions
associated with ChIP and control read locations are used
to derive enrichment profiles that describe the enrichment
level throughout each enriched region for both forward
and reverse reads.
From the enrichment profiles, an initial estimate is made
of the shape of an enrichment peak. Specifically, we use a
heuristic that searches for narrow peaks of large ampli-
tude. This peak shape is used to deconvolve the enrich-
ment profiles (that is, binding site locations and
magnitudes are estimated under the assumption that each
binding site gives rise to one peak of the given shape).
Because the initial peak-shape estimate may be incorrect,
the binding-site locations and magnitudes thus obtained
are used to reestimate and refine the peak shape. We then
return to estimating binding-site locations and magni-
tudes by using the reestimated peak shape. We repeat this
iterative cycle until the change in the peak shape achieved
in an iteration is negligible.
Performance
To test CSDeconv, we applied it to novel ChIP-seq data for
the DosR transcription factor in MTB and to existing data
for the GABP transcription factor in humans.
DosR is a transcription factor that is believed to play an
important role in MTB virulence, and it is therefore
important to understand its targets and mechanism of
operation. The dosR locus is among the first induced by
reduced oxygen [20-22] or low levels of nitric oxide [23],
which are conditions thought to reflect in vivo infection.
Moreover, DosR is induced rapidly on infection of macro-
phages [24,25] and mice [23,26]. DosR is therefore
believed to play an important role in infection, and it is
necessary for hypoxic gene induction [16] - a condition
used to promote nonreplicating persistence in vitro. Thus,
DosR has received significant attention, and a putative
motif has been derived for its binding site [16].
GABP is a human transcription factor that was previously
studied by using ChIP-seq by Valouev and colleagues [4].
The potential for GABP to bind multiple times in closely
spaced regions [27] makes it a suitable test case for blind
deconvolution to tease apart multiple binding sites over
short distances. As it is currently implemented, CSDeconv
cannot be used straightforwardly to analyze genome-wide
binding of GABP because the computational require-
ments of CSDeconv prohibit the analysis of such a large
number of enriched regions. CSDeconv can, however, be
applied to analyze a subset of all enriched regions, thus
demonstrating the efficacy of blind deconvolution, even
in the lower sequencing depths that are achieved on mam-
malian genomes.
To apply CSDeconv effectively, it is necessary to set its
parameters to achieve an appropriate level of sensitivity
and specificity. Two parameters of principal importance
exist: the threshold on the LLR that is used to determine
significantly enriched bins, and the regularization factor
α
that determines the number of binding sites that are called
in an enriched region. We determine appropriate levels
for these parameters by estimating the false discovery rate
(FDR) achieved by various settings. The FDR is estimated
by using the same procedure used in a number of ChIP-
seq and ChIP-chip peak finders [7,28,29]: a sample swap.
ChIP and control reads are swapped, CSDeconv is run,
and the empirical FDR is calculated as the number of
detections in the control (over ChIP) sample divided by
the number of detections in the ChIP (over control) sam-
ple.
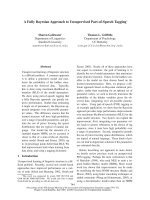
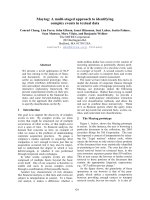
In Figures 2a and 2b, we show the empirical FDR for
enriched regions as a function of the LLR threshold for the
DosR and GABP datasets, respectively. We see that, owing
to its lower coverage, larger LLR thresholds are required to
achieve low FDRs in the GABP dataset. To ensure that a
sufficient number of false enriched regions exist to obtain
a good estimate of the FDR for binding sites, we set the
LLR threshold to achieve a relatively high empirical FDR
for enriched regions. We set the LLR threshold to 18.75 for
Genome Biology 2009, 10:R142 />Page 5 of 12
(page number not for citation purposes)
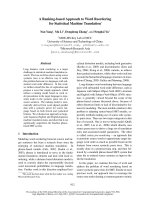
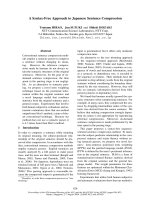
Overview of CSDeconvFigure 1
Overview of CSDeconv. After an initial stage in which enriched regions are identified and probability density functions asso-
ciated with ChIP and control read locations are derived, we obtain enrichment profiles that describe the enrichment level
throughout each enriched site for both forward and reverse reads. From the enrichment profiles, an initial estimate is made of
the shape of an enrichment peak. The peak shape is used to deconvolve the enrichment profiles, deriving binding-site locations
and magnitudes, which are then used to reestimate the peak shape, and this iterative cycle is repeated until convergence.
Genome Biology 2009, 10:R142 />Page 6 of 12
(page number not for citation purposes)
the DosR dataset and 38.5 for the GABP dataset, achieving
empirical FDRs for enriched regions of 0.389 and 0.40,
respectively.
At these LLR thresholds, we then determine the empirical
FDR for binding sites at various levels of
α
. The empirical
FDR for binding sites as a function of
α
is shown in Fig-
ures 2c and 2d. For the results we report, we set
α
to 700
for the DosR dataset and to 40,000 for the GABP dataset,
achieving low empirical FDRs of 0.042 and 0.044, respec-
tively.
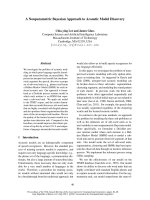
For DosR, CSDeconv identified a total of 24 binding loca-
tions (see Table 1). With MEME [30], we searched for a
conserved DNA motif within 50 bp of the binding loca-
tions, and we found an 18-bp motif that closely matches
the motif previously identified by Park and co-workers
[16] from expression analysis (see Figure 3a). Then, by
using MAST [31], we searched for the presence of this
motif within 50 bp of the binding locations and, for 23 of
the 24 binding locations, we found a matching sequence.
The average difference of the position estimated by CSDe-
conv and the center of the motif-matching sequence is
13.9 bp, and the average absolute difference is 20.1 bp. An
examination of the sequences in the 18 enriched regions
in which these 24 binding sites occurred did not reveal
any likely binding sites that were not called.
Empirical FDR of CSDeconvFigure 2
Empirical FDR of CSDeconv. (a, b) The empirical FDR for enriched regions as a function of LLR threshold is shown for
the (a) DosR and (b) GABP datasets. (c, d) With the LLR threshold fixed, the empirical FDR for binding sites as a function of
the regularization factor α is shown for the (c) DosR dataset (LLR threshold at 18.75) and the (d) GABP dataset (LLR thresh-
old at 38.5).
(a) (b)
DosR dataset GABP dataset
(d)(c)
14 16 18 20 22
0
0.2
0.4
0.6
0.8
1
LLR threshold
FDR
20 30 40 50
0
0.2
0.4
0.6
0.8
1
LLR threshold
FDR
200 400 600 800 1000
0
0.02
0.04
0.06
0.08
0.1
0.12
A
FDR
2 3 4 5
x10
4
0
0.05
0.1
A
FDR
Genome Biology 2009, 10:R142 />Page 7 of 12
(page number not for citation purposes)
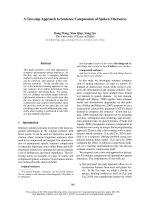
Notably, we are able to identify several instances of very
closely spaced binding sites. For example, we identify two
binding sites upstream of Rv1737c that are separated by
only 40 bp, and we identify two binding sites upstream of
Rv2031c that are separated by only 57 bp. As an illustra-
tive example, we show the latter in Figure 4. That binding
occurs at both of these sites was previously established by
mobility-shift assays [16]. Moreover, our algorithm pre-
dicts that more binding occurs at the more upstream of
the two sites, which is the site that has been found to be
responsible for a greater fraction of the DosR-dependent
induction of Rv2031c under hypoxic conditions.
For GABP, we applied CSDeconv to an arbitrarily chosen
2-Mbp segment of human chromosome 19 that starts
from chromosome position 60,000,000. In this segment,
we identified 23 GABP-binding locations (see Table 2) of
which 17 (74%) lie within CpG islands, indicative of pro-
moter and control regions [32]. With the same analysis as
for DosR, we found a 12-bp motif resembling that previ-
ously identified [4,19] that lies within 50 bp of 18 of the
23 binding locations found by CSDeconv (see Figure 3b).
The average difference of the position estimated by CSDe-
conv and the center of the motif-matching sequence is 9.1
bp, and the average absolute difference is 23.5 bp. Again,
Table 1
Results of CSDeconv on DosR data
Peak ID Position Amplitude Position of motif match Difference Absolute difference Location
1 88,097.4 2.4 88,125.5 28.1 28.1 Upstream of Rv0079
2 434,899.0 2.8 434,926.5 27.5 27.5 In Rv0356c; upstream of Rv0355c
3 665,844.1 7.8 665,861.5 17.4 17.4 In Rv0573c; upstream of Rv0572c
4 668,490.6 2.8 668,497.5 6.9 6.9 Upstream of Rv0574c
5 801,443.4 3.6 801,480.5 37.1 37.1 In Rv0702
6 1,639,602.3 8.5 1,639,627.5 25.2 25.2 In Rv1453
7 1,960,515.3 13.7 1,960,520.5 5.2 5.2 Upstream of Rv1733c
8 1,960,611.5 28.0 1,960,624.5 13 13 Upstream of Rv1733c
9 1,960,697.2 11.0 Upstream of Rv1733c
10 1,965,459.6 10.8 1,965,471.5 11.9 11.9 Upstream of Rv1737c
11 1,965,540.8 15.2 1,965,511.5 -29.3 29.3 Upstream of Rv1737c
12 2,056,358.2 2.7 2,056,375.5 17.3 17.3 Upstream of Rv1813c, Rv1814
13 2,238,941.0 9.5 2,238,938.5 -2.5 2.5 Upstream of Rv1996
14 2,256,459.3 13.0 2,256,496.5 37.2 37.2 Upstream of Rv2007c
15 2,278,994.7 43.5 2,279,005.5 10.8 10.8 Upstream of Rv2031c, Rv2032
16 2,279,049.0 25.8 2,279,062.5 13.5 13.5 Upstream of Rv2031c, Rv2032
17 2,949,475.3 5.7 2,949,472.5 -2.8 2.8 Upstream of Rv2623
18 2,953,044.8 8.3 2,953,074.5 29.7 29.7 Upstream of Rv2626c
19 2,954,750.4 5.1 2,954,792.5 42.1 42.1 Upstream of Rv2627c, Rv2628
20 2,955,065.5 9.9 2,955,031.5 -34 34 Upstream of Rv2627c, Rv2628
21 2,955,479.2 9.5 2,955,476.5 -2.7 2.7 Upstream of Rv2629
22 3,492,069.6 12.0 3,492,092.5 22.9 22.9 In Rv3126c; upstream of Rv3127
23 3,496,438.8 54.7 3,496,451.5 12.7 12.7 Upstream of Rv3130c, Rv3131
24 3,500,822.1 3.6 3,500,853.5 31.4 31.4 Upstream of Rv3134c
CSDeconv identifies a total of 24 binding sites. The position of the sequence matching the motif shown in Figure 3a is given if such a sequence exists
within 50 bp of the predicted binding site.
Sequence logos of binding motifsFigure 3
Sequence logos of binding motifs. The sequence logo of
the binding motifs found through CSDeconv analysis is
shown for (a) DosR and (b) GABP.
(a)
(b)
0
1
2
bits
1
2
T
C
G
A
3
C
A
G
4
T
A
G
5
A
G
6
T
G
A
C
7
A
C
8
T
C
A
G
9
T
G
A
10
T
A
11
C
T
G
A
12
G
13
G
A
T
14
T
C
15
G
T
A
C
16
A
T
C
17
A
C
T
18
G
C
T
A
0
1
2
bits
1
A
G
T
C
2
T
G
C
3
C
G
A
4
G
T
C
5
C
T
6
G
T
7
G
C
8
C
9
C
T
G
10
T
C
G
11
G
A
T
C
12
G
T
C
Genome Biology 2009, 10:R142 />Page 8 of 12
(page number not for citation purposes)
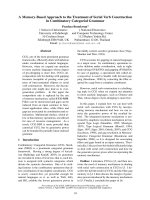
Illustration of the results obtained by CSDeconv for DosR binding upstream of Rv2031cFigure 4
Illustration of the results obtained by CSDeconv for DosR binding upstream of Rv2031c. (a) The forward and
reverse enrichment profiles obtained after kernel density estimation of the read distributions are shown in black and shaded in
gray. Colored lines display various fits arising from estimated binding. Note that no distinct peaks are evident in the enrichment
profiles and, in particular, there are no dips. (b) Both forward and reverse reads are associated with fits: the forward fit 3 is the
sum of the forward enrichment peaks 1 and 2, whereas the reverse fit 3' is the sum of the reverse enrichment peaks 1' and 2'.
(c) The combined forward and reverse enrichment peaks arise from two binding sites, which are peaks 15 and 16 in Table 1.
Motif logos overlay the actual sequence of the intergenic region truncated for brevity, showing the two binding sites, which are
separated by a scant 57 bp. Enrichment is plotted as the fold magnitude of the ChIP read density over the control read density.
Genome Biology 2009, 10:R142 />Page 9 of 12
(page number not for citation purposes)
we identify several instances of very closely spaced bind-
ing sites. In particular, we identify two binding sites
located at positions 60,209,299.5 and 60,209,319.5 that
are separated by a mere 20 bp.
Comparison with other methods
Other methods for ChIP-seq data analysis search for peaks
of enrichment and call such peaks as single binding sites.
They do not deconvolve the peaks into separate binding
sites. As such, they are generally incapable of identifying
closely spaced binding sites where enrichment peaks over-
lap and merge into a single peak, as is the case, for exam-
ple, in Figure 4. We therefore expect that, for the same
number of binding sites called, CSDeconv will exhibit a
greater level of accuracy than alternative methods, which
are based on peak searching. Such alternative methods
will miss instances of closely spaced binding sites and
instead call false binding sites.
We demonstrate the capabilities of CSDeconv by compar-
ing it with MACS [7] and SISSRs [9], two publicly availa-
ble ChIP-seq peak-finding methods. For both DosR and
GABP, we use MEME and MAST to determine the percent-
age of predicted binding sites that have an associated
motif within 50 bp for CSDeconv, MACS, and SISSRs,
applied at varying levels of stringency.
For the DosR dataset, CSDeconv consistently yields a sig-
nificantly higher percentage of motif occurrences than do
both MACS and SISSRs (see Figure 5). The results we show
are obtained with the LLR threshold fixed at 18.75, as
before, and we vary
α
to obtain differing numbers of pre-
dicted binding sites. Thus, we expect the accuracy to fall
off rapidly after a certain number of predicted sites are
called, because the number of enriched regions remains
constant. The decline in accuracy is observably noticeable
after approximately 25 sites. For the GABP dataset, CSDe-
conv yields a higher percentage of motif occurrences than
MACS and is comparable in performance to SISSRs. The
LLR threshold is fixed at 38.5, as before, so we again
expect the accuracy to fall off rapidly for CSDeconv.
Motif occurrence can be used not only to validate binding
sites, but potentially also to find them. It may be possible
to avoid blind deconvolution by simply searching for
multiple, rather than single-motif occurrences around a
Table 2
Results of CSDeconv on GABP data
Peak ID Position Amplitude Position of motif
match
Difference Absolute difference Location CpG island
1 60,209,266.5 145.6 60,209,299.5 33 33 Upstream of Hs.631589 No
2 60,209,352.0 242.4 60,209,319.5 -32.5 32.5 Upstream of Hs.631589 No
3 60,209,441.8 32.1 60,209,417.5 -24.3 24.3 In Hs.631589 No
4 60,355,290.1 93.1 60,355,272.5 -17.6 17.6 In TNNI3 No
5 60,355,384.7 109.8 60,355,373.5 -11.2 11.2 In TNNI3 No
6 60,483,301.5 116.7 60,483,320.5 19 19 Upstream of HSPBP1 Yes
7 60,508,823.3 53.5 60,508,860.5 37.2 37.2 In BRSK1 No
8 60,589,079.4 89.0 60,589,061.5 -17.9 17.9 In LOC388564,
Upstream of RPL28
Yes
9 60,784,129.0 152.4 60,784,167.5 38.5 38.5 Upstream of ZNF579 Yes
10 60,802,703.2 72.5 60,802,723.5 20.3 20.3 In FIZ1 Yes
11 60,802,828.5 34.2 Upstream of FIZ1 Yes
12 60,808,717.3 19.1 60,808,762.5 45.2 45.2 Downstream of ZNF524 Yes
13 60,838,116.9 163.1 Upstream of ZNF580 Yes
14 60,838,170.7 87.4 60,838,194.5 23.8 23.8 Upstream of ZNF580 Yes
15 60,846,738.1 37.1 Upstream of ZNF581 Yes
16 60,856,978.7 23.4 Upstream of U2AF2 Yes
17 60,878,268.6 125.4 60,878,250.5 -18.1 18.1 Upstream EPN1 Yes
18 60,878,368.7 105.4 60,878,386.5 17.8 17.8 Upstream of EPN1 Yes
19 61,517,917.1 24.8 Upstream of
LOC729994
Yes
20 61,518,034.1 98.8 61,518,049.5 15.4 15.4 Upstream of
LOC729994
Yes
21 61,518,366.6 26.5 61,518,358.5 -8.1 8.1 Upstream of
LOC729994
Yes
22 61,741,681.4 16.8 61,741,681.5 0.1 0.1 In ZFP28 Yes
23 61,741,850.8 25.5 61,741,894.5 43.7 43.7 In ZFP28 Yes
CSDeconv identifies a total of 23 binding sites between position 60,000,000 and 62,000,000 on chromosome 19. The position of the sequence
matching the motif shown in Figure 3a is given if such a sequence exists within 50 bp of the predicted binding site.
Genome Biology 2009, 10:R142 />Page 10 of 12
(page number not for citation purposes)
ChIP-seq peak. To establish that the performance
improvements observed in CSDeconv are due to blind
deconvolution and cannot simply be found by motif
searching, we compared CSDeconv against a "simplified"
version; instead of using blind deconvolution to detect
instances of multiple binding sites at a single enriched
region, we simply used MEME to search for conserved
motifs that can occur arbitrarily many times around peaks
in each enriched region. The results of this analysis are
shown in Table 3. We see that there are both instances in
which binding sites are called by CSDeconv and not be
the simplified version and vice versa. In general, the sim-
plified CSDeconv calls more binding sites, and this is
especially true in the case of GABP, where the motif is less
informative. Cases exist, however, in which the simplified
CSDeconv fails to call binding sites that are called by
CSDeconv. These cases are supported by read enrichment,
and slight modifications to the motif are usually enough
to allow a match at those locations, but the simplified
CSDeconv has difficulty finding a suitable motif. As for
whether the additional binding sites called by the simpli-
fied CSDeconv are false positives, this is difficult to deter-
mine, as few true negatives are known, especially when it
comes to closely spaced binding sites. In the case of the acr
(Rv2031c) gene in MTB, however, the binding site in this
gene's promoter region that is called by the simplified
CSDeconv and is not called by CSDeconv (at position
2279027) is unlikely to be bound by DosR at any signifi-
cant level, based on previous studies [16]. We conclude,
therefore, that the results obtained by CSDeconv cannot
simply be obtained by motif searching, and our results
indicate that the latter method results in a higher rate of
false positives.
Conclusions
As sequencing becomes faster and cheaper, ChIP-seq will
likely become the method of choice for mapping sites of
protein-DNA interaction, and methods that can call such
sites effectively and accurately from ChIP-seq data will
become increasingly important. CSDeconv allows accu-
rate calls to be made in the case of closely spaced tran-
scription factor-binding sites, which is a phenomenon
observed frequently, particularly in prokaryotes. The
method we use differs substantially from previous tech-
niques in that we use a blind-deconvolution approach,
explicitly estimating the shape of an enrichment peak in
addition to binding-site locations and magnitudes,
thereby distinguishing closely spaced transcription factor-
binding sites.
As it is currently implemented, CSDeconv is not attractive
for the study of genome-wide binding of transcription fac-
tors in mammalian genomes because of its computational
requirements. We have, however, demonstrated that
CSDeconv can be applied to mammalian ChIP-seq data
and is useful for the analysis of such data. Although it is
difficult to predict how the number of iterations required
by CSDeconv will increase as the number of enriched
regions increases, each iteration simply scales linearly.
Thus, whereas CSDeconv is currently suited to handle a
small number (tens) of enriched regions, it is likely that,
with algorithmic improvements, blind deconvolution can
Comparison of CSDeconv, MACS, and SISSRs by motif analysisFigure 5
Comparison of CSDeconv, MACS, and SISSRs by motif analysis. The percentage of predicted binding sites with asso-
ciated motifs within 50 bp is shown as a function of the number of predicted binding sites with CSDeconv, MACS, and SISSRs
for (a) DosR and (b) GABP. For MACS and SISSRs, we take the predicted binding-site location to be the peak center.
(a) (b)
DosR dataset GABP dataset
10 15 20 25
30
40
50
60
70
80
90
100
Number of DosR binding sites
Motif presence (%)
CSDeconv
MACS
SISSRs
10 15 20
25
40
50
60
70
80
90
100
Number of GABP binding sites
Motif presence (%)
CSDeconv
MACS
SISSRs
Genome Biology 2009, 10:R142 />Page 11 of 12
(page number not for citation purposes)
Table 3
Comparison of CSDeconv with "simplified" CSDeconv
DosR data GABP data
Motif match for CSDeconv Motif match for simplified
CSDeconv
Motif match for CSDeconv Motif match for simplified
CSDeconv
88,125.5 88,124.5 60,209,242
434,926.5 434,925.5 60,209,279
665,861.5 665,860.5 60,209,300 60,209,299
665,882.5 60,209,320 60,209,319
668,497.5 668,498.5 60,209,356
801,480.5 60,209,397
1,639,628 1,639,629 60,209,418 60,209,417
1,960,521 1,960,520 60,355,273 60,355,274
1,960,542 60,355,294
1,960,625 1,960,624 60,355,314
1,965,472 1,965,473 60,355,334
1,965,512 1,965,513 60,355,374 60,355,375
1,965,533 60,355,395
2,056,376 2,056,377 60,355,415
2,056,410 60,355,435
2,238,919 60,483,321 60,483,320
2,238,939 2,238,940 60,508,762
2,256,475 60,508,861 60,508,862
2,256,497 2,256,498 60,589,062 60,589,061
2,279,006 2,279,007 60,589,119
2,279,027 60,589,144
2,279,063 2,279,062 60,589,163
2,949,473 2,949,472 60,784,040
2,949,496 60,784,108
2,953,075 2,953,074 60,784,168 60,784,167
2,953,099 60,784,201
2,954,793 60,802,658
2,955,032 2,955,033 60,802,702
2,955,099 60,802,724 60,802,725
2,955,477 60,802,741
3,492,093 3,492,094 60,802,761
3,496,452 3,496,453 60,802,785
3,500,832 60,802,817
3,500,854 3,500,853 60,808,690
60,808,717
60,808,763
60,808,770
60,808,789
60,808,815
60,838,195 60,838,196
60,846,664
60,846,794
60,857,070
60,878,251 60,878,250
60,878,292
60,878,366
60,878,387 60,878,388
61,517,979
61,518,050 61,518,051
61,518,359
61,741,682
61,741,862
61,741,895
61,741,918
Locations of motif matches for CSDeconv and a simplified CSDeconv that uses motif finding instead of blind deconvolution are listed for both the
DosR and GABP datasets. Offsets are observed in the matching sequences for the two methods owing to differing motifs found by the methods.
Genome Biology 2009, 10:R142 />Page 12 of 12
(page number not for citation purposes)
be straightforwardly applied to study genome-wide pro-
tein-DNA interaction in mammals and other eukaryotes.
Abbreviations
bp: base pair(s); ChIP: chromatin immunoprecipitation;
ChIP-Seq: chromatin immunoprecipitation coupled with
massively parallel sequencing; DosR: dormancy survival
regulator; FDR: false discovery rate; FWHM: full width at
half maximum; GABP: growth-associated binding pro-
tein; LLR: log-likelihood ratio; MTB: Mycobacterium tuber-
culosis.
Authors' contributions
DSL and JEG conceived the project. DSL designed and
implemented the algorithm. DSL and BW performed the
experiments and wrote the article. AS and DRS generated
the DosR dataset.
Acknowledgements
The authors thank Mark Borowsky, Daniel Neafsey, Toshiro Ohsumi, and
Daniel Schwartz for helpful comments and suggestions.
References
1. Mardis ER: ChIP-seq: welcome to the new frontier. Nat Meth-
ods 2007, 4:613-614.
2. Robertson G, Hirst M, Bainbridge M, Bilenky M, Zhao Y, Zeng T,
Euskirchen G, Bernier B, Varhol R, Delaney A, Thiessen N, Griffith
OL, He A, Marra M, Snyder M, Jones S: Genome-wide profiles of
STAT1 DNA association using chromatin immunoprecipita-
tion and massively parallel sequencing. Nat Methods 2007,
4:651-657.
3. Mikkelsen TS, Ku M, Jaffe DB, Issac B, Lieberman E, Giannoukos G,
Alvarez P, Brockman W, Kim T-K, Koche RP, Lee W, Mendenhall E,
O'Donovan A, Presser A, Russ C, Xie X, Meissner A, Wernig M, Jae-
nisch R, Nusbaum C, Lander ES, Bernstein BE: Genome-wide maps
of chromatin state in pluripotent and lineage-committed
cells. Nature 2007, 448:553-560.
4. Valouev A, Johnson DS, Sundquist A, Medina C, Anton E, Batzoglou
S, Myers RM, Sidow A: Genome-wide analysis of transcription
factor binding sites based on ChIP-Seq data. Nat Methods
2008, 5:829-834.
5. Johnson DS, Mortazavi A, Myers RM, Wold B: Genome-wide map-
ping of in vivo protein-DNA interactions. Science 2007,
316:1497-1502.
6. Fejes AP, Robertson G, Bilenky M, Varhol R, Bainbridge M, Jones SJM:
FindPeaks 3.1: a tool for identifying areas of enrichment
from massively parallel short-read sequencing technology.
Bioinformatics 2008, 24:1729-1730.
7. Zhang Y, Liu T, Meyer C, Eeckhoute J, Johnson D, Bernstein B, Nuss-
baum C, Myers R, Brown M, Li W, Liu XS: Model-based analysis of
ChIP-Seq (MACS). Genome Biol 2008, 9:R137.
8. Ji H, Jiang H, Ma W, Johnson DS, Myers RM, Wong WH: An inte-
grated software system for analyzing ChIP-chip and ChIP-
seq data. Nat Biotechnol 2008, 26:1293-1300.
9. Jothi R, Cuddapah S, Barski A, Cui K, Zhao K: Genome-wide iden-
tification of in vivo protein-DNA binding sites from ChIP-Seq
data. Nucleic Acids Res 2008, 36:5221-5231.
10. Kharchenko PV, Tolstorukov MY, Park PJ: Design and analysis of
ChIP-seq experiments for DNA-binding proteins. Nat Biotech-
nol 2008, 26:1351-1359.
11. Boyle AP, Guinney J, Crawford GE, Furey TS:
F-Seq: a feature den-
sity estimator for high-throughput sequence tags. Bioinformat-
ics 2008, 24:2537-2538.
12. Zhang ZD, Rozowsky J, Snyder M, Chang J, Gerstein M: Modeling
ChIP sequencing in silico with applications. PLoS Comput Biol
2008, 4:e1000158.
13. Rozowsky J, Euskirchen G, Auerbach RK, Zhang ZD, Gibson T, Bjorn-
son R, Carriero N, Snyder M, Gerstein MB: PeakSeq enables sys-
tematic scoring of ChIP-seq experiments relative to
controls. Nat Biotechnol 2009, 27:66-75.
14. Tuteja G, White P, Schug J, Kaestner KH: Extracting transcription
factor targets from ChIP-Seq data. Nucleic Acids Res 2009,
37:e113.
15. Bulyk ML, McGuire AM, Masuda N, Church GM: A motif co-occur-
rence approach for genome-wide prediction of transcrip-
tion-factor-binding sites in Escherichia coli. Genome Res 2004,
14:201-208.
16. Park H-D, Guinn KM, Harrell MI, Liao R, Voskuil MI, Tompa M,
Schoolnik GK, Sherman DR: Rv3133c/dosR is a transcription fac-
tor that mediates the hypoxic response of Mycobacterium
tuberculosis. Mol Microbiol 2003, 48:833-843.
17. Bishop CM: Pattern Recognition and Machine Learning. New
York: Springer; 2006.
18. Hastie T, Tibshirani R, Friedman J: The Elements of Statistical
Learning: Data Mining, Inference, and Prediction. New York:
Springer; 2001.
19. Virbasius JV, Virbasius C-mA, Scarpulla RC: Identity of GABP with
NRF-2, a multisubunit activator of cytochrome oxidase
expression, reveals a cellular role for an ETS domain activa-
tor of viral promoters. Genes Dev 1993, 7:380-392.
20. Boon C, Dick T: Mycobacterium bovis BCG response regulator
essential for hypoxic dormancy. J Bacteriol 2002, 184:6760-6767.
21. Dasgupta N, Kapur V, Singh KK, Das TK, Sachdeva S, Jyothisri K, Tyagi
JS: Characterization of a two-component system, devR-devS,
of Mycobacterium tuberculosis. Tuber Lung Dis 2000, 80:141-159.
22. Sherman DR, Voskuil M, Schnappinger D, Liao R, Harrell MI, School-
nik GK: Regulation of the Mycobacterium tuberculosis hypoxic
response gene encoding α-crystallin. Proc Natl Acad Sci USA
2001, 98:7534-7539.
23. Voskuil MI, Schnappinger D, Visconti KC, Harrell MI, Dolganov GM,
Sherman DR, Schoolnik GK: Inhibition of respiration by nitric
oxide induces a Mycobacterium tuberculosis dormancy pro-
gram. J Exp Med 2003, 198:705-713.
24. Schnappinger D, Ehrt S, Voskuil MI, Liu Y, Mangan JA, Monahan IM,
Dolganov G, Efron B, Butcher PD, Nathan C, Schoolnik GK: Tran-
scriptional adaptation of Mycobacterium tuberculosis within
macrophages: insights into the phagosomal environment. J
Exp Med 2003, 198:693-704.
25. Yuan Y, Crane DD, Simpson RM, Zhu Y, Hickey MJ, Sherman DR,
Barry CE III: The 16-kDa α-crystallin (Acr) protein of Mycobac-
terium tuberculosis is required for growth in macrophages.
Proc Natl Acad Sci USA 1998, 95:9578-9583.
26. Shi L, Sohaskey CD, Kana BD, Dawes S, North RJ, Mizrahi V, Gennaro
ML: Changes in energy metabolism of Mycobacterium tuber-
culosis in mouse lung and under in vitro conditions affecting
aerobic respiration. Proc Natl Acad Sci USA 2005,
102:15629-15634.
27. Yang Z-F, Mott S, Rosmarin AG: The Ets transcription factor
GABP is required for cell-cycle progression. Nat Cell Biol 2007,
9:339-346.
28. Johnson WE, Li W, Meyer CA, Gottardo R, Carroll JS, Brown M, Liu
XS: Model-based analysis of tiling-arrays for ChIP-chip. Proc
Natl Acad Sci USA 2006, 103:12457-12462.
29. Song JS, Johnson WE, Zhu X, Zhang X, Li W, Manrai AK, Liu JS, Chen
R, Liu XS: Model-based analysis of two-color arrays (MA2C).
Genome Biol 2007, 8:
R178.
30. Bailey TL, Williams N, Misleh C, Li WW: MEME: discovering and
analyzing DNA and protein sequence motifs. Nucleic Acids Res
2006, 34:W369-W373.
31. Bailey TL, Gribskov M: Combining evidence using p-values:
application to sequence homology searches. Bioinformatics
1998, 14:48-54.
32. Takai D, Jones PA: Comprehensive analysis of CpG islands in
human chromosomes 21 and 22. Proc Natl Acad Sci USA 2002,
99:3740-3745.
33. Bertsekas DP: Nonlinear Programming 2nd edition. Belmont, MA: Ath-
ena Scientific; 1999.
34. CSDeconv [ />]