Báo cáo y học: "Direct sequencing of the human microbiome readily reveals community differences" pps
Bạn đang xem bản rút gọn của tài liệu. Xem và tải ngay bản đầy đủ của tài liệu tại đây (1.31 MB, 9 trang )
In the past few years, the availability of improved sequen-
cing methods, including pyrosequencing [1], has revo-
lution ized what we know about the microbes that inhabit
our bodies. Although it has been known for decades that
our microbial symbionts outnumber our own cells by
about a factor of 10 [2], the differences in the repertoires
of symbionts harbored by different healthy individuals,
different sites within the individual, and by individuals
over time are only now coming to light. Initially, it was
assumed that a ‘core microbiome’ existed; that is, that a
substantial number of microbial species was shared in
each body habitat in all or most humans, and that the
genomes of these core species could be used as scaffolds
to assemble fragmentary data from short-read shotgun
sequencing of microbial community DNA [3].
e first three individuals whose gut microbiomes were
surveyed using substantial numbers of 16S rRNA gene
sequences shared few of their species, however [4].
Similarly, observations that a person’s left and right hands
have only 17% of bacterial species in common, and that
two different people’s hands share only 13% [5], cast
doubt on the concept of a substantial core set of microbial
species shared by all or most people. is doubt has been
reinforced by recent work that redefines core lineages or
genes as ‘core’ even if shared by relatively few people
[6,7]. In fact, on the basis of 16S rRNA gene analyses we
can rule out the possibility that, even within relatively
homogeneous small populations of fewer than 100
individuals, everyone’s skin-surface communities or gut
communities share more than a tiny fraction of species
[6-8]. is unanticipated variability in shared community
membership, and also in other important aspects of the
human microbiome, poses substantial conceptual and
compu tational challenges.
Of particular importance for microbiome studies is the
following question: what is the effect size? at is, using
standard terminology from statistics, how distinguishable
are two communities or groups of communities? Obtain-
ing an answer is essential for addressing many practical
concerns with experimental design. For example, the
effect size determines how many individuals need to be
recruited for a given study, and how many sequences
need to be collected per sample to observe differences if
they exist. ese considerations are particularly impor-
tant for the study of systemic disorders such as diabetes
or some autoimmune disorders, which are expected to
influence the microbiome in multiple body habitats. We
need a sense of how much variation exists among
different body habitats, how much variation is observed
among healthy individuals for the same body habitat, and
how much of a shift occurs due to a pathophysiologic
state. It is also important to define the most appropriate
method for determining the magnitude of similarity or
difference between communities, as the choice of method
has a large influence on the results of community com-
parisons [9-12]. A general discussion of the pros and cons
of different metrics of community overlap is beyond the
scope of this paper (see [9-12] for reviews). Here, we
summarize the types and sizes of effects found in studies
that used various methods of comparing groups of
samples, and look for large-scale patterns that can give
information on the number of individuals and sequences
that are needed to observe different types of effects
(Figure1).
A variety of interrelated features differentiate microbial
communities. ese features include the the relative
abundance of specific taxa (the proportion of the bacteria
Abstract
Culture-independent studies of human microbiota
by direct genomic sequencing reveal quite distinct
dierences among communities, indicating that
improved sequencing capacity can be most wisely
utilized to study more samples, rather than more
sequences per sample.
© 2010 BioMed Central Ltd
Direct sequencing of the human microbiome
readily reveals community differences
Justin Kuczynski
1
, Elizabeth K Costello
2
, Diana R Nemergut
3
, Jesse Zaneveld
1
, Christian L Lauber
4
, Dan Knights
5
,
OmryKoren
6
, Noah Fierer
4
, Scott T Kelley
7
, Ruth E Ley
6
, Jerey I Gordon
8
and Rob Knight
9,10
*
R EV IE W
*Correspondence:
9
Department of Chemistry and Biochemistry, University of Colorado, Boulder,
CO80309, USA
Full list of author information is available at the end of the article
Kuczynski et al. Genome Biology 2010, 11:210
/>© 2010 BioMed Central Ltd
in the sample that are Firmicutes, for example), the level
of species richness or diversity observed within a com-
mu nity (alpha diversity), and the degree to which differ-
ent communities share membership or structure (beta
diversity). A major challenge in comparing studies is that
there is no consistent way in which the size of community
differences is reported, as the type of difference that is
relevant depends on the study. For example, lean and
obese mice and humans differ in their ratios of prominent
bacterial phyla (Bacteroidetes (which include the common
gut commensal Bacteroides), Firmicutes (Gram-positive
bacteria, including Lactobacillus and Clostri dium), and
Actinobacteria (which include Corynebacteria and
Mycobacteria) [13-15]); men’s and women’s hands differ
in the number of species-level phylotypes (defined as
organisms with 16S sequence identity >97%) observed on
average [5]; and samples from the same or similar sites on
the bodies of different individuals cluster together using
UniFrac-based principal coordinates analysis [4,16,17].
UniFrac is a metric for comparing microbial communities
using phylogenetic information, which has been imple-
mented in several tools.
Because of the diverse ways in which microbial
communities respond to various environmental factors,
it is difficult to compare effect sizes across different
studies or systems, as an analysis that highlights differ-
ences in one system may obscure them in another. us,
in what follows, we review effect types and sizes as
reported by the authors of individual studies. We focus
on variation in human-associated microbial community
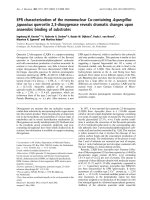
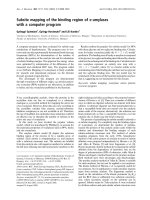
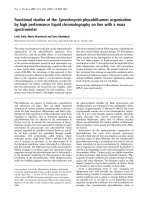
Figure 1. The problem of distinguishing between sequences. (a) An investigator contemplating the problem of distinguishing between
sequences from the gut of Equus asinus and the volar forearm of humans. (b) Our solution; guess the eect size based on the eect sizes reported
in published studies; perform simulations based on these eect sizes as shown in Figure 2, and then acquire sucient sequences to resolve
microbial community dierences of the expected magnitude. (c) When comparing the Equus asinus gut (white point) to human forearms (red and
green points represent left and right arms, respectively), 100 or even 10 sequences per sample provide sucient resolution, but one sequence per
sample does not.provide sucient resolution, but one sequence per sample does not.
(a)
(c)
(b)
100 10 1
Kuczynski et al. Genome Biology 2010, 11:210
/>Page 2 of 9
diversity as assessed by 16S rRNA gene sequence surveys
of abundant lineages, using various measures of both
within- and between-sample diversity (alpha and beta
diversity, respectively). We review comparisons of
microbial communities in relationship to both sampling
depth (that is, number of sequences per sample) and
breadth (that is, number of samples or individuals). We
then perform simulations using an atlas of microbes
associated with different sites in the human body to ask
how many sequences per sample are needed in order to
detect differences across individuals, time, and locations
within the body.
Reported effect sizes between and within different
body habitats
Table 1a provides an illustrative (though not exhaustive)
overview of the literature regarding differences observed
in different body habitats and locations in healthy
individuals, and the number of subjects and sequences
that were used to identify these differences. Although
metagenomic studies that examine all the genes in the
genome are also of immense interest, shotgun meta-
genomic data are so far available only from the gut and
for a relatively few samples, and so the range of questions
that can be addressed at present is substantially more
limited than for 16S rRNA-based surveys, the type of
survey we consider here. One robust finding that exem-
plifies relative effect sizes is that there appears to be a
greater degree of variation in microbial community
compo sition between individuals than within the same
individual over time (Table 1a). is has been found to be
true in multiple studies and over a wide range of body
habitats. For example, gut community composition is
relatively stable in the same individual across a period of
months when diet is consistent [6,16], and even to a
certain degree when diet is altered. (Changes in the
Firmicutes:Bacteroidetes ratio have been reported in
individuals who lost weight, whether they were con sum-
ing low-calorie fat- or carbohydrate-restricted diets, but
despite these shifts in relative abundance, interpersonal
variation was the largest effect observed using phylo-
genetic comparisons of the communities [14].) Likewise,
skin community composition is more similar within a
subject than between subjects over a period of months
[16,18], as are oral, nasal and external auditory canal
communities [16]. ese results indicate that you are
likely to be more similar to yourself in 3 months time than
to your friend today in terms of the bacteria you harbor.
Microbial community changes in human disease
and environmental samples
Although a wide range of studies in healthy subjects have
identified substantial interpersonal variation in overall
microbial community composition, how do these effect
sizes compare with differences correlated with disease, or
in response to treatments of various environmental
samples? To address this question, we reviewed culture-
independent, 16S rRNA gene-based surveys associated
with different physiological conditions (Table 1b) and
associated with experimental manipulations in non-
human environments (which were surprisingly scarce;
Table 1c).
One of the best-characterized effects of health status
on the gut microbiome is the association between obesity
and the proportional representation of Bacteroidetes,
Firmicutes and Actinobacteria [6,13-15]. Studies in mice
indicate that the microbiota contributes to the obese
state by providing the host with a greater amount of
energy from the diet compared with the microbiota of a
lean host [15], as well as by manipulating host genes that
regulate the deposition of energy in adipocytes [19]. e
obesity-associated microbiomes of humans (and mice)
are enriched in functional genes for certain types of
carbohydrate metabolism, and this is directly attributable
to the reduction in the numbers of genomes of members
of the Bacteroidetes [6,15].
However, even the size of the differences in gut
bacterial community composition of obese versus lean
hosts is debated, as different studies using different
methodologies have returned varied results [20]. e
impact of methodology is particularly evident in a study
of twins concordant for obesity or leanness, in which the
observed relative abundances of Bacteroidetes, Actino-
bacteria and Firmicutes, as judged by sequencing of
differ ent regions of 16S rRNA clones, depended on the
sequencing approach - pyrosequencing of PCR products,
Sanger sequencing of 16S rRNA clones, or shotgun
sequencing and phylogenetic classification of reads [6].
However, the direction of the effect was consistent across
methodologies, and detectable with as few as a couple of
hundred sequences per sample.
Observable phenotypes such as obesity may be caused
by a variety of underlying factors, and which of those
factors is responsible for shifts in the host’s microbiota is
difficult to address in such correlative studies. Experi-
mental manipulations of microbial communities, however,
allow determination of the relative effects of specific
variables on overall community composition or the abun-
dance of particular taxa, and as such, allow researchers to
draw conclusions regarding cause and effect. Examples of
experimental manipulations of non-human environments
that used 16S rRNA gene sequencing approaches (either
clone libraries or pyrosequencing) and that were well
enough replicated to allow statistical analysis are shown
in Table 1c. For soil samples, three to four replicates with
70 to 100 sequences were sufficient to observe differences
in microbial communities due to land use and moisture
regimes [21,22]. For piglet gut microbiota, the effects of
Kuczynski et al. Genome Biology 2010, 11:210
/>Page 3 of 9
Table 1. Variations observed among different types of microbial communities, and the extent of sequencing and
sampling used
Total
number Average
Number of 16S number of
Number of sequences sequences
of samples in nal per
Topic subjects sequenced analysis sample Study conclusions Reference
(a) Microbial communities associated with healthy humans
Oral 120 120 14,115 118 Collected saliva from 10 individuals at each of 12 globally widespread [38]
(saliva) locations. They attributed approximately 13.5% of the total variation in the
distribution of genera to dierences between individuals and found little
evidence for geographic structure: 11.7% of the variation was among
individuals from the same location while just 1.8% was among individuals
from dierent locations
Oral 3 29 298,261 10,285 Collected samples from various oral niches of three individuals; 26% of the [39]
(tooth, tongue, unique sequences and 47% of species-level phylotypes found in the study
buccal mucosa, were found in all three subjects. Bacterial community composition was
palate) shaped primarily by oral niche: principal components analysis dierentiated
communities from shedding (tongue, cheek, palate) versus tooth surfaces
Skin 6 20 2,038 102 Sampled the supercial left and right volar forearms of six healthy subjects [40]
(right and left (four of whom were sampled again 8 to 10 months later). Samples from
volar forearm) the same subject at the same time point (left versus right) were not
signicantly dierent, whereas samples from the same subject at dierent
time points could be signicantly dierent
Skin 51 102 351,630 3,251 Collected skin swabs from the left and right palms of 51 volunteers. On [5]
(right and average, individuals shared only 17% of species-level phylotypes between
left palms) their right and left palms, while only 13% of species-level phylotypes were
shared between dierent individuals. (UniFrac similarity between hands from
dierent individuals = 0.30, and the same individual = 0.36 to 0.38.) Palm
surface bacterial community structure was determined by handedness, time
since washing, and the individual’s sex
Skin 10 300 112,283 374 Obtained samples from 20 skin sites on each of 10 individuals (half of whom [18]
(20 skin sites, were sampled twice). They found that interpersonal variation in community
including moist, membership and structure depended on skin site, and that subjects were
dry, and more similar to themselves (site-to-site) than to others. Four of the ve
sebaceous sites) re-sampled subjects were also more similar to themselves over time than they
were to other volunteers. Bacterial community composition was shaped by
microhabitat: sebaceous, moist, or dry
Gut 3 18 11,831 657 Interpersonal and site-to-site variation in three subjects at six sites. [4]
Between subject dissimilarity was greater than within subject dissimilarity
Gut 154 281 1,947,381 6,930 Interpersonal variation was found to be largest between unrelated individuals, [6]
smaller between children and their mothers, still smaller between twins, and
dramatically smaller in the same individual over time. (Average UniFrac distance
over time within-individual = 0.69 and between unrelated individuals = 0.80)
(b) Microbial communities and human disease
Obesity 12 subjects 50 18,348 367 Obese people have fewer Bacteroidetes (5%; P < 0.001) and more Firmicutes [14]
2 controls (85%; P = 0.002) than lean controls (25% Bacteroidetes and 75% Firmicutes).
During the diet, the relative abundance of Bacteroidetes increased from 5 to 20%
(P < 0.001) and the abundance of Firmicutes decreased from 85 to 75% (P = 0.002).
Increased abundance of Bacteroidetes correlated with percentage loss of body
weight (R
2
= 0.8 for the CARB-R diet and 0.5 for the FAT-R diet, P < 0.05), and not
with changes in dietary calorie content over time (R
2
= 0.06 for the CARB-R diet
and 0.09 for the FAT-R diet)
Diabetes 10 Diabetic patients 20 382,229 37,001 The proportion of Firmicutes was signicantly higher (P = 0.03) in the controls [41]
10 healthy subjects* 357,782 (mean 56.4%) compared to the diabetic group (mean 36.8%). Accordingly, phyla
Bacteroidetes and Proteobacteria were somewhat but not signicantly enriched
in the diabetic group (50.4 and 4.1% in the diabetic group compared with 35.1
and 2.7% in the healthy group, respectively)
Crohn’s 6 CD patients 16 1,590 207 Proteobacteria were signicantly (P = 0.0007) increased in CD patients (13%) [42]
disease 5 UC patients 678 versus UC patients (9.4%) or healthy subjects (8.5%). Bacteroidetes were far
(CD) and 5 healthy subjects 1,037 less diverse than Firmicutes, containing only 32 phylotypes, versus 87 species-
ulcerative level phylotypes in the latter phylum, but were nevertheless the most abundant,
colitis (UC) representing over 70% of total clones. Bacteroidetes were signicantly increased
(75%) in CD patients versus UC patients (64.3%) or healthy subjects (67.4%) The
increase in Bacteroidetes and Proteobacteria was accompanied by a signicant
(P = 0.0001) decrease in Firmicutes (CD,10%; UC, 25.8%; healthy subjects, 24%), all
belonging to the class Clostridia in the CD group
Continued overleaf
Kuczynski et al. Genome Biology 2010, 11:210
/>Page 4 of 9
Table 1. Continued
Total
number Average
Number of 16S number of
Number of sequences sequences
of samples in nal per
Topic subjects sequenced analysis sample Study conclusions Reference
CD and 20 CD patients 49 809 35 The results obtained from CD and healthy subject samples did not dier [43]
UC 15 UC patients 691 (P > 0.05). Bacterial numbers associated with non-inamed and inamed
14 healthy subjects 235 mucosa within CD and UC groups did not dier (P > 0.05). The ratio of
Actinobacteria:Bacteroidetes:Firmicutes: Proteobacteria diered between
healthy (approximately 1:27:53:6%), UC (approximately 0.3:34:48:7%) and CD
subjects (approximately 0.5:34:40.5:6%)
CD and 190 CD, UC or 190 15,172 80 Bacteroidetes (10%, P = 0.001) and Firmicutes (20%, P = 0.001) were greatly [44]
UC healthy patients depleted while Actinobacteria (10%, P = 0.001) and Proteobacteria (50%,
(around equal P = 0.001) were substantially more abundant in the inammatory bowel
numbers) disease (IBD) subset samples, relative to control subset samples (approximately
20% Bacteroidetes, approximately 50% Firmicutes, approximately
5% Actinobacteria, approximately 10% Proteobacteria)
Necrotizing 10 infants 21 5,354 255 For the control infants four phyla were present: Proteobacteria, (34.97% relative [45]
enterocolitis with NEC and abundance), Firmicutes (57.79%), Bacteroidetes (2.45%) and Fusobacteria (0.54%)
(NEC) 10 healthy infants with 4.25% unclassied bacteria. However, NEC patients had only two phyla,
Proteobacteria (90.72%) and Firmicutes (9.12%) with 0.16% unclassied bacteria.
The average proportion of Proteobacteria was signicantly increased and the
average proportion of Firmicutes was signicantly decreased compared to
controls (P = 0.001)
Clostridium 4 ICD patients 10 581 143 Using rarefaction curves, species richness in the patients with ICD (initial [46]
dicile- 3 RCD patients 447 episode of antibiotic-associated diarrhea due to C. dicile) was similar to that
associated 3 healthy subjects 399 in the control subjects, with the shape of the curve revealing that the total
diarrhea richness of the microbial community had not been completely sampled
(CDAD) (minimum of 20 phylotypes). However, the species richness in the patients
with RCD (recurrent antibiotic associated diarrhea due to C. dicile ) was
consistently lower (around ten phylotypes) than both that in the patients with
ICD and that in the control subjects
Gastric 10 non-cardia 15 140 9 No signicant dierences in microbial compositions were found between [47]
cancer gastric cancer patients cancer patients and controls
5 control patients
Helicobacter 19 H. pylori (+) 23 1,833 80 Subjects negative for H. pylori had twice as many Fusobacteria as H. pylori- [48]
pylori subjects positive subjects (10% compared to 5%, respectively). Twenty percent of the
colonization 4 H. pylori (-) clone libraries derived from H. pylori-positive patients were non-H. pylori
subjects Proteobacteria compared with 10% in the control subjects; this was also the
case for Bacteroidetes (20% compared with 10% in the control)
(c) Experimentally manipulated microbial communities
Restoration 3 agriculture 13 1,235 95 A signicant dierence in the Proteobacteria:Acidobacteria ratio from around [22]
of wetland wetlands, 0.6 to around 0.4 was observed between agricultural and reference wetlands,
soils 3 restored respectively (P < 0.001). A dierence was also found in the relative abundance
wetlands and of β-Proteobacteria from 14 to 3% in the same soils (P < 0.001)
3 reference wetlands
Soil 4 wet and 8 665 83 The relative abundance of Proteobacteria decreased from 48 to 36% in wet [21]
moisture 4 dry soils versus dry plots (P < 0.05). Acidobacteria increased in relative abundance from
7 to 23% in the same soils (P < 0.01)
Antibiotic 6 control pigs 12 1,900 171 An eect of antibiotics was seen on the overall community composition [23]
eects on and 6 pigs (P < 0.03)
piglet gut treated with
microbiota chlor-tetracycline
Eects of a 4 to 5 fasted 38 145,428 3,827 The fast resulted in a signicant increase in the proportion of Bacteroidetes [49]
24-hour fast and control mice (approximately 21 to approximately 42%, P = 0.01) and a signicant decrease
on mouse gut in the fraction of Firmicutes (approximately 77 to around 53%, P = 0.007) within
microbiota the gut microbial community
Eects of diet 5 individuals 20 25,790 1,290 The relative abundance of Bacteroidetes decreased (around 90% versus [50]
and from 2 genotypes around 40%) in animals fed the high-fat diet regardless of genotype (P < 0.001).
genotype on fed standard Likewise, mice fed the standard chow diet showed a lower relative abundance of
murine gut or low-fat chow Firmicutes (around 7 versus around 42) independent of genotype (P < 0.001)
microbiota
Antibiotic 5 dogs 15 44,096 2,940 Enterococcus-like organisms, Pasteurella species, and Dietzia species all [51]
eects on sampled increased signicantly (P < 0.05) following tylosin treatment
canine gut three times
microbiota
*The entire study consisted of 36 subjects of which only 20 were selected for pyrosequencing.
Kuczynski et al. Genome Biology 2010, 11:210
/>Page 5 of 9
Box 1: How many sequences does it take ?
Costello et al. [16] found that variation in membership of bacterial communities was primarily explained by body habitat, secondarily
by host individual (within habitats), and nally by time (within habitats and individuals). Specically, variation in species composition
measured using the unweighted UniFrac metric was 1.19 times larger between habitats than within habitats. Within habitats, interpersonal
variation was 1.15 times larger than variation within individuals over time. Within habitats and individuals, variation over 3 months was
1.06 times larger than variation over 24 hours. Thus, the smallest eect size observed showed that samples collected 24 hours apart were
signicantly more similar to each other than to those collected 3 months apart.
The inuence of sequencing depth on the ability to recapture these dierences can be conveniently tested by simulating the eects
of sampling fewer sequences and then performing comparisons of bacterial community membership using the unweighted UniFrac
metric [26]. The UniFrac metric measures the dierence between two communities in terms of the amount of evolutionary history that
is unique to either of the two: for a pair of communities, the sum of the lengths of the branches on a phylogenetic tree that leads only
to members of one community divided by the sum of the lengths of the branches that lead to members of either community yields
the UniFrac distance between the communities [26]. Using the QIIME (Quantitative Insights Into Microbial Ecology) software package,
we randomly drew sequences from samples at various depths below the original study’s 1,315 ± 420 (standard deviation) sequences
per sample, then calculated UniFrac distance between all pairs of samples. Using only ten sequences per sample, the main results of the
original study were recovered: variation between samples was most prominent for samples from dierent body habitats; and for the same
body habitat, samples originating from dierent individuals varied more than samples originating from the same indivdual over time.
The original study [16] also found that among samples from the same body habitat on the same individual, samples varied more when
separated by 3months than when separated by only 24 hours; our reanalysis using only 10 sequences per sample only suggested this
result (Figure2a,b).
These same UniFrac distances can be used with the program PRIMER v6 [27] to assess the partitioning of the variability in distances in
multivariate space using nested models and PERMANOVA [28], a technique that uses label permutations to estimate the distribution of
their test statistics under the null hypothesis that within-group distances are not signicantly dierent from between-group distances.
In this analysis, PERMANOVA uses the UniFrac distances to compute a test statistic similar to an F-ratio, and then reports both the
signicance of the statistic and the portion of variation explained by each nested level of factor. Figure 2c shows the portion of variation
explained in PERMANOVA in response to sequencing depth when run with the default settings using the nested experimental design
Month(Person(Habitat)), featuring Habitat as the highest hierarchical level. Remarkably, this analysis shows that a relatively low sequencing
depth is sucient to allow us to partition variability in bacterial community membership among the various factors in our experimental
design, and to rank correctly the relative importance of these factors. For example, the observation that bacterial community composition
varied less over 24 hours than over 3 months became signicant when 50 or more sequences per sample were obtained (PERMANOVA
Monte Carlo P < 0.001). These results are consistent with previous work from several groups showing that broad-scale trends in microbial
community analysis can be recaptured with samples consisting of only a few dozen sequences [29-32].
Related techniques can be used to address the potential of using a deeply sequenced reference dataset to classify sparsely sequenced
microbial samples. This approach is likely to be increasingly relevant as sequence-based microbial ecology studies grow both in number
and in extent, and as reference databases become more extensive and user friendly. In this analysis, each narrowly dened body site from
Costello et al. [16] (for example, volar forearm, forehead, and so on) is compared with each other site. For each pair of sites, one sample
was selected: how many sequences from that sample were required to identify which of the two body sites it came from? A given depth
of sequencing (‘Seqs for 95% cluster accuracy’ in Figure 2d) was considered sucient for discrimination when it placed the test sample
closer to samples from the same body site than to samples from the other body sites under consideration more than 95% of the time. As
expected, correct discrimination in this manner requires deeper sequencing when the dierences between body sites are more subtle.
For example, body sites within the broader skin habitat, such as palm and knee, often required well over 100 sequences for discrimination,
whereas dissimilar habitats such as the oral cavity and hair rarely required more than 100 sequences for discrimination.
The eect sizes in this type of analysis can be quantied using an adaptation of the population-genetics statistic known as the ‘xation
index’, or F
ST
. F
ST
was originally used to detect genetically based population subdivision (also known as genetic dierentiation) among
populations of animals or plants within a species [33], but can easily be adapted to measure the degree of dierentiation between clusters
(or categories) of microbial communities [12]. Values of F
ST
typically range from 0 to 1, where 0 indicates no dierentiation and 1 indicates
complete dierentiation. Hudson et al. [34], following Slatkin [35], provide a simple denition of F
ST
that is easily adapted to microbial
community distance metrics such as Unifrac distances: F
ST
= (P
Between
- P
Within
)/P
Between,
where P
Between
and P
Within
represent the average Unifrac
distances between and within samples, respectively, from two categories. The F
ST
is reported as the abscissa in Figure 2d. For many pairs of
body habitats, surprisingly few sequences (often fewer than ten) are required to classify a new habitat, although with smaller eect sizes
more sequences are frequently required. It is important to note that, as with any assessment of beta diversity, these patterns are due to
dierences in the most abundant species in each sample; the eects of the rare biosphere [36] will inherently be lost as sampling depth
decreases. However, the importance of rare species (that is, alpha diversity) in human body habitats generally has yet to be shown. If rare
species do turn out to correlate better with physiological states than does overall community composition, deeper sequencing will be
required. However, overall patterns can be recovered with surprisingly few reads, and a focus on the common species that make up most
of the biomass has been useful in many other ecosystems as well.
Kuczynski et al. Genome Biology 2010, 11:210
/>Page 6 of 9
antibiotics on overall community composition were evident
with as few as 96 sequences per sample [23]. It would be
fascinating to test whether similar antibiotic-induced effects
in outbred populations of humans with diverse diets [24] can
be found with relatively few sequences. Similarly, it would be
important to consider sampling depth under human
physiological conditions in cases where the effect size is
known to be large, for example, in the development of the
infant gut microbiota [25].
Has the depth of sequencing used up to now really
been necessary?
e literature reviewed in Table 1 reports how many
sequences were used to reveal a variety of different
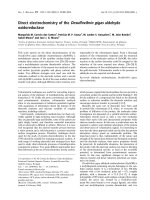
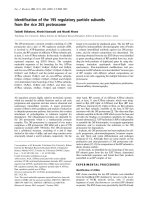
Figure 2. Variation in human body habitats within and between people. (a) The full dataset (approximately 1,500 sequences per sample);
(b) the dataset sampled at only 10 sequences per sample, showing the same pattern; (c) the relationship between sequencing depth and the
PERMANOVA component of variation. The amount of variation explained by the factors plateaus at relatively shallow sequencing depths. Note
that the proportion of variation captured by dierences between the samples (that is, residual variation) is still highest despite the explanatory
values of the three factors examined. (d) Eect size determines the number of sequences required for sample identication. Each point in the
gure represents a specic sample selected from a pair of body sites, and the number of sequences required to correctly distinguish which site the
sample originated from. The point is colored according to the two body sites under consideration, the center’s color represents the broad category
the selected sample originated from, the border color represents the other broad category under consideration. Many body sites share the same
broad category, and thus some points have the same border and center coloring. Red, external ear canal; yellow, hair; green, oral cavity; blue, gut;
magenta, skin; gray, nostril. ns, not signicant.
(c) (d)
(a)
0.4
0.5
0.6
0.7
0.8
0.9
Habitats People Months
UniFrac distance
Variation within
Variation between
(b)
0.4
0.5
0.6
0.7
0.8
0.9
Habitats People Months
[
ns
-0.1
0
10
0
10
1
10
2
10
3
0.1
0.2
0.3
0.4
0.5
0 0.1 0.2 0.3 0.4 0.5 250 500 750 1000 1250 1500
PERMANOVA component of variation
Seqs for 95% cluster accuracy
Number of sequences Effect size
Habitat
Person(Habitat)
Month(Person(Habitat))
Sample
Kuczynski et al. Genome Biology 2010, 11:210
/>Page 7 of 9
effects. Could the same results have been achieved with
less sequencing? To begin to address this question, we
carried out a limited reanalysis of a study of multiple
body habitats by Costello et al. [16], which encompasses
variability explained by nested factors with different effect
sizes (Box 1).
In conclusion, the results described here, and pre-
viously reported [8,37], show that arbitrarily choosing to
generate large numbers of sequences may not be the
most cost-effective way to identify changes in microbial
communities associated with different physiological or
pathophysiological states. Instead, we call for a few stan-
dard ized methods to assess differences among microbial
communities, which will allow for effect size and power
calculations, and therefore a considered assessment of
the number of individuals and sequences required to
differentiate among given communities. e following
four methods have been successful in a range of studies:
differences in alpha diversity (number of phylotypes
observed or extrapolated); differences in abundance of
specific lineages; differences in location on a principal
coordinates plot obtained from UniFrac distances or
other metrics; and the F
ST
measure described in the
previous section.
e rapid increase in sequencing capacity provides a
spectacular opportunity to advance the field in ways
that were unimaginable even 3 years ago. How can
individual investigators, or groups of investigators, use
these resources most wisely at this unique moment of
democratization of the ability to perform sequence-
based studies? e data summarized here suggest that
study designs consisting of tens of thousands of samples
sequenced at shallow coverage will be highly informative
(depending on the effect size), and such studies are
possible with the instruments available today. Given
recent observations that inter-habitat and inter-
personal variations are large effects, we believe that
individual researchers can and should sieze the
opportunity provided by these findings to analyze vast
numbers of samples at low-coverage (for example, 100
to 1,000 sequences). At this number of samples, detailed
explora tion of spatial and temporal dynamics of
microbial communities will be possible, as will
comparisons of large patient populations. In addition,
replicate samples can be acquired and analyzed without
too strongly impairing the breadth of an investigation,
allowing more robust experimental designs to be
implemented. One can envisage that perhaps within the
next few years, a group of motivated high-school
students might, for a science-fair project, be able to
track movements in microbes between humans and
their pets and livestock across the planet. ese studies,
especially when combined with hypothesis-driven
approches to understanding the effects of factors such
as diet and antibiotic exposure, could go far beyond
even the largest purely observational studies being
contemplated today.
Such studies will yield an overall map of variation
within the human microbial ecosystem, and relate
differences to specific physiological states within and
between individuals in a manner that is replicated across
individuals. ese studies will serve as a framework to
identify and compare the shifts that take place in the
microbial community that are related to specific disorders.
Acknowledgements
We thank the Crohn’s and Colitis Foundation of America, the Bill and Melinda
Gates Foundation, the HHMI and the NIH for support of work by the authors
cited in this review.
Author details
1
Department of Molecular, Cellular and Developmental Biology,
3
Institute
of Arctic and Alpine Research (INSTAAR),
4
Cooperative Institute for Research
in Environmental Sciences (CIRES),
5
Department of Computer Science,
9
Department of Chemistry and Biochemistry, University of Colorado, Boulder,
CO 80309, USA.
2
Department of Microbiology and Immunology, Stanford
University, Stanford, CA 94305, USA.
6
Department of Microbiology, Cornell
University, Ithaca, NY 14853, USA.
7
Department of Biology, San Diego
State University, San Diego, CA 92182, USA.
8
Center for Genome Sciences,
Washington University School of Medicine, St Louis, MO 63108, USA.
10
Howard
Hughes Medical Institute, University of Colorado, Boulder, CO 80309, USA
Published: 5 May 2010
References
1. Margulies M, Egholm M, Altman WE, Attiya S, Bader JS, Bemben LA, Berka J,
Braverman MS, Chen YJ, Chen Z, Dewell SB, Du L, Fierro JM, Gomes XV,
Godwin BC, He W, Helgesen S, Ho CH, Irzyk GP, Jando SC, Alenquer ML, Jarvie
TP, Jirage KB, Kim JB, Knight JR, Lanza JR, Leamon JH, Lefkowitz SM, Lei M, Li J,
et al.: Genome sequencing in microfabricated high-density picolitre
reactors. Nature 2005, 437:376-380.
2. Van Houte J, Gibbons RJ: Studies of the cultivable flora of normal human
feces. Antonie Van Leeuwenhoek 1966, 32:212-222.
3. Turnbaugh PJ, Ley RE, Hamady M, Fraser-Liggett CM, Knight R, Gordon JI: The
human microbiome project. Nature 2007, 449:804-810.
4. Eckburg PB, Bik EM, Bernstein CN, Purdom E, Dethlefsen L, Sargent M, Gill SR,
Nelson KE, Relman DA: Diversity of the human intestinal microbial flora.
Science 2005, 308:1635-1638.
5. Fierer N, Hamady M, Lauber CL, Knight R: The influence of sex, handedness,
and washing on the diversity of hand surface bacteria. Proc Natl Acad Sci
USA 2008, 105:17994-17999.
6. Turnbaugh PJ, Hamady M, Yatsunenko T, Cantarel BL, Duncan A, Ley RE, Sogin
ML, Jones WJ, Roe BA, Aourtit JP, Egholm M, Henrissat B, Heath AC, Knight R,
Gordon JI: A core gut microbiome in obese and lean twins. Nature 2009,
457:480-484.
7. Qin J, Li R, Raes J, Arumugam M, Burgdorf KS, Manichanh C, Nielsen T, Pons N,
Levenez F, Yamada T, Mende DR, Li J, Xu J, Li S, Li D, Cao J, Wang B, Liang H,
Zheng H, Xie Y, Tap J, Lepage P, Bertalan M, Batto JM, Hansen T, Le Paslier D,
Linneberg A, Nielsen HB, Pelletier E, Renault P, et al: A human gut microbial
gene catalogue established by metagenomic sequencing. Nature,
464:59-65.
8. Hamady M, Knight R: Microbial community profiling for human
microbiome projects: Tools, techniques, and challenges. Genome Res 2009,
19:1141-1152.
9. Legendre P, Gallagher ED: Ecologically meaningful transformations for
ordinations of species data. Oecologia 2001, 129:271-280.
10. Lozupone CA, Knight R: Species divergence and the measurement of
microbial diversity. FEMS Microbiol Rev 2008, 32:557-578.
11. Magurran AE: Measuring Biological Diversity. Oxford: Blackwell; 2004.
12. Martin AP: Phylogenetic approaches for describing and comparing the
diversity of microbial communities. Appl Environ Microbiol 2002,
68:3673-3682.
Kuczynski et al. Genome Biology 2010, 11:210
/>Page 8 of 9
13. Ley RE, Backhed F, Turnbaugh P, Lozupone CA, Knight RD, Gordon JI: Obesity
alters gut microbial ecology. Proc Natl Acad Sci USA 2005, 102:11070-11075.
14. Ley RE, Turnbaugh PJ, Klein S, Gordon JI: Microbial ecology: human gut
microbes associated with obesity. Nature 2006, 444:1022-1023.
15. Turnbaugh PJ, Ley RE, Mahowald MA, Magrini V, Mardis ER, Gordon JI:
An obesity-associated gut microbiome with increased capacity for energy
harvest. Nature 2006, 444:1027-1031.
16. Costello EK, Lauber CL, Hamady M, Fierer N, Gordon JI, Knight R: Bacterial
Community variation in human body habitats across space and time.
Science 2009, 326:1694-1697.
17. Fierer N, Lauber CL, Zhou N, McDonald D, Costello EK, Knight R: Forensic
identification using skin bacterial communities. Proc Natl Acad Sci USA 2010,
107:6477-6481.
18. Grice EA, Kong HH, Conlan S, Deming CB, Davis J, Young AC; NISC
Comparative Sequencing Program, Bouard GG, Blakesley RW, Murray PR,
Green ED, Turner ML, Segre JA.: Topographical and temporal diversity of the
human skin microbiome. Science 2009, 324:1190-1192.
19. Backhed F, Ding H, Wang T, Hooper LV, Koh GY, Nagy A, Semenkovich CF,
Gordon JI: The gut microbiota as an environmental factor that regulates
fat storage. Proc Natl Acad Sci USA 2004, 101:15718-15723.
20. Ley RE: Obesity and the human microbiome. Curr Opin Gastroenterol,
26:5-11.
21. Castro HF, Classen AT, Austin EE, Norby RJ, Schadt CW: Soil microbial
community responses to multiple experimental climate change drivers.
Appl Environ Microbiol 2010, 76:999-1007.
22. Hartman WH, Richardson CJ, Vilgalys R, Bruland GL: Environmental and
anthropogenic controls over bacterial communities in wetland soils. Proc
Natl Acad Sci USA 2008, 105:17842-17847.
23. Rettedal E, Vilain S, Lindblom S, Lehnert K, Scoeld C, George S, Clay S,
Kaushik RS, Rosa AJ, Francis D, Brözel VS: Alteration of the ileal microbiota of
weanling piglets by the growth-promoting antibiotic chlortetracycline.
Appl Environ Microbiol 2009, 75:5489-5495.
24. Dethlefsen L, Huse S, Sogin ML, Relman DA: The pervasive effects of an
antibiotic on the human gut microbiota, as revealed by deep 16S rRNA
sequencing. PLoS Biol 2008, 6:e280.
25. Palmer C, Bik EM, Digiulio DB, Relman DA, Brown PO: Development of the
human infant intestinal microbiota. PLoS Biol 2007, 5:e177.
26. Lozupone C, Knight R: UniFrac: a new phylogenetic method for comparing
microbial communities. Appl Environ Microbiol 2005, 71:8228-8235.
27. Clarke KR, Gorley RN: Primer v6 [ />28. Anderson MJ: Distance-based tests for homogeneity of multivariate
dispersions. Biometrics 2006, 62:245-253.
29. Lozupone CA, Knight R: Global patterns in bacterial diversity. Proc Natl Acad
Sci USA 2007, 104:11436-11440.
30. Ley RE, Lozupone CA, Hamady M, Knight R, Gordon JI: Worlds within worlds:
evolution of the vertebrate gut microbiota. Nat Rev Microbiol 2008,
6:776-788.
31. Tamames J, Abellan JJ, Pignatelli M, Camacho A, Moya A: Environmental
distribution of prokaryotic taxa. BMC Microbiol 2010, 10:85.
32. Auguet JC, Barberan A, Casamayor EO: Global ecological patterns in
uncultured Archaea. ISME J 2010, 4:182-190.
33. Holsinger KE, Weir BS: Genetics in geographically structured populations:
defining, estimating and interpreting F(ST). Nat Rev Genet 2009, 10:639-650.
34. Hudson RR, Slatkin M, Maddison WP: Estimation of levels of gene flow from
DNA sequence data. Genetics 1992, 132:583-589.
35. Slatkin M: Inbreeding coefficients and coalescence times. Genet Res 1991,
58:167-175.
36. Sogin ML, Morrison HG, Huber JA, Mark Welch D, Huse SM, Neal PR, Arrieta
JM, Herndl GJ: Microbial diversity in the deep sea and the underexplored
‘rare biosphere’. Proc Natl Acad Sci USA 2006, 103:12115-12120.
37. Ley RE, Hamady M, Lozupone C, Turnbaugh PJ, Ramey RR, Bircher JS, Schlegel
ML, Tucker TA, Schrenzel MD, Knight R, Gordon JI: Evolution of mammals and
their gut microbes. Science 2008, 320:1647-1651.
38. Nasidze I, Li J, Quinque D, Tang K, Stoneking M: Global diversity in the
human salivary microbiome. Genome Res 2009, 19:636-643.
39. Zaura E, Keijser BJ, Huse SM, Crielaard W: Defining the healthy ‘core
microbiome’ of oral microbial communities. BMC Microbiol 2009, 9:259.
40. Gao Z, Tseng CH, Pei Z, Blaser MJ: Molecular analysis of human forearm
superficial skin bacterial biota. Proc Natl Acad Sci USA 2007, 104:2927-2932.
41 Larsen N, Vogensen FK, van den Berg FW, Nielsen DS, Andreasen AS,
Pedersen BK, Al-Soud WA, Sorensen SJ, Hansen LH, Jakobsen M: Gut
microbiota in human adults with type 2 diabetes differs from non-diabetic
adults. PLoS One, 5:e9085.
42. Gophna U, Sommerfeld K, Gophna S, Doolittle WF, Veldhuyzen van Zanten SJ:
Differences between tissue-associated intestinal microfloras of patients
with Crohn’s disease and ulcerative colitis. J Clin Microbiol 2006,
44:4136-4141.
43. Bibiloni R, Mangold M, Madsen KL, Fedorak RN, Tannock GW: The
bacteriology of biopsies differs between newly diagnosed, untreated,
Crohn’s disease and ulcerative colitis patients. J Med Microbiol 2006,
55:1141-1149.
44. Frank DN, St Amand AL, Feldman RA, Boedeker EC, Harpaz N, Pace NR:
Molecular-phylogenetic characterization of microbial community
imbalances in human inflammatory bowel diseases. Proc Natl Acad Sci USA
2007, 104:13780-13785.
45. Wang Y, Hoenig JD, Malin KJ, Qamar S, Petrof EO, Sun J, Antonopoulos DA,
Chang EB, Claud EC: 16S rRNA gene-based analysis of fecal microbiota
from preterm infants with and without necrotizing enterocolitis. ISME J
2009, 3:944-954.
46. Chang JY, Antonopoulos DA, Kalra A, Tonelli A, Khalife WT, Schmidt TM, Young
VB: Decreased diversity of the fecal microbiome in recurrent Clostridium
difficile-associated diarrhea. J Infect Dis 2008, 197:435-438.
47. Dicksved J, Lindberg M, Rosenquist M, Enroth H, Jansson JK, Engstrand L:
Molecular characterization of the stomach microbiota in patients with
gastric cancer and in controls. J Med Microbiol 2009, 58:509-516.
48. Bik EM, Eckburg PB, Gill SR, Nelson KE, Purdom EA, Francois F, Perez-Perez G,
Blaser MJ, Relman DA: Molecular analysis of the bacterial microbiota in the
human stomach. Proc Natl Acad Sci USA 2006, 103:732-737.
49. Crawford PA, Crowley JR, Sambandam N, Muegge BD, Costello EK, Hamady M,
Knight R, Gordon JI: Regulation of myocardial ketone body metabolism by
the gut microbiota during nutrient deprivation. Proc Natl Acad Sci USA 2009,
106:11276-11281.
50. Hildebrandt MA, Homann C, Sherrill-Mix SA, Keilbaugh SA, Hamady M, Chen
YY, Knight R, Ahima RS, Bushman F, Wu GD: High-fat diet determines the
composition of the murine gut microbiome independently of obesity.
Gastroenterology 2009, 137:1716-1724.
51. Suchodolski JS, Dowd SE, Westermarck E, Steiner JM, Wolcott RD, Spillmann T,
Harmoinen JA: The effect of the macrolide antibiotic tylosin on microbial
diversity in the canine small intestine as demonstrated by massive parallel
16S rRNA gene sequencing. BMC Microbiol 2009, 9:210.
doi:10.1186/gb-2010-11-5-210
Cite this article as: Kuczynski J, et al.: Direct sequencing of the human
microbiome readily reveals community differences. Genome Biology 2010,
11:210.
Kuczynski et al. Genome Biology 2010, 11:210
/>Page 9 of 9