The MEMS Handbook Introduction & Fundamentals (2nd Ed) - M. Gad el Hak Part 13 pptx
Bạn đang xem bản rút gọn của tài liệu. Xem và tải ngay bản đầy đủ của tài liệu tại đây (251.56 KB, 30 trang )
Example
As a simple example, consider the differential equation:
x
ϩ x ϭ 0
x(0) ϭ 0 (14.3)
x
.
(0) ϭ 1
Taking the Laplace transform of the equation yields:
s
2
X(s) Ϫ sx(0) Ϫ x
.
(0) ϩ X(s) ϭ 0 (14.4)
Algebraic manipulation gives:
X(s) ϭ
(14.5)
Consequently, from the table of Laplace transform pairs:
x(t) ϭ sin(t) (14.6)
For more examples, see Ogata (1997), Raven (1995), Kuo (1995), and Franklin et al. (1994).
Due to the convolution property of Laplace transforms, aconvenient representation of a linear control
system is the block diagram illustrated in Figure 14.1.In such a block diagram, each block contains the
Laplace transform of the differential equation representing that component of the control system that
relates the block’s input to its output. Arrows between blocks indicate that the output from the preceding
block is transferred to the input of the subsequent block. The output of the preceding block multiplies
the contents of the block to which it is an input. Simple algebra will yield the overall transfer function of
a block diagram representation for a system.
1
ᎏ
s
2
ϩ 1
Fundamentals of Control Theory 14-3
TABLE 14.1 Laplace Transform Pairs for Basic Functions
F(t) F(s)
1 Unit impulse,
δ
(t) 1
2 Unit step, 1(t)
3 t
4 t
n
, n ϭ 1, 2, 3, …
5 e
Ϫat
6 t
n
e
Ϫat
7 sin
ω
t
8 cos
ω
t
9 e
Ϫat
cos bt
10 e
Ϫat
sin bt
b
ᎏᎏ
(s + a)
2
+ b
2
s + a
ᎏᎏ
(s + a)
2
+ b
2
s
ᎏ
s
2
+
ω
2
ω
ᎏ
s
2
+
ω
2
n!
ᎏ
(s + a)
n+1
1
ᎏ
s ϩ a
n!
ᎏ
s
nϩ1
1
ᎏ
s
2
1
ᎏ
s
© 2006 by Taylor & Francis Group, LLC
Example
The transfer function for the system illustrated in Figure 14.2 can be computed by observing that:
E(s) ϭ R(s) Ϫ Y(s)S(s) (14.7)
and
Y(s) ϭ E(s)C(s)A(s)P(s) (14.8)
which can be combined to yield
ϭ
(14.9)
A more complete exposition on block diagram algebra can be found in any of the previously cited
undergraduate texts. Note that the numerator and denominator of the transfer function will typically be
polynomials in s.The denominator is called the characteristic equation for the system. As entry 5 in Table
14.1 shows, if the characteristic polynomial has any roots with a positive real part, then the system will be
unstable because it will correspond to an exponentially increasing solution. Given a reference input R(s),
determine the response of the system by multiplying the transfer function by the reference input, and
perform a partial fraction expansion (i.e., expand):
Y(s) ϭ ϭ ϩ ϩ
…
ϩ
(14.10)
where each term in the sum on the right-hand side of the equation is similar to one of the entries in Table
14.1. The contribution to the response of each individual term can be determined by referring to a
Laplace transform table and can be superimposed to determine the overall solution:
y(t) ϭ y
1
(t) ϩ y
2
(t) ϩ
…
ϩ y
n
(t) (14.11)
where each term in the sum is the inverse Laplace transform of the corresponding term in the partial
fraction expansion.
C
n
ᎏ
s Ϫ p
n
C
2
ᎏ
s Ϫ p
2
C
1
ᎏ
s Ϫ p
1
R(s)C(s)A(s)P(s)
ᎏᎏᎏ
1 ϩ C(s)A(s)P(s)S(s)
C(s)A(s)P(s)
ᎏᎏᎏ
1 ϩ C(s)A(s)P(s)S(s)
Y(s)
ᎏ
R(s)
14-4 MEMS: Introduction and Fundamentals
Input
Controller
Process
Output
Sensor
Actuator
−
+
FIGURE 14.1 Typical block diagram representation of a control system.
R(s)
E(s)
C(s)
P(s)
Y(s)
S(s)
A(s)
−
+
FIGURE 14.2 Generic block diagram including transfer functions.
© 2006 by Taylor & Francis Group, LLC
Example
For the block diagram in Figure 14.2 if C(s) ϭ , A(s) ϭ 1, P(s) ϭ ,S(s) ϭ 1 and R(s) ϭ
(a unit step input), then:
Y(s) ϭ
ϭ Ϫ
ϭϪ Ϫ
ϭϪ Ϫ
(14.12)
where
ω
d
ϭ
ω
n
͙
1Ϫ
ෆ
ζ
2
ෆ
.Referring to Table 14.1 of Laplace transform pairs and assuming that
ζ
Ͻ 1,
y(t) ϭ 1 Ϫ e
Ϫ
ζω
n
t
cos(
ω
d
t) ϩ sin(
ω
d
t)
(14.13)
14.2.2 Control System Analysis and Design
Control system analysis and design consider primarily stability and performance. The stability of a
system with the closed-loop transfer function (note that in such a case a controller has already been
specified):
T(s) ϭ
(14.14)
is determined by the roots of the denominator, or characteristic equation. It is possible to determine
whether the system is stable without actually computing the roots of the characteristic equation. A nec-
essary condition for stability is that each of the coefficients a
i
appearing in the characteristic equation be
positive. Because this is a necessary condition, if any of the a
i
are negative, then the system is unstable, but
the converse is not necessarily true. Even if all the a
i
are positive, the system may still be unstable. Routh
(1975) devised a method to check necessary and sufficient conditions for stability.
The method is to construct the Routh array, defined as follows:
Row n s
n
: 1 a
2
a
4
…
Row nϪ1 s
nϪ1
: a
1
a
3
a
5
…
Row nϪ2 s
nϪ2
: b
1
b
2
b
3
…
Row nϪ3 s
nϪ3
: c
1
c
2
c
3
…
Ӈ Ӈ Ӈ Ӈ Ӈ Ӈ
Row 2 s
2
: * *
Row 1 s
1
: *
Row 0 s
0
: *
b
0
s
m
ϩ b
1
s
mϪ1
ϩ
…
ϩ b
m
ᎏᎏᎏ
s
n
ϩ a
1
s
nϪ1
ϩ
…
ϩ a
n
ζ
ᎏ
͙1
ෆ
Ϫ
ෆ
ζ
ෆ
2
ෆ
ω
d
ᎏᎏ
(s ϩ
ζω
n
)
2
ϩ
ω
d
ζω
n
ᎏ
ω
d
s ϩ
ζω
n
ᎏᎏ
(s ϩ
ζω
n
)
2
ϩ
ω
d
1
ᎏ
s
ζω
n
ᎏᎏ
(s ϩ
ζω
n
)
2
ϩ
ω
d
s ϩ
ζω
n
ᎏᎏ
(s ϩ
ζω
n
)
2
ϩ
ω
d
1
ᎏ
s
s ϩ 2
ζω
n
ᎏᎏ
s
2
ϩ 2
ζω
n
s ϩ
ω
2
n
1
ᎏ
s
ω
2
n
ᎏᎏ
s(s
2
ϩ 2
ζω
n
s ϩ
ω
2
n
)
1
ᎏ
s
ω
2
n
ᎏ
s ϩ 2
ζω
n
1
ᎏ
s
Fundamentals of Control Theory 14-5
© 2006 by Taylor & Francis Group, LLC
in which the a
i
are from the denominator of Equation (14.14). b
i
and c
i
are defined as:
The basic result is that the number of poles in the right-half plane (i.e., unstable solutions) is equal
to the number of sign changes among the elements in the first column of the Routh array. If they are all
positive, the system is stable. When a zero is encountered, it should be replaced with a small positive con-
stant
ε
which will then be propagated to lower rows in the array. The result can be obtained by taking the
limit as
ε
→ 0.
Example
Construct the Routh array and determine the stability of the system described by the transfer function:
ϭ
(14.15)
The Routh array is
s
4
: 1 9 8
s
3
: 4 10 0
s
2
:
ϭ 26 ϭ 32
0 (14.16)
s
1
:
ϭ 33 0 0
s
0
:
ϭ 40.6 0 0
The system is stable because there are no sign changes in the elements in the first column of the array.
One aspect of performance concerns the steady-state error exhibited by the system. For example, from
the time-domain solution of the previous example, as t →
∞
, y(t) → 1. However, the final value theorem
can be used to determine this without actually solving for the time-domain solution.
Example
Determine the steady-state value for the time-domain function y(t) if its Laplace transform is given by
Y(s) ϭ
ω
2
n
/s(s
2
ϩ 2
ζω
n
s ϩ
ω
2
n
). Because all the solutions of s
2
ϩ 2
ζω
n
s ϩ
ω
2
n
ϭ 0 have a negative real part,
all the poles of sY(s) lie in the left half of the complex plane. Therefore, the final value theorem can be
applied to yield:
lim
t→∞
y(t) ϭ lim
s→0
sY(s) ϭ lim
s→0
s ϭ 1 (14.17)
which is identical to the limit of the time-domain solution as t →
∞
.
ω
2
n
ᎏᎏ
s(s
2
ϩ 2
ζω
n
s ϩ
ω
2
n
)
Ϫ(0 Ϫ 1056)
ᎏᎏ
26
Ϫ(128 Ϫ 260)
ᎏᎏ
4
Ϫ(0 Ϫ 32)
ᎏᎏ
1
Ϫ(10 Ϫ 36)
ᎏᎏ
1
1
ᎏᎏᎏ
s
4
ϩ 4s
3
ϩ 9s
2
ϩ 10s ϩ 8
Y(s)
ᎏ
R(s)
14-6 MEMS: Introduction and Fundamentals
b
1
ϭ Ϫ
det
΄ ΅
a
1
a
2
a
3
1
a
1
b
2
ϭ Ϫ
det
΄ ΅
a
1
a
4
a
5
1
a
1
b
3
ϭ Ϫ
det
΄ ΅
a
1
a
6
a
7
1
a
1
c
1
ϭ Ϫ
det
΄ ΅
b
1
a
3
b
2
a
1
b
1
c
2
ϭ Ϫ
det
΄ ΅
b
1
a
5
b
3
a
1
b
1
c
3
ϭ Ϫ
det
΄ ΅
b
1
a
7
b
4
a
1
b
1
© 2006 by Taylor & Francis Group, LLC
14.2.2.1 Proportional–Integral–Derivative (PID) Control
Perhaps the most common control implementation is so-called proportional–integral–derivative (PID)
control, where the commanded control input (the output of the “controller” box in Figures 14.1 and 14.2)
is equal to the sum of three terms: one term proportional to the error signal (the input to the “controller”
box in Figures 14.1 and 14.2), the next term proportional to the derivative of the error signal, and the
third term proportional to the time integral of the error signal. From Figure 14.2, C(s) ϭ K
P
ϩ (K
I
/s) ϩ
K
d
s,whereK
P
is the proportional gain, K
I
is the integral gain, and K
d
is the derivative gain. A simple analy-
sis of a second-order system shows that increasing K
P
and K
I
generally increases the speed of the response
at the cost of reducing stability. Increasing K
d
generally increases damping and stability of the response.
With K
I
ϭ 0, there may be a nonzero steady-state error, but when K
I
is nonzero, the effect of the integral
control effort is to typically eliminate steady-state error.
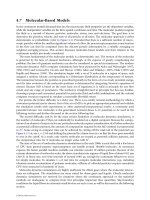
Example — PID Control of a Robot Arm
Consider a robot arm illustrated in Figure 14.3. Linearizing the equations of motion about
θ
ϭ 0 (the
configuration in Figure 14.3) gives:
I
θ
ϩ mg
θ
ϭ u (14.18)
where I is the moment of inertia of the arm, m is the mass of the arm,
θ
is the angle of the arm, and u is
atorque applied to the arm. For PID control,
u ϭ K
p
(
θ
desired
Ϫ
θ
actual
) ϩ K
d
(
θ
.
desired
Ϫ
θ
.
actual
) ϩ K
I
͵
t
0
(
θ
desired
Ϫ
θ
actual
)dt (14.19)
If I ϭ 1 and m ϭ 1/g, the block diagram representation for the system is illustrated in Figure 14.4.Thus,
the closed-loop transfer function is
T(s) ϭ
(14.20)
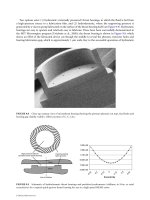
Figure 14.5 illustrates the step response of the system for proportional control (K
P
ϭ 1, K
I
ϭ 0,
K
d
ϭ 0), PD control (K
P
ϭ 1, K
I
ϭ 0, K
d
ϭ 1), and PID control (K
P
ϭ 1, K
I
ϭ 1, K
d
ϭ 1). Note that for
proportional and PD controls, there is a final steady-state error that is eliminated with PI control. (Also
note that both of these facts could be verified analytically using the final value theorem.) Finally, note that
K
d
s
2
ϩ K
p
s ϩ K
I
ᎏᎏᎏ
s
3
ϩ K
d
s
2
ϩ (K
p
ϩ I)s ϩ K
I
Fundamentals of Control Theory 14-7
,
FIGURE 14.3 Robot arm model.
© 2006 by Taylor & Francis Group, LLC
the system response for pure proportional control is oscillatory, whereas with derivative control the
response is much more damped.
The subjects contained in the subsequent sections consider controller synthesis issues. For PID con-
trollers, tuning methods exist. Refer to the undergraduate texts cited previously or to the papers by Ziegler
and Nichols (1942, 1943).
14.2.2.2 The Root Locus Design Method
As mentioned previously in the discussion of PID control, various rules of thumb can be determined to
relate system performance to changes in gains, however, a systematic approach is more desirable. Because
pole locations determine the characteristics of the response of the system (recall the partial fraction
expansion), one natural design technique is to plot how pole locations change as a system parameter or
control gain is varied [Evans, 1948, 1950]. Because the real part of the pole corresponds to exponential
solutions, if all the poles are in the left-half plane, the poles closest to the j
ω
-axis will dominate the
system response. If we focus a second-order system of the form:
H(s) ϭ
(14.21)
ω
2
n
ᎏᎏ
s
2
ϩ 2
ζω
n
s ϩ
ω
2
n
14-8 MEMS: Introduction and Fundamentals
K
p
+ K
d
s + K
I
s
1
s
2
+1
desired
actual
+
−
FIGURE 14.4 Robot arm block diagram.
Amplitude
Step response
0 5 10 15 20 25 30 35
0
0.2
0.4
0.6
0.8
1
1.2
1.4
Proportional control
PD control
PID control
Time (sec)
FIGURE 14.5 PID control response.
© 2006 by Taylor & Francis Group, LLC
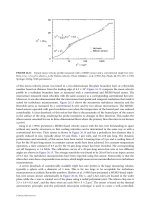
the poles of the system are as illustrated in Figure 14.6. The terms
ω
n
,
ω
d
, and
ζ
are the natural frequency,
the damped natural frequency, and the damping ratio, respectively. Multiplying H(s) by 1/s (unit step),
and performing a partial fraction expansion give:
Y(s) ϭ Ϫ Ϫ
(14.22)
so the time response for the system is
y(t) ϭ 1 Ϫ e
Ϫ
ζω
n
t
cos
ω
d
t ϩ sin
ω
d
t
(14.23)
where
ω
d
ϭ
ω
n
͙
1Ϫ
ෆ
ζ
2
ෆ
and 0 Յ
ζ
Ͻ 1. Figure 14.7 illustrates plots of the response for various values of
ζ
.
Referring to the previous equation and Figure 14.7, if the damping ratio is increased, the oscillatory
nature of the response is increasingly damped.
ζ
ᎏ
͙
1
ෆ
Ϫ
ෆ
ෆ
2
ෆ
ζω
n
ᎏᎏᎏ
(s ϩ
ζω
n
)
2
ϩ
ω
2
n
(1 Ϫ
ζ
2
)
s ϩ
ζω
n
ᎏᎏᎏ
(s ϩ
ζω
n
)
2
ϩ
ω
2
n
(1 Ϫ
ζ
2
)
1
ᎏ
s
Fundamentals of Control Theory 14-9
Im(s)
Re(s)
x
x
n
n
d
FIGURE 14.6 Complex conjugate poles, natural frequency, damped natural frequency, and damping ratio.
Amplitude
Step response
0 5 10 15
0
0.2
0.4
0.6
0.8
1
1.2
1.4
1.6
1.8
2
Time (sec)
FIGURE 14.7 Step response for various damping factors.
© 2006 by Taylor & Francis Group, LLC
Because the natural frequency and damping are directly related to the location of the poles, one effec-
tive approach to designing controllers is picking control gains based upon desired pole locations. Aroot
locus plot is a plot of pole locations as a system parameter or controller gain is varied. Once the root locus
has been plotted, pick the location on the root locus with the desired pole locations to give the desired
system response. There is a systematic procedure to plot the root locus by hand (refer to the cited under-
graduate texts), and computer packages such as Matlab (using the rlocus() and rlocfind() func-
tions) make it even easier. Figure 14.9 illustrates a root locus plot for the previously noted robot arm with
the block diagram as the single gain K is varied from 0 to
∞
as illustrated in Figure 14.8. Note that for
the usual root locus plot, only one gain can be varied at a time. In the previous example, the ratio of the
proportional, integral, and derivative gains was fixed, and a multiplicative scaling factor was varied in the
root locus plot.
Because the roots of the characteristic equation start at each pole when K ϭ 0 and approach each 0 of
the characteristic equation as K
→ ∞
, the desired K can be determined from the root locus plot by find-
ing the part of the locus that most closely matches the desired natural frequency
ω
n
and damping ratio
ζ
(recall Figure 14.7).
Typically, control system performance is specified in terms of time-domain conditions, such as rise
time, maximum overshoot, peak time, and settling time, all of which are illustrated in Figure 14.10.
Rough estimates of the relationship between the time-domain specifications and the natural frequency
and damping ratio are given in Table 14.2 [Franklin et al., 1994].
14-10 MEMS: Introduction and Fundamentals
1+ s + 1
s
1
s
2
+1
desired
actual
+
−
K
FIGURE 14.8
Robot arm block diagram.
−1 −0.8 −0.6 −0.4 −0.2 0 0.2 0.4 0.6 0.8 1
−1.5
−1
−0.5
0
0.5
1
1.5
Real axis
Imaginary axis
FIGURE 14.9 Root locus for robot arm PID controller.
© 2006 by Taylor & Francis Group, LLC
Example
Returning to the robot arm example, assume the desired system performance has a system rise time
less than 1.4 sec, a maximum overshoot less than 30%, and a 1% settling time less than 10 sec. From the
first row in Table 14.2, the natural frequency must be greater than 1.29. From the third and fourth rows,
the damping ratio should be greater than approximately 0.4. Figure 14.11 illustrates the root locus plot,
the pole locations and corresponding gain, and K (rlocfind() is the Matlab command for retrieving
the gain value for a particular location on the root locus). These results provide a damping ratio of
approximately .45 and a natural frequency of approximately 1.38. Figure 14.12 illustrates the step
response of the system to a unit step input verifying these system parameters.
14.2.2.3 Frequency Response Design Methods
An alternative approachtocontroller design and analysis is the so-called frequency response method.
Frequencyresponse controller design techniques have two main advantages. They provide good controller
Fundamentals of Control Theory 14-11
TABLE 14.2 Time-Domain Specifications as a
Function of Natural Frequency, Damped Natural
Frequency, and Damping Ratio
Rise time: t
r
Х
Peak time: t
p
Х
Overshoot: M
p
ϭ e
Ϫ
πζ
/͙1Ϫ
ෆ
ζ
2
ෆ
Settling time (1%): t
s
ϭ
Note: Results are from Franklin et al. (1994).
4.6
ᎏ
ζω
n
π
ᎏ
ω
d
1.8
ᎏ
ω
n
Time
(
sec
)
Amplitude
0 5 10 15 20 25
0
0.2
0.4
0.6
0.8
1
1.2
1.4
Maximum overshoot
Rise time
Peak time
Settling time
Steady-state error
FIGURE 14.10 Time domain control specifications.
© 2006 by Taylor & Francis Group, LLC
design even with uncertainty with respect to high-frequency plant characteristics, and using experimental
data for controller design purposes is straightforward. The two main tools are Bode and Nyquist plots (see
[Bode, 1945] and [Nyquist, 1932] for first-source references), and stability analyses are considered first.
A Bode plot is a plot of two curves. The first curve is the logarithm of the magnitude of the response
of the open-loop transfer function with respect to unit sinusoidal inputs of frequency
ω
. The second
14-12 MEMS: Introduction and Fundamentals
−1 −0.8 −0.6 −0.4 −0.2 0 0.2 0.4 0.6 0.8 1
−1.5
−1
−0.5
0
0.5
1
1.5
Real axis
Imaginary axis
K = 0
K large
K = 2.5
Natural frequency = 1.38
Damping ratio = 0.44
FIGURE 14.11 Selecting pole locations for a desired system response.
Time (sec)
Amplitude (radians)
0 1.4 2.8 4.2 5.6
7
0
0.2
0.4
0.6
0.8
1
1.2
1.4
FIGURE 14.12 Robot arm step response.
© 2006 by Taylor & Francis Group, LLC
curve is the phase of the open-loop transfer function response as a function of input frequency
ω
. Figure
14.13 illustrates the Bode plot for the transfer function:
G(s) ϭ
(14.24)
As the frequency of the sinusoidal input is increased, the magnitude of the system response decreases. The
phase difference between the sinusoidal input and system response starts near Ϫ90° and
approaches Ϫ270° as the input frequency becomes large.
An advantage of Bode plots is that they are easy to sketch by hand. Because the magnitude of the sys-
tem response is plotted on a logarithmic scale, the contributions to the magnitude of the response due to
individual factors in the transfer function add together. Due to basic facts related to the polar represen-
tation of complex numbers, the phase contributions of each factor add as well. Recipes for sketching Bode
plots by hand can be found in any undergraduate controls text, such as Franklin et al. (1994), Raven
(1995), Ogata (1997), and Kuo (1995).
For systems where the magnitude of the response passes through the value of 1 only one time and for
systems where increasing the transfer function gain leads to instability (the most common, but not exclu-
sive, scenario), the gain margin and phase margin can be determined directly from the Bode plot to pro-
vide a measure of system stability under unity feedback. Figure 14.13 also illustrates the definition of gain
and phase margin. Positive gain and phase margins indicate stability under unity feedback. Conversely,
negative gain and phase margins indicate instability under unity feedback. The class of systems for which
Bode plots can be used to determine stability are called minimum phase systems. A system is minimum
phase if all of its open-loop poles and zeros are in the left-half plane.
Bode plots also determine the steady-state error under unity feedback for various types of reference
inputs (steps, ramps, etc.). In particular, if the low-frequency asymptote of the magnitude plot has a slope
1
ᎏᎏ
s
3
ϩ 25s
2
ϩ s
Fundamentals of Control Theory 14-13
Frequency (rad/sec)
Phase (deg); Magnitude (dB)
−150
−100
−50
0
50
100
Gm = 27.959 dB (at 1 rad/sec), Pm = 10.975 deg. (at 0.19816 rad/sec)
10
−3
10
−2
10
−1
10
0
10
1
10
2
−300
−250
−200
−150
−100
−50
Positive gain margin
Positive phase margin
FIGURE 14.13 Bode plot.
© 2006 by Taylor & Francis Group, LLC
of zero and if the value of this asymptote is denoted by K, then the steady-state error of the system under
unity feedback to a step input is
lim
t→
∞
e ϭ (14.25)
If the slope of the magnitude plot at low frequencies is Ϫ20 dB/decade and if the value where the asymp-
tote intersects the vertical line
ω
ϭ 1 is denoted by K, then the steady-state error to a ramp input is
lim
t→
∞
e ϭ (14.26)
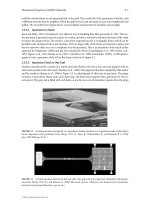
Example
Consider the system illustrated in Figure 14.2 where C(s) ϭ A(s) ϭ S(s) ϭ 1 and P(s) ϭ (1/2)/(s ϩ 1).
Figure 14.14 illustrates the Bode plot for the open-loop transfer function P(s) ϭ (1/2)/(s ϩ 1). The low-
frequency asymptote is approximately at Ϫ6, so 20 log K ϭϪ6 ⇒ K ≈ 0.5012 ⇒ y
ss
≈ 0.6661, where y
ss
ϭ
lim
t→
∞
p(t). Figure 14.15 illustrates the unity feedback closed-loop step response of the system, verifying that the
steady-state value for y(t) is the same as computed from the Bode plot.
ANyquist plot is a more sophisticated means to determine stability and is not limited to cases where
only increasing gain leads to system instability. A Nyquist plot is based on the well-known result from
complex variable theory called the principle of the argument. Consider the (factored) transfer function:
G(s) ϭ
͟
i
(s ϩ z
i
)
͟
j
(s ϩ p
j
)
(14.27)
By complex variable theory, ∠G(s) ϭ Σ
i
θ
i
Ϫ Σ
i
ϕ
j
,where
θ
i
are the angles between s and the zeros z
i
,
and
φ
j
are the angles between s and the poles p
j
.Thus, a plot of G(s) as s follows a closed contour (in the
clockwise direction) in the complex plane will encircle the origin in the clockwise direction the same
number of times that there are zeros of G(s)within the contour minus the number of times that there are
1
ᎏ
K
1
ᎏ
1 ϩ K
14-14 MEMS: Introduction and Fundamentals
Fre
q
uenc
y (
rad/sec
)
Phase (deg); Magnitude (dB)
−30
−25
−20
−15
−10
−5
10
−1
10
0
10
1
−100
−80
−60
−40
−20
0
To: Y(1)
FIGURE 14.14 Bode plot for example problem.
© 2006 by Taylor & Francis Group, LLC
poles of G(s)within the contour. Therefore, an easy check for stability is to plot the open loop G(s) on a
contour that encircles the entire left-half complex plane. Assuming that G(s) has no right-half plane poles
(poles of G(s) itself, in contrast to poles of the closed-loop transfer function), an encirclement of Ϫ1by
the plot will indicate a right-half plane zero of 1 ϩ G(s), which is an unstable right-half plane pole of the
unity feedback closed-loop transfer function:
(14.28)
Figure 14.16 illustrates the Nyquist plot for a unity feedback system with open-loop transfer function
given by:
G(s) ϭ (14.29)
which is stable under unity feedback. Figure 14.17 illustrates a Nyquist plot for a system that is unstable
under unity feedback.
14.2.2.4 Lead–Lag Compensation
Lead–lag controller design is another popular compensation technique. In this case, the compensator (the
C(s) block in Figure 14.2) is of the form:
C(s) ϭ K
β
(14.30)
where
α
Ͻ 1 and
β
Ͼ 1. The first fraction is the lead portion of the compensator and can provide
increased stability with an appropriate choice for A.The second term is the lag compensator and provides
decreased steady-state error. Figure 14.18 plots the Bode plot for a lead compensator for various values of
the parameter A.Because the lead compensator shifts the phase plot up, by an appropriate choice of the
parameter A, the crossover point where the magnitude plot crosses through the value of 0 dB can be
shifted to the right, increasing the gain margin.
Bs ϩ 1
ᎏ
β
Bs ϩ 1
As ϩ 1
ᎏ
α
As ϩ 1
1
ᎏᎏ
(s ϩ 1)(s ϩ 1)
G(s)
ᎏ
1 ϩ G(s)
Fundamentals of Control Theory 14-15
Time (sec)
Amplitude
0 0.5 1 1.5 2 2.5 3 3.5 4
0
0.05
0.1
0.15
0.2
0.25
0.3
0.35
FIGURE 14.15 Step response for example problem.
© 2006 by Taylor & Francis Group, LLC
14-16 MEMS: Introduction and Fundamentals
Real axis
Imaginary axis
Nyquist diagrams
−1 −0.8 −0.6 −0.4 −0.2
0 0.2 0.4 0.6 0.8 1
−0.8
−0.6
−0.4
−0.2
0
0.2
0.4
0.6
0.8
From: U(1)
To: Y(1)
FIGURE 14.16 Nyquist plot for a stable system.
Real axis
Imaginary axis
Nyquist Diagrams
−25 −20 −15 −10 −5 0
−15
−10
−5
0
5
10
15
From: U(1)
To: Y(1)
FIGURE 14.17 Nyquist plot of an unstable system.
© 2006 by Taylor & Francis Group, LLC
Example
Figure 14.19 plots the Bode plot for the compensated system:
G(s) ϭ
(14.31)
where A ϭ 0, 1 and
α
ϭ 0.5. The magnitude crossover point has been shifted to the left, increasing the
gain margin. In a similar manner, unstable systems (which would originally have negative gain and phase
margins) can possibly be stabilized.
Lag compensation works in a similar manner to increase the magnitude plot for low frequencies, which
decreases the steady-state error for the system. Lead and lag controllers can be used in series to increase
stability and decrease steady-state error. Systematic approaches for determining the parameters
α
,
β
, A,
and B can be found in the references, particularly Franklin et al. (1994).
14.2.3 Other Topics
Various other topics are typically considered in classical control but will not be outlined here. Such top-
ics include, but are not limited to, systematic methods for tuning PID regulators, lead–lag compensation,
and techniques for considering and modeling time delay. Interested readers should consult the references,
particularly Franklin et al. (1994), Ogata (1997), Kuo (1995), and Raven (1995).
14.3 “Modern” Control
In contrast to classical control, which is essentially a complex-variable, frequency-based approach for
SISO systems, modern control is a time-domain approach that is amenable to MIMO systems. The basic
1
ᎏᎏ
s
3
ϩ 25s
2
ϩ s
As ϩ 1
ᎏ
α
As ϩ 1
Fundamentals of Control Theory 14-17
Frequency (rad/sec)
Phase (deg); Magnitude (dB)
0
1
2
3
4
5
6
7
10
−2
10
−1
10
0
10
1
0
5
10
15
20
A
A
FIGURE 14.18 Bode plots of various lead compensators.
© 2006 by Taylor & Francis Group, LLC
tools are from the theory of ODEs and matrix algebra. The topics outlined in this section are the pole
placement, linear quadratic regulator (LQR) problems, and the basics of robust control.
14.3.1 Pole Placement
First, a multistate but single-input control system will be examined. Consider a control system written in
state space:
x
.
ϭ Ax ϩ Bu (14.32)
where x is the 1 ϫ n state vector, u is the scalar input, A is an n ϫ n constant matrix, and B is an n ϫ 1
constant matrix. If we assume that the control input u can be expressed as a combination of the current
state variables (called full state feedback), we can write:
u ϭ Ϫk
1
x
1
Ϫ k
2
x
2
Ϫ
…
Ϫ k
n
x
n
ϭ ϪKx (14.33)
where K is a row vector comprised of each of the gains k
i
. Then, the state-space description of the
system becomes:
x
.
ϭ (A Ϫ BK)x (14.34)
so that the solution of this equation is
x(t) ϭ e
(AϪBK)t
x(0) (14.35)
14-18 MEMS: Introduction and Fundamentals
Fre
q
uenc
y (
rad/sec
)
Phase (deg); Magnitude (dB)
−150
−100
−50
0
50
100
10
−3
10
−2
10
−1
10
0
10
1
10
2
−300
−250
−200
−150
−100
−50
FIGURE 14.19 Lead compensated example system.
© 2006 by Taylor & Francis Group, LLC
where e
(AϪBK)t
is the matrix exponential of the matrix A Ϫ BK defined by:
e
(AϪBK)t
ϭ I ϩ (A Ϫ BK)t ϩ ϩ ϩ
…
(14.36)
Basic theory from linear algebra and ODEs [Hirsch and Smale, 1974] indicates that the stability and
characteristics of the transient response will be determined by the eigenvalues of the matrix A Ϫ BK. If:
rank[B|AB|A
2
B|A
3
B| … |A
nϪ1
B] ϭ n (14.37)
then it can be shown that the eigenvalues of A Ϫ BK can be placed arbitrarily as a function of the
elements of K. Techniques to solve the problem by hand by way of a similarity transformation exist (see
the standard undergraduate controls books), and Matlab has functions for the computations as well.
Example — Pole Placement for Inverted Pendulum System
Consider the cart and pendulum system illustrated in Figure 14.20. In state-space form the equations
of motion are:
΄ ΅
ϭ
΄ ΅
΄ ΅
ϩ
΄ ΅
u
(14.38)
Setting M ϭ 10, m ϭ 1, g ϭ 9.81, and l ϭ 1 and letting u ϭ Ϫk
1
x ϩ k
2
x
.
ϩ k
3
θ
ϩ k
4
θ
.
if the desired pole
locations for the system are at:
λ
1
ϭ Ϫ1 Ϫ i
λ
2
ϭ Ϫ1 ϩ i
λ
3
ϭ Ϫ8
(14.39)
λ
4
ϭ Ϫ9
the Matlab function place() can be used to compute the values for the corresponding k
i
. For this
problem, the gain values are:
k
1
ϭ 122.32
k
2
ϭ 151.21
k
3
ϭ Ϫ849.77
(14.40)
k
4
ϭ Ϫ38.79
0
ᎏ
M
1
ᎏ
0
ᎏ
Ϫ
lM
1
ᎏ
x
.
x
θ
θ
.
0 1 0 0
0 0
ᎏ
Ϫ
M
gm
ᎏ
0
0 0 0 1
0 0
ᎏ
Ϫ(m
lM
ϩ M)g
ᎏ
0
x
.
x
θ
.
θ
d
ᎏ
dt
(A Ϫ BK)
3
t
3
ᎏᎏ
3!
(A Ϫ BK)
2
t
2
ᎏᎏ
2!
Fundamentals of Control Theory 14-19
x
M
l
u
mg
FIGURE 14.20 Cart and pendulum system.
© 2006 by Taylor & Francis Group, LLC
With initial conditions x(0) ϭ 0.25, x
.
(0) ϭ 0,
θ
(0) ϭ 0.25 and
θ
.
(0) ϭ 0, Figure 14.21 illustrates the
response of the system. Note that the cart position x initially moves in the “wrong” direction in order to
compensate for the pendulum position.
14.3.2 The Linear Quadratic Regulator (LQR)
The LQR problem is not limited to scalar input problems and seeks to find a control input:
u ϭ ϪKx(t) (14.41)
for the system:
x
.
ϭ Ax ϩ Bu (14.42)
that minimizes the performance index:
J ϭ
͵
∞
0
(x
T
Qx ϩ u
T
Ru)dt (14.43)
where Q and R are positive definite, real symmetric matrices. By the second method of Lyapunov [Khalil,
1996; Sastry, 2000], the control input that minimizes the performance index is:
u ϭ ϪR
Ϫ1
B
T
Px(t) (14.44)
where R and B are from the performance index and equations of motion, respectively, and P satisfies the
reduced matrix Riccati equation:
A
T
P ϩ PA Ϫ PBR
Ϫ1
B
T
P ϩ Q ϭ 0 (14.45)
14-20 MEMS: Introduction and Fundamentals
0 1 2 3 4 5 6 7 8 9 10
−0.05
0
0.05
0.1
0.15
0.2
0.25
0.3
0.35
0.4
Time (sec)
Cart position (m) and angle (rad.)
Cart position
Pendulum angle
FIGURE 14.21 Cart and pendulum system pole placement response.
© 2006 by Taylor & Francis Group, LLC
Example — LQR for Inverted Pendulum System
For the same cart and pole system as in the previous example with:
Q ϭ
΄ ΅
(14.46)
(which weights all the states equally) and R ϭ 0.001, the optimal gains (computed via the Matlab lqr()
function) are:
k
1
ϭ 31.62
k
2
ϭ 145.75
k
3
ϭϪ95.53
k
4
ϭϪ21.65 (14.47)
and the response of the system with initial conditions x(0) ϭ 0.25, x
.
(0) ϭ 0,
θ
(0) ϭ 0.25 and
θ
.
(0) ϭ 0is
illustrated in Figure 14.22. If the Q matrix is modified to provide a heavy weighting for the
θ
state:
Q ϭ
΄ ΅
(14.48)
Figure 14.23 illustrates the system response. Note that the pendulum angle goes to zero very rapidly but
at the “expense” of a slower response and greater deviation for the cart position.
0
0
0
1
0
0
100
0
0
1
0
0
1
0
0
0
0
0
0
1
0
0
1
0
0
1
0
0
1
0
0
0
Fundamentals of Control Theory 14-21
0 1 2 3 4 5 6 7 8 9 1
0
−0.15
−0.1
−0.05
0
0.05
0.1
0.15
0.2
0.25
0.3
Time (sec)
Cart position (m) and pendulum angle (rad.)
Cart position
Pendulum angle
FIGURE 14.22 Cart and pendulum LQR response.
© 2006 by Taylor & Francis Group, LLC
14.3.3 Basic Robust Control
The main idea motivating modern robust control techniques is explicitly incorporating plant uncertainty
representations into system modeling and control synthesis methods. The material here outlines the pres-
entation in Doyle et al. (1992), and the more advanced material is from Zhou (1996). Modern robust
control is a very involved subject and only the briefest outline is provided here.
Consider the unity feedback SISO system illustrated in Figure 14.24, where P and C are the plant and
controller transfer functions; R(s) is the reference signal; Y(s) is the output; D(s) and N(s) are external dis-
turbances and sensor noise, respectively; E(s) is the error signal; and U(s) is the control input.
Define the loop transfer function L ϭ CP and the sensitivity function:
S ϭ (14.49)
which is the transfer function from the reference input R(s) to the error E(s) which provides a measure
of the sensitivity of the closed loop (or complementary sensitivity) transfer function:
T ϭ (14.50)
to infinitesimal variations in the plant P. Given a (frequency-dependent) weighting function W
1
(s), a
natural performance specification (relating tracking error to classes of reference signals) is
PC
ᎏ
1 ϩ PC
1
ᎏ
1 ϩ L
14-22 MEMS: Introduction and Fundamentals
0 1 2 3 4 5 6 7 8 9 1
0
−0.1
−0.05
0
0.05
0.1
0.15
0.2
0.25
0.3
0.35
Time
(
sec
)
Cart position (m) and pendulum angle (rad.)
Cart position
Pendulum angle
FIGURE 14.23 Cart and pendulum LQR response with large pendulum angle weighting.
R(s)
E(s)
C(s)
D(s)
P(s)
N
(
s
)
Y(s)
U(s)
−
+
FIGURE 14.24 Robust control feedback block diagram.
© 2006 by Taylor & Francis Group, LLC
||W
1
S||
∞
Ͻ 1 (14.51)
where ||и||
∞
denotes the infinity norm. An easy graphical test for the performance specification is that the
Nyquist plot of L must always lie outside a disk of radius |W
1
| centered at Ϫ1.
To incorporate plant uncertainty into the model, consider a nominal plant P and perturbed plant P
~
where P and P
~
differ by some multiplicative or other type of uncertainty. Let W
2
be a stable transfer func-
tion and ∆ be a variable stable transfer function satisfying ||∆||
∞
Յ 1. Common uncertainty models are
constructed by appropriate combinations of P, ∆, and W. It is shown that the system is internally stable
(this is a stronger definition than simple input–output stability; see [Doyle et al., 1992]) for the condi-
tions shown in Table 14.3.
Recall that the nominal performance condition was ||W
1
S||
∞
Ͻ 1. The robust performance condition
is a combination of the two (for the (1 ϩ ∆W
2
)P perturbation):
|||W
1
S| ϩ |W
2
T|||
∞
Ͻ 1 (14.52)
Other robust performance measures for various types of uncertainty are found in Doyle et al. (1992) and
Zhou (1996).
Recall that W
1
is the performance specification weighting function and W
2
is the plant uncertainty
transfer function. Consider the following facts:
1. Plant uncertainty is greatest for high frequencies.
2. It is only reasonable to demand high performance for low frequencies.
Typically,
|W
1
| Ͼ 1 Ͼ |W
2
| (14.53)
for low frequencies, and
|W
1
| Ͻ 1 Ͻ |W
2
| (14.54)
for high frequencies (it can be shown that the magnitude of either W
1
or W
2
must be less than 1). By
considering the relationship between L, S, and T, the following is derived:
|W
1
| ϾϾ 1 Ͼ |W
2
| ⇒ |L| Ͼ (14.55)
and
|W
1
| Ͻ 1 ϽϽ |W
2
| ⇒ |L| Ͻ (14.56)
Loopshaping [Bower and Schultheiss, 1961; Horowitz, 1963] controller design is the task of determining
an L (and hence C) that satisfies the low-frequency performance criterion as well as the high-frequency
1 Ϫ |W
1
|
ᎏ
|W
2
|
|W
1
|
ᎏ
1 Ϫ |W
2
|
Fundamentals of Control Theory 14-23
TABLE 14.3 Internal Stability Conditions
Perturbation Condition
(1 ϩ ∆W
2
)P ||W
2
T||
∞
Ͻ 1
P ϩ ∆W
2
||W
2
CS||
∞
Ͻ 1
||W
2
PS||
∞
Ͻ 1
||W
2
S||
∞
Ͻ 1
P
ᎏ
1 ϩ ∆W
2
P
ᎏᎏ
1 ϩ ∆W
2
P
© 2006 by Taylor & Francis Group, LLC
robustness criterion. The task is to design C so that the magnitude versus frequency plot of L appears as
in Figure 14.25. In the figure, the indicated low-frequency performance bound is a plot of:
(14.57)
for low frequencies, and the high-frequency stability bound is a plot of:
(14.58)
for high frequencies.
Two more aspects of this problem have been developed in recent years. The first concerns optimality,
and the second concerns multivariable systems. For both aspects of these recent developments, refer to
the comprehensive book by Zhou (1996).
14.4 Nonlinear Control
Aside from the developments of robust optimal control briefly outlined in the previous section, the area
of most recent development in control theory has been nonlinear control. Nonlinear control does not
ignore nonlinear effects via linearization, the nonlinearities in the control system are either expressly rec-
ognized or are even exploited for control purposes. Much, but not all, development in nonlinear control
uses tools from differential geometry. While the control techniques will be outlined here, the basics of
differential geometry will not, and the interested reader is referred to Abraham et al. (1988), Boothby
(1986), Isidori (1996), and Nijmeijer and van der Schaft (1990) for details.
The general nonlinear model considered here is of the form:
x
.
ϭ f(x) ϩ
Α
n
iϭ1
g
i
(x)u
i
(14.59)
1 Ϫ |W
1
|
ᎏ
|W
2
|
|W
1
|
ᎏ
1 Ϫ |W
2
|
14-24 MEMS: Introduction and Fundamentals
Frequency (rad/sec)
Phase (deg); Magnitude (dB)
−20
−10
0
10
20
30
10
−1
10
0
10
1
−200
−150
−100
−50
0
Low frequency
performance requirements
High frequency
stability requirements
FIGURE 14.25 Loopshaping concepts.
© 2006 by Taylor & Francis Group, LLC
where x is a 1 ϫ n vector, the f(x) and g
i
(x) are smooth vector fields, and the u
i
are scalar control inputs.
Note that this is not the most general form for nonlinear systems, as the u
i
are assumed to enter the
equations in an affine manner (i.e., they simply multiply the g
i
(x) vector fields). For some aerodynamic
problems, this assumption may not be true.
14.4.1 SISO Feedback Linearization
In contrast to the standard Jacobian linearization of a nonlinear control system, feedback linearization is
a technique to construct a nonlinear change of coordinates which converts a nonlinear system in the orig-
inal coordinates to a linear system in the new coordinates. Whereas the Jacobian linearization is an
approximation of the original system, a feedback linearized system is exactly the original system. SISO
systems will be considered first, followed by MIMO systems. References for feedback linearization are
Isidori (1996), Nijmeijer and van der Schaft (1990), Krener (1987), Khalil (1996), and Sastry (2000).
Developmental papers or current research in this area are considered in Slotine and Hedrick (1993),
Brockett (1978), Dayawansa et al. (1985), Isidori et al. (1981a; 1981b), and Krener (1987).
Consider the nonlinear system:
x
.
ϭ f(x) ϩ g(x)u
y ϭ h(x)
(14.60)
where the function h(x) is called the output function. Let L
f
h denote the Lie derivative of the function h
with respect to the vector field f, which is defined in coordinates as:
L
f
h(x) ϭ
Α
n
iϭ1
(x)f
i
(x) (14.61)
where
x ϭ
΄ ΅
and f ϭ
΄ ΅
(14.62)
so it is simply the directional derivative of h along f. Because the system evolves according to the state
equations, the time derivative of the output function y
.
is simply the directional derivative of the output
function along the control system:
y
.
ϭ h
.
ϭ x
.
ϭ (f(x) ϩ g(x)u) ϭ L
fϩgu
h ϭ L
f
h ϩ L
g
hu (14.63)
The relative degree of a system is defined as follows: a SISO nonlinear system is said to have strict rel-
ative degree
γ
at the point x if:
1. L
g
L
i
f
h(x) ≡ 0 i ϭ 0, 1, 2, … ,
γ
Ϫ 2 (14.64)
2. L
g
L
f
γ
Ϫ1
h(x) 0 (14.65)
In the case where
γ
ϭ n, the system is full state feedback linearizable, and it is possible to construct the
following change of coordinates where the original coordinates x
i
are mapped to a new set of coordinates
∂
h
ᎏ
∂
x
∂
h
ᎏ
∂
x
f
1
(x)
f
2
(x)
Ӈ
f
nϪ1
(x)
f
n
(x)
x
1
x
2
Ӈ
x
nϪ1
x
n
∂
h
ᎏ
∂
x
i
Fundamentals of Control Theory 14-25
© 2006 by Taylor & Francis Group, LLC
ξ
i
as follows:
ξ
1
ϭ h(x)
ξ
2
ϭ
ξ
.
1
ϭ h
.
ϭ L
f
h
ξ
3
ϭ
ξ
.
2
ϭ h
ϭ L
f
2
h (14.66)
Ӈ
ξ
n
ϭ
ξ
.
.
nϪ1
ϭ L
f
γ
Ϫ1
h
Computing derivatives, the control system becomes:
ξ.
.
1
ϭ
ξ
2
ξ
.
.
2
ϭ
ξ
3
Ӈ
ξ
.
.
nϪ1
ϭ
ξ
n
(14.67)
ξ
.
.
n
ϭ L
γ
f
h ϩ L
g
L
f
γ
Ϫ1
hu
or, setting
u ϭ (ϪL
f
γ
h ϩ v) (14.68)
the system is
ξ
.
1
ϭ
ξ
2
ξ
.
2
ϭ
ξ
3
Ӈ
ξ
.
nϪ1
ϭ ξ
n
(14.69)
ξ
.
n
ϭ v
which is both linear and in controllable canonical form. One approach to determine an appropriate v to
stabilize the system or track desired values of h(x) is pole placement (i.e., v ϭ ϪK
ξ
). Note that the over-
all approach is to determine an output function h that could be differentiated n times before the control
input appeared. This approach essentially constructs a system known as a chain of integrators, as the
derivative of the ith state in the
ξ
variables is equal to the (i ϩ 1)th state variable.
There are two main limitations to feedback linearization approaches. The first is that not all systems
are feedback linearizable, although analytical tests exist to determine whether a particular system is lin-
earizable. Second, determining the output function h(x) involves solving a system of partial differential
equations.
Example — SISO Full State Feedback Linearization
Consider the following system as a mathematical example of the computations involved in feedback
linearization:
΄ ΅
ϭ
΄
΅
ϩ
΄ ΅
u ϭ f(x) ϩ g(x)u (14.70)
0
0
0
1
x
3
x
4
x
1
ϩ x
2
ϩ x
3
x
1
Ϫ x
3
x
.
1
x
.
2
x
.
3
x
.
4
1
ᎏ
L
g
L
f
γ
Ϫ1
h
14-26 MEMS: Introduction and Fundamentals
© 2006 by Taylor & Francis Group, LLC
with output function y ϭ h(x) ϭ x
1
. The system has a relative degree equal to 4, so the system is full state
feedback linearizable and the coordinate transformation is given by:
ξ
1
ϭ h(x) ϭ x
1
ξ
2
ϭ L
f
h(x) ϭ x
3
ξ
3
ϭ L
2
f
h(x) ϭ x
1
ϩ x
2
ϩ x
3
(14.71)
ξ
4
ϭ L
3
f
h(x) ϭ x
1
ϩ x
2
ϩ 2x
3
ϩ x
4
The above equations and the fact that the system has a relative degree of 4 is verified by the following
detailed calculations:
L
g
h(x) ϭ L
g
x
1
ϭ [1 0 0 0]
΄ ΅
ϭ 0,
L
g
L
f
h(x) ϭ L
g
l
f
x
1
ϭ L
g
[1 0 0 0]
΄ ΅
ϭ L
g
x
3
ϭ [0 0 1 0]
΄ ΅
ϭ 0,
L
g
L
2
f
h(x) ϭ L
g
L
2
f
x
1
ϭ L
g
L
f
x
3
ϭ L
g
[0 0 1 0]
΄ ΅
(14.72)
ϭ L
g
(x
1
ϩ x
2
ϩ x
3
) ϭ [1 1 1 0]
΄ ΅
ϭ 0,
L
g
L
3
f
h(x) ϭ L
g
L
3
f
x
1
ϭ L
g
L
f
(x
1
ϩ x
2
ϩ x
3
) ϭ L
g
[1 1 1 0]
΄ ΅
ϭ L
g
(x
1
ϩ x
2
ϩ 2x
3
ϩ x
4
) ϭ [1 1 2 1]
΄ ΅
ϭ 1
Therefore, a controller of the form:
u ϭ (ϪL
4
f
h ϩ v)
ϭ (Ϫ(3x
1
ϩ 2x
2
ϩ 2x
3
ϩ x
4
) ϩ k
1
x
1
ϩ k
2
x
3
ϩ k
3
(x
1
ϩ x
2
ϩ x
3
) ϩ k
4
(x
1
ϩ x
2
ϩ 2x
3
ϩ x
er4
)) (14.73)
with the gains k
i
picked via pole placement, for example, will allow the system to track trajectories of the
output function h(x) ϭ x
1
.
So far, this section has considered full state feedback linearization where the relative degree of a system
is equal to the dimension of its state space. Partial feedback linearization is also possible where the
relative degree is less than the dimension of the state space. However for such systems, an analysis of the
1
ᎏ
L
g
L
3
f
h
0
0
0
1
x
3
x
4
x
1
ϩ x
2
ϩ x
3
x
1
Ϫ x
3
0
0
0
1
x
3
x
4
x
1
ϩ x
2
ϩ x
3
x
1
Ϫ x
3
0
0
0
1
x
3
x
4
x
1
ϩ x
2
ϩ x
3
x
1
Ϫ x
3
0
0
0
1
Fundamentals of Control Theory 14-27
© 2006 by Taylor & Francis Group, LLC