The MEMS Handbook MEMS Applications (2nd Ed) - M. Gad el Hak Episode 2 Part 2 ppsx
Bạn đang xem bản rút gọn của tài liệu. Xem và tải ngay bản đầy đủ của tài liệu tại đây (2.28 MB, 30 trang )
usually have turns to cover more areas. Taylor dispersion can result at the turns because of the difference
in transit time (or streamline velocity over the same length) at the two sides of the turn. Tay lor dispersion
due to this transverse difference in velocity around turns can reduce the separation efficiency dramati-
cally [Dutta and Leighton, 2001]. With low dispersion, electrokinetic flow suffers from mixing deficiencies
that reduce reaction yield and promote colloid/protein aggregation/precipitation [Chang, 2001; Thamida
and Chang, 2002; Takhistov et al., 2003]. Such undesirable colloidal segregation and aggregation phe-
nomena in microdevices can be minimized if microvortices can be generated within the flow channels to
mix the suspension. However, generation of microvortices is difficult in electrokinetic flow due to its irro-
tational features. One strategy is to introduce surfaces with nonuniform zeta potential [Ajdari, 1995; Herr
et al., 2000; Stroock et al., 2002]. However, such nonuniformities are difficult to impose at junctions and
membrane surfaces where vortex mixing is most needed.
Several micropumps based on linear electrokinetics have been reported in recent years [Laser and
Santiago, 2004; Zeng et al., 2001]. Because of the large current of such linear electrokinetic pump, bub-
ble and ion generation by electrochemical reaction at the electrodes are major issues. A pH gradient often
develops as a result of the ion production and will often produce nonuniform zeta potential due to its
sensitivity to pH. Pressure-driven backflow and long circulations can then result due to such pH gradi-
ents [Minerick et al., 2002]. Buffer solutions are usually used to neutralize the pH gradient, but depend-
ing on the load and sample, utilizing such buffer solutions is not always possible. A high voltage exceeding
several hundred volts is usually required for linear electrokinetic pumps, rendering them impractical or
unsafe for portable devices. Dense packing using silica particles to maximize the double layer–to–pore-
diameter ratio, to reduce the current, and to increase back pressure has been suggested as a partial
remedy to these issues [Yao et al., 2003].
Although linear electrophoresis operates best on large-scale channels, such as in DNA gel elec-
trophoresis, it cannot manipulate the nanoscale particles precisely [Hughes, 2003] as it has no sensitivity
with respect to the particle size. Separating target cells from complex fluid samples such as human blood
remains a significant challenge [Cheng and Kricka, 2001]. Other electrokinetic phenomena such as
dielectrophoresis pioneered by Pohl (1978), electrorotation [Wang et al., 1992; Wang et al., 1997; Gimsa,
2001], and traveling wave electrophoresis [Cui and Morgan, 2000; Morgan et al., 2001] have been sug-
gested to achieve better control and sensitivity. These new mechanisms are all nonlinear electrokinetic
phenomena and some of them will be described below.
9.2 Nonlinear Electrokinetics
A large family of nonlinear and nonequilibrium electrokinetic phenomena have been found or redis-
covered recently. All of them work under the same basic principle: the induction of nonuniform polarization
within the double layer with the external field. As a result, potential drop across the polarization layer, or
zeta potential, is dependent on the normal external field, as well as the surface field due to surface charges.
A direct generalization of Equation (9.1) suggests the resulting electroosmotic and electrophoretic veloc-
ities should depend nonlinearly on the external field. We hence expect a much larger velocity than linear
electrokinetics at large fields. Boltzmann equilibrium ion distributions [Probstein, 1994] can no longer
exist. These nonlinear electrokinetic phenomena are hence often nonequilibrium in nature.
The first example of nonlinear electrokinetic phenomena is dielectrophoresis (DEP) induced by an AC
field [Pohl, 1978; Jones, 1995; Zimmermann and Neil, 1996; Gascoyne and Vykoukal, 2002; Morgan and
Green, 2003; Hughes, 2003]. Charging and discharging of the double layer by the external fields leads to
external field-induced dipoles at the dielectric particle or cell surface. If the dynamic polarization is due
entirely to the normal field and is fast compared to the period of the AC field, the Maxwell stress is always
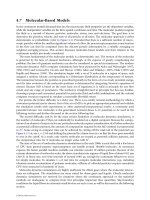
in the same direction and has a nonzero time average. As shown in Figure 9.1, if the field is nonuniform,
the greater electric field strength across one side of the particle means that the force generated on that
side is greater than the force induced on the opposite side of the particle and a net force is exerted toward
the region of greatest electric field. This motion of the particle is termed positive dielectrophoresis.
However, this double layer polarization mechanism for DEP has not been scrutinized in the literature.
Nonlinear Electrokinetic Devices 9-3
© 2006 by Taylor & Francis Group, LLC
Instead, a dielectric polarization mechanism based on internal atomic and molecular dipoles is typically
used. To account for inadequacies of this polarization mechanism, conductivity is introduced to produce
a Maxwell-Wagner factor that basically models a capacitor and a resistor in parallel on both sides of the
surface. Such equivalent circuit models, as in similar models we will develop in section 9.3, should model
the charging dynamics of the double-layer capacitor. However, a direct link has not been established. In
any case, using the semiempirical Maxwell-Wagner factor, the dielectrophoretic force F
DEP
[Johns, 1995]
upon a dielectric sphere of permittivity
ε
2
and radius R suspended in a medium of permittivity
ε
1
and
subjected to an electric field E, is
F
DEP
ϭ 2
πε
1
R
3
K∇E
2
(9.2)
where K is Re
(
ᎏ
ε
ε
2
2
Ϫ
ϩ
ε
ε
1
1
ᎏ
)
, the Clausius–Mossotti function, and generalizes to the Maxwell–Wagner factor if
the permittivity
ε
is complex to include conductivity
ε
Ϫ
σ
/i
ω
, where
ω
is the frequency of the AC field.
The dielectrophoretic velocity is then proportional to the divergence of the square of the electric field
intensity, quite distinct from linear electrokinetic velocity of Equation (9.1). Dielectrophoretic velocity is
also sensitive to the frequency of the applied field via the Maxwell-Wagner factor, cell or particle size R,
and electrical properties. A recent review by Gascoyne and Vykoukal (2002) shows that dielectrophoresis
has tremendous applications in cell sorting and separations.
Electrorotation occurs when a dipole is induced by a rotating electric field [Wang et al.1992; Zimmermann
and Neil, 1996; Wang et al., 1997; Gimsa and Wachner, 1998; Gimsa, 2001; Hughes, 2003]. A lag between
the orientation of the electric field and that of the dipole moment develops due to the charge relaxation
times of the double layer, and thus a torque is induced as the dipole moves to reorient itself with the elec-
tric field. These relaxation times for particles in an electrolyte probably correspond to electromigration
and diffusion times across the double layer and across the surface of the particles. As in DEP, a definitive
9-4 MEMS: Applications
+
+
+
+
+
+
+
−
−
−
−
−
−
−
−
FIGURE 9.1 Double layer polarization during positive dielectrophoresis.
© 2006 by Taylor & Francis Group, LLC
analysis of how the double-layer dynamics affect rotation is still lacking. Owing to the continuous rota-
tion of the electric field, the torque is induced continually and the cell rotates. Electrorotation has been
used to study the dielectric properties of matter, such as the interior properties of biological cells and
biofilms.
Nonlinear electrokinetic phenomena exist under a DC field as well. One example of nonlinear DC
electrokinetics is polarization at nearly insulate wedges [Thamida and Chang, 2002; Takhistov et al.,
2003]. A large field penetration exists near sharp channel corners even for channels made with low-
permittivity dielectrics. Hence, the external field can penetrate the double layers on both sides of the corner
and also through the corner dielectric in between. This normal field penetration is inward at one side and
outward on the other. As such, its field-induced polarization is of opposite charge on the two sides. This
produces a converging nonlinear electroosmotic flow that yields an observable microjet and vortex at the
corner — both are impossible with linear electrokinetics. Significant particle aggregation occurs at
this corner, as seen in Figure 9.2, due to the converging stagnation flow of the nonlinear electrokinetics.
The long-range hydrodynamic convection transports the particles to the corner, where a DC dielectrophore-
sis force traps them. This long-range trapping effect of converging stagnation flow will be employed in
several other designs to be discussed later. Because it is this flow that convects the particles toward the
point, the trapping mechanism is far longer range and stronger than the AC dielectrophoresis (DEP) force
in Equation (9.2), whose range is determined by the field gradient length scale and whose amplitude
scales as the third power of the particle size R. Aggregation is absent away from the corner, as is consis-
tent with linear electrokinetics, but it occurs at the corner due to the localized nonlinear electrokinetics.
Another example is the “electrokinetic phenomenon of the second kind” first envisioned by Dukhin
(see review by Dukhin in 1991). It involves a highly conductive and ion-selective granule that permits the
external field and diffusion to drive a flux of counterions (a current) into half of a granule. (The coions
Nonlinear Electrokinetic Devices 9-5
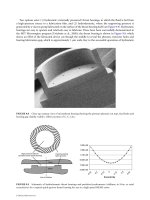
FIGURE 9.2 Experimental snapshot of the microchannel junction. The silica channel and the latex colloids are
oppositely charged, and hence both electrophoretic and electroosmotic motions are in same direction. The picture
shows a spiral colloidal aggregation at the inner corner.
© 2006 by Taylor & Francis Group, LLC
cannot be driven into the other half due to the ion specificity.) This steady flux of ions immediately
renders the potential and concentration distributions within the double layer different from the Boltzmann
equilibrium distributions that cannot sustain a flux. Since this flux is provided by the electromigration of
ions driven by the external field, the external field necessarily penetrates the double layer, and the latter’s
polarization is dependent on the normal external field. Dukhin’s theory yields a prediction that the
electrophoretic velocity of a spherical granule of radius a scales as
U ϳ E
2
a
(9.3)
Many of the features expected of nonlinear electrokinetics have been observed for this DC electrokinetic
phenomenon of the second kind. Large vortices on the side were observed by Mishchuk and Takhistov
(1995), and the electrophoretic velocity, which is not linearly dependent on the applied field, was mea-
sured by Barany et al. (1998). Ben and Chang studied this problem theoretically in detail (2002) (Figure 9.3).
A mixing device based on the strong mixing action of the vortices in Figure 9.3 is developed [Wang et al.,
2004] for microfluidic applications.
Nonlinear flows near polarized particles have been analyzed for two decades (see review by
Murtsovkin, 1996). Recently, Bazant and Squires [Bazant and Squires, 2004; Squires and Bazant, 2004]
studied flow around metal objects (termed IECO), with possible microfluidic applications in mind. The
surface of a metal has a constant potential; that is, every ion that is driven into the polarized layer by the
external field will be compensated by an opposite charge that moves even more rapidly to the surface on
the solid side. This compensation would ensure there is no net charge on two sides of the surface and the
potential remains the same. However, the number of ions that can be driven into the polarized layer can,
in principle, be increased arbitrarily by raising the applied field. This field-dependent polarization accounts
for the nonlinear dependence of the electrokinetic velocity. They predict that the velocity will scale as E
2
,
where E is the external field. Vortices will occur around a spherical metal because of the geometry. Their
work shows pumping of fluid in a particular direction to be possible with an asymmetric design.
Linear DC electroosmotic flow around particles of the same Zeta potential toward an electrode surface
with a different polarization can produce vortices when the particles are close to the electrode surface
[Solomentsev et al., 1997; Solomentsev et al., 2000]. These vortices are on the side of the particles away
from the surface. They can hence induce parallel motion of the particles due to hydrodynamic interac-
tion between two adjacent particles. This hydrodynamic interaction is attractive and leads to much larger
lateral particle velocities, but the external-field induced nonuniform polarization produces parallel
dipoles on two adjacent particles. Electrostatic interaction between these induced dipoles is attractive for
ε
ᎏ
µ
9-6 MEMS: Applications
(b)(a)
FIGURE 9.3 (a) Illuminated titanium oxide powder brings out the streamlines of electrokinetic flow around 1 mm
spherical granule housed in a slot in a field of about 100 V/cm. (b) Computed streamlines.
© 2006 by Taylor & Francis Group, LLC
two particles along the same field line. This interaction is responsible for linear self-assembly along field
lines [Minerick et al., 2003]. The electrostatic interaction is repulsive for parallel self assembly of particles
on different field lines. The electrostatic repulsion between these dipoles then competes with the attrac-
tive hydrodynamic forces in the parallel self-assembly dynamics. However, as observed and analyzed by
Trau et al. (1997),Yeh et al. (1997), and Nadal et al. (2002), spontaneous self-assembly of colloids on elec-
trode surfaces and even in the bulk [Hu et al., 1994] occurs when a converging stagnation flow appears
for the nonlinear AC electroosmotic flow field. Hence, self-assembly seems to occur more readily due to the
induced electrostatic dipoles and the hydrodynamic vortices generated by AC nonlinear electrokinetics.
Nonlinear electrokinetic phenomena also occur at the electrodes supplying the AC field, and this has
spurred considerable interest in designing such AC electrokinetic devices. In contrast to DC electro-
kinetics, at a sufficiently high frequency electrochemical reactions do not occur at the electrode, and the key
bubble/ion generation problem is removed. This is by far the most attractive feature of AC electrokinetic
phenomena. The field still penetrates the electrolyte to charge and discharge ions onto the electrodes.
Such capacitive charging produces a very polarized double layer over the electrode, which can again drive
a tangential flow as in linear electroosmosis, as shown in Figure 9.4. As the polarization and the effective
zeta potential are now field-dependent, Equation (9.1) then stipulates that all AC electrokinetic phe-
nomena are nonlinear. The induced polarization is much stronger than the usual polarization due to sur-
face charges on typical dielectric surfaces. Velocity can be several hundred microns per second at the
moderate applied electrode potential of several volts. This AC polarization leads to strong electroosmotic
vortices on the micron-sized electrodes that have been observed and analyzed [Ramos et al., 1999; Ajdari,
2000; Brown et al., 2000; Gonzalez et al., 2000; Green et al., 2000; Green et al., 2002; Studer et al., 2002;
Mpholo et al., 2003; Ramos et al., 2003]. The vortices have the same size as the electrodes. The dynamic
charging and discharging of ions into the double layer by the external AC field yields an interesting
dynamic screening phenomenon that develops over a time scale of
λ
L/D [Gonzalez et al., 2000], where D
is the diffusivity of the ions.
With potential microfluidic applications in mind, Ajdari (2000) predicted that asymmetric AC electro-
osmotic vortices on asymmetric planar electrodes can lead to a net flow instead of the closed circulation within
vortices. This AC electroosmotic pump was constructed and experimentally verified by Brown et al. (2000).
Other forms of nonlinear electrokinetics such as electrospray [Yeo et al., 2004], electroporation
[Chang, 1989], and electrowetting [Jones et al., 2004] have also been scrutinized recently. All of them have
potential applications in microfluidic lab-on-a-chip devices.
It is clear from the above review that nonlinear electrokinetics is a rich new field with many potential
applications and many clear advantages over linear electrokinetics (lack of bubble and ion generation at
Nonlinear Electrokinetic Devices 9-7
F F F F
V cos t
V cos t
−V cos t
−V cos tV cos t
V cos t
−V cos t
−V cos t
(a)
(b)
(c) (d)
FIGURE 9.4 (See color insert following page 2-12.) Schematic illustration of the capacitive charging: (a) and
(b) demonstrate the electric field, and F represents time averaged Maxwell force; (c) and (d) demonstrate the flow profile.
© 2006 by Taylor & Francis Group, LLC
electrodes). In the next section, we will focus on a specific AC electroosmotic flow on electrodes due to
Faradaic charging by electrochemical reactions. Although reactions are now present at the electrodes because
high voltages and low frequencies are used, there is little net production of bubbles and ions. The product
ions of one half-cycle are consumed in the next, and the number of gas molecules generated in each half-cycle
is not sufficient to nucleate gas bubbles. Yet, significant transient polarization occurs at each half-cycle due
to the reactions. As a result of this strong Faradaic polarization, very high fields can be employed to drive
high flow without bubble and ion generation; this combines the advantages of DC electrokinetics and
nonreactive AC electrokintetics. Two kinds of microfluidic devices will be discussed: one is for assembling
and dispersing particles on the electrode surface or concentrating bacteria; the other is for pumping fluid.
9.3 AC Electrokinetics on Electrodes: Effects of Faradaic
Reaction
Consider two parallel, infinitely long electrodes with an AC field V cos
ω
t applied as shown in Figure 9.4.In
the first half-cycle after turning on the AC field, the electric field line is from the left electrode to the right,
as shown in Figure 9.4a. Cations due to electromigration move to the right electrode along the field lines,
and coions move in the opposite direction. As a result, cations accumulate on the double layer of the right
electrode, and anions accumulate on the other electrode. The electrode geometry then introduces a tangen-
tial field that will move the accumulated ions. These ions in turn drive the liquid motion due to viscous
effects. In the next half cycle, as shown in Figure 9.4b.The electric field changes direction; however, the
polarity of the accumulated charges also changes accordingly.As the electric force is equal to the electric field
times the charge, the instantaneous and time-averaged electric force remains in the same direction at the
same electrode. This produces an inward slip velocity on the electrode. One would expect the field and
the slip velocity to weaken toward the outer edges of the electrode pair. Continuity dictates that a large
flow into a region with a weak driving force (slip velocity) must produce a large pressure-driven backflow in
the opposite direction. This opposing flow produces converging stagnation lines and vortices, one example
of which already has been seen in Figure 9.3, for nonuniform polarization and slip velocity on an ion-
exchange granule. A similar vortex motion on the parallel electrodes is sketched in Figure 9.4c and d.
Usually, the thickness of the double layer is much less than the electrode width such that the tangen-
tial current can be neglected. One can model this charging mechanism with a distributed system of a
capacitor and resistor in series: the double/diffuse layer behaves as a capacitor, and the electroneutral
region behaves as a resistor. A charge balance in the normal direction across the double layer results in
σ
ϭ (9.4)
where
σ
is the conductivity,
φ
is the electric potential, q is the charge per unit area in the double layer, and
n represents the normal direction to the electrode surface. If the voltage drop across the diffuse double
layer is sufficiently small (∆
φ
Ͻ RT/F ϭ 0.025V), there is a linear relationship between the charge and the
voltage from the Debye–Huckel approximation of the Boltzmann charge distribution, i.e. q ϭ C
DL
(
φ
Ϫ V).
Equation (9.4) can then be written in the complex form of a Fourier series as
σ
ϭ
i
ω
q
ϭ
i
ω
C
DL
(
φ
Ϫ
V
)
(9.5)
where C
DL
ϭ
ᎏ
λ
ε
ᎏ
is the capacitance per unit of area of the total double layer,
ε
is the dielectric permittivity
of the solvent, and
λ
is the double layer thickness. To make it more accurate, sometimes C
DL
is given by
a combination of two capacitors in series — the Stern or compact layer capacitance C
s
, and the diffuse
double layer capacitance C
d
, which is
ᎏ
λ
ε
ᎏ
[Gonzalez et al., 2000],
C
DL
ϭ
(9.6)
C
s
C
d
ᎏ
C
s
ϩ C
d
∂
φ
ᎏ
∂y
∂q
ᎏ
∂t
∂
φ
ᎏ
∂n
9-8 MEMS: Applications
© 2006 by Taylor & Francis Group, LLC
Although experimentally the potential drop across the diffuse double layer can exceed 0.025 V, the linear
analysis still gives useful information on the flow. The nonlinearity will become more important at higher
applied potential as suggested in [Bazant et al., 2004].
From Gonzalez et al. (2000), the velocity scales as E
2
, where E is the external field. At lower frequencies,
the potential drop will mostly occur across the double layer, so the tangential field is small. At higher fre-
quencies, there is not enough time for the charges to migrate into and accumulate within the double layer,
so the potential drop will mostly occur in the bulk. There hence exists an optimum frequency at which
the velocity has a maximum. This optimum frequency is determined by the diffusivity D, the double layer
thickness
λ
, and the macroscopic length scale L and can be described by
ᎏ
λ
D
L
ᎏ
.
However, if the applied voltage is larger than the ionization potential of the electrodes or the ion
species in the electrolyte, reaction at the electrolyte–electrode interface will produce or consume ions. In
the first half-cycle, the left electrode has a positive potential; that is, the electric field is from the left to the
right electrode. During the anodic reaction cycle for this electrode, metal can lose electrons and eject
metal ions. A possible anodic reaction is
M → M
ϩn
ϩ ne
Ϫ
. (9.7)
Water electrolysis may also happen at the acidic conditions
3H
2
O → 2H
3
O
ϩ
ϩ 1/2O
2
ϩ 2e
Ϫ
, (9.8)
or for the basic condition,
2OH
Ϫ
→ H
2
O ϩ 1/2O
2
ϩ 2e
Ϫ
. (9.9)
The coions in the solution still move to the left electrode. However, if the reactions in Equations (9.7) and
(9.8) dominate at higher potentials, as shown in Figure 9.5a, the net ions or net charges accumulated on
the electrode will be positive, which is the opposite of capacitive charging in Figure 9.4a. On the right
electrode, cathodic reactions occur. The reaction could be metal deposition:
M
ϩn
ϩ ne
Ϫ
→ M. (9.10)
Water electrolysis reaction for acidic condition could be
2H
3
O
ϩ
ϩ 2e
Ϫ
→ 2H
2
O ϩ H
2
, (9.11)
Nonlinear Electrokinetic Devices 9-9
V cos t
−V cos t
V cos t
−V cos t
V cos t
−V cos t
V cos t
−V cos t
F
F
F
(a) (b)
(c) (d)
FIGURE 9.5 (See color insert following page 2-12.) Schematic illustration of the Faradaic charging: (a) and (b) on the
left, anions are driven to the same electrode surface where cations are produced by a Faradaic anodic reaction during
the half-cycle when the electrode potential is positive; (c) and (d) the flow directions are opposite to those in Figure 9.4.
© 2006 by Taylor & Francis Group, LLC
or, for the basic conditions,
2H
2
O ϩ 2e
Ϫ
→ 2OH
Ϫ
ϩ H
2
. (9.12)
Like the left electrode, cations still move to this electrode such that positive charges accumulate on the
surface. Only reaction (9.12) produces negative ions. If this reaction dominates at higher potentials, the
net accumulated charges on this electrode will be negative, as shown in Figure 9.5b.InFigure 9.4a and b
and Figure 9.5a and b, the directions of the electric field are the same, so they will produce opposite flow
fields, as shown in Figure 9.4c and Figure 9.5c and d. Moreover, positive ions produced in the anodic reac-
tion cycle will increase the local potential, and negative ions produced in the cathodic reaction cycle will
reduce it. The resultant electric field outside the double layer is increased by this effect because the charge
in the double layer has the same polarization as the electrode, thus amplifying the effective electrode field.
In contrast, at lower frequencies, capacitive charging of ions with opposite polarization to the electrode
tends to screen the electrode field. Hence, flow due to such Faradaic reaction charging exists at any fre-
quency that is less than the inverse reaction time.
The flow does not necessarily reverse because of the reaction. For example, if the reaction in Equation
(9.10) dominates at the left electrode during its anodic reaction cycle, the flow will be in the same direction
as that for capacitive charging. In the same sense, if the reaction in Equations (9.10) or (9.11) dominates
in its cathodic cycle, the flow will not reverse either. For a detailed description, see [Ben et al., 2004, Ben, 2004].
A simple zeroth-order reaction model is discussed below. This model assumes that ion production
dominates ion consumption at the same electrodes, which produces a specific polarization and flow
direction that is not shared by a general Faradaic charging mechanism. Nevertheless, it is a basic model
that captures a large class of Faradaic reactions. A charge balance without considering the detail structure
of the double layer can be written as follows,
(
φ
Ϫ Vcos
ω
t) ϯ zRF cos
ω
t ϭ
σ
,
(9.13)
where z is the valence and R is the reaction constant for a constant reaction that is independent of con-
centration and electrode potential, except that it has an opposite sign on the two electrodes. The – sign
applies to the right electrode at a Ͻ x Ͻ L ϩ a, and the ϩ sign to the left electrode at ϪL Ϫ a Ͻ x Ͻ Ϫa.
To simplify the problem, we have assumed that the reaction constants are equal for anodic and cathodic
reactions. The first term in Equation (9.13) represents the charge accumulation as that in Equation (9.5);
the third term represents the Ohmic current; and the second term, the reaction. With Faradaic reaction,
the double layer behaves as a capacitor and an ion source/sink in parallel with a resistor in series. Upon
Fourier transform in time
(
ᎏ
∂
∂
t
ᎏ
→ i
ω
)
, Equation (9.13) becomes an effective boundary condition involv-
ing complex coefficients,
i
ω
(
φ
Ϫ V) ϯ RF ϭ
σ
.
(9.14)
We shall use the simple model Equation (9.14) in some of our global flow field calculations. It replaces
the purely capacitive charging model of Equations (9.4) and (9.5). As such, the potential
φ
becomes a
complex potential.
We return to the two parallel, symmetric, and infinitely long electrodes on a nonconducting substrate,
as shown schematically in Figure 9.4. We designate the separation between the two electrodes as 2a, the
width of each electrode as L.
In the electroneutral Ohmic bulk region outside the double layer, the electric potential
φ
satisfies the
Laplace equation
∇
2
φ
ϭ 0 (9.15)
With a thin polarized layer approximation, the Maxwell stress in the polarized layer has been shown
[Gonzalez et al., 2000] to produce a time-average slip velocity on the wall,
∂
φ
ᎏ
∂n
∂
φ
ᎏ
∂n
∂
ᎏ
∂t
ε
ᎏ
λ
9-10 MEMS: Applications
© 2006 by Taylor & Francis Group, LLC
〈u〉 ϭ Ϫ ∇
s
(
|
∆V
|
)
2
ϭ Ϫ ∇
s
|
φ
ϯ V|
2
(9.16)
where
ε
is the dielectric constant,
µ
is the viscosity, ∇V is the potential drop across the polarization layer
of each electrode (corresponding to the different signs), and ∇
s
denotes a surface gradient and the
absolute sign is taken of the complex variables within. As the electrode potential amplitude V is constant,
the stagnation points correspond to regions where the tangential gradient of the outer ohmic potential
(i.e., the outer tangential field) ∇
s
φ
vanishes.
Equation (9.16) is coupled to the bulk potential in Equation (9.15) and represents the effective slip
condition for the bulk creeping flow equation
µ
∇
2
u ϭ ∇p. Combined with Equation (9.14), the effective
boundary condition for electric potential
φ
, the bulk problem is closed.
If Faradaic charging dominates there is no charge accumulation, and the Faradaic charge generation is
balanced by electromigration away from the electrode to produce a constant current density boundary
condition
ϭ
Ϯ
(9.17)
The Faradaic polarization and current are hence in phase and both persist at low frequencies.
If the Faradaic reaction is weak at low voltages, the current
σ
ᎏ
∂
∂
φ
y
ᎏ
changes direction such that it now
charges the electrode. A low-frequency expansion of electric potential
φ
ϭ
φ
0
ϩ
ωφ
1
ϩ
ω
2
φ
2
…, after a
Fourier transform then yields
σ
ϭ ϯiCV,
σ
ϭ ϯiC
φ
n
(n Ͼ 0)
(9.18)
where the first nontrivial capacitive current
σ
ᎏ
∂
∂
φ
y
1
ᎏ
is out-of-phase with the voltage and all the other
φ
nϩ1
have a 90° lag to the previous
φ
n
. Potential on the nonconducting surfaces without a metal cover for
|x| Ͻ a and |x| Ͼ L ϩ a satisfies the insulation condition
ϭ 0.
(9.19)
Hence, at every order, the normal field
ᎏ
∂
∂
φ
y
n
ᎏ
ϭ 0 is specified at the boundary, and a Neumann problem
results.
The solution to the bulk Laplace Equation (9.15) with Neumann conditions Equations (9.17)–(9.19)
can be conveniently represented by the double layer Green’s integral formula:
φ
ϭ ͵
Lϩa
ϪLϪa
(x
0
)G(x
0
, x, y)dx
0
(9.20)
where the Green’s function due to a unit line source is
G ϭ ln
(
(x Ϫ x
0
)
2
ϩ y
2
)
.
(9.21)
For Faradaic charging, the solution is
φ
ϭ
Ά
(L ϩ a Ϫ x)log
΄
(L ϩ a Ϫ x)
2
ϩ y
2
΅
ϩ 2yarctan Ϫ (a Ϫ x) log
΄
(a Ϫ x)
2
ϩ y
2
΅
Ϫ 2yarctan ϩ (a ϩ x)log
΄
(a ϩ x)
2
ϩ y
2
΅
ϩ 2yarctan
Ϫ (L ϩ a ϩ x) log
΄
(L ϩ a ϩ x)
2
ϩ y
2
΅
Ϫ 2yarctan
·
(9.22)
L ϩ a ϩ x
ᎏᎏ
y
a ϩ x
ᎏ
y
a Ϫ x
ᎏ
y
L ϩ a Ϫ x
ᎏᎏ
y
RF
ᎏ
2
πσ
1
ᎏ
2
π
∂
φ
ᎏ
∂y
∂
φ
ᎏ
∂y
∂
φ
nϩ1
ᎏ
∂y
∂
φ
1
ᎏ
∂y
RF
ᎏ
σ
∂
φ
ᎏ
∂y
ε
ᎏ
4
µ
ε
ᎏ
4
µ
Nonlinear Electrokinetic Devices 9-11
© 2006 by Taylor & Francis Group, LLC
The resulting equal potential lines are plotted in Figure 9.6c. As expected from two isolated collinear line
sources with uniform intensity, the electric potential is antisymmetric, and there are two potential
extrema on the electrode surface with the same value but with different signs. This means that the sur-
face electric field is zero and changes directions at the extrema as shown in Figure 9.6d.
By letting the tangential field
ᎏ
d
d
φ
x
ᎏ
at y → 0 equal zero, we obtain the locations of the extrema and, from
(9.22), the stagnation points:
x
stag
ϭ Ϯ
͙
(L
ෆ
ϩ
ෆ
a
ෆ
)
2
ෆ
ϩ
ෆ
a
ෆ
2
ෆ
. (9.23)
When L ϾϾ a, x
stag
ϭ ϮL/
͙
2
ෆ
. Equation (9.16) shows that slip velocity is proportional to
ᎏ
d
d
φ
x
ᎏ
and the
surface flow on the electrode is inward between the two stagnation points and outward outside the stagna-
tion points. Two pairs of large vortices, each with size
ᎏ
͙
L
2
ෆ
ᎏ
and
(
1 Ϫ
ᎏ
͙
1
2
ෆ
ᎏ
)
L, will then be driven by this sur-
face flow above the electrodes.
͙
2
ෆ
ᎏ
2
9-12 MEMS: Applications
−20 −10 0 10 20
−20
−10
0
10
20
(b)
−20 −10 0 10 20
−30
−20
−10
0
10
20
30
(a)
−20 −10 0 10 20
5
10
15
20
25
30
(d)
−20 −10 0 10 20
5
10
15
20
25
30
−
3.0655
−
2.2991
−
1.5327
−
0.76636
0
0.766
36
1.5327
2.2991
3.0655
(c)
FIGURE 9.6 (a) and (b): Oscillatory convergence of imaginary part and real part of
φ
for the low-frequency expansion
ansatz of capacitive charging at the frequency
ω
ϭ 0.12 and at an applied voltage of V ϭ 40. Here,
ω
and V are dimen-
sionless variables. The characteristic frequency is D/
λ
L and the characteristic potential is RT/F ϭ 25mV. The thicker
lines are the converged
φ
i
and
φ
r
respectively. The potential and field lines of Faradaic charging are shown in (c) and
(d) where the stripes represent the electrodes. The dimensionless value of a is 1, and that of L is 10. The electrode
tangential field vanishes at Ϯ8.
© 2006 by Taylor & Francis Group, LLC
For capacitive charging, a series of Neumann problems have to be solved for
φ
n
in Equation (9.18). The
leading-order solution
φ
1
corresponds to the low-frequency limit when the double layer is fully polarized
and the external field is screened. Therefore, the total potential drop 2V is entirely across the two sym-
metric double layers and the resulting field drives the current that charges the double layer, that is
ᎏ
∂
∂
φ
y
1
ᎏ
ϭ ϯiCV/
σ
. As in the constant current density condition Equation (9.17) of Faradaic charging, this
current density condition for capacitive charging produces the same extrema in
φ
1
as in Equation (9.23).
However, a recursive condition Equation (9.18) for subsequent orders
φ
n
that captures finite accumula-
tion effects shows that the normal field
ᎏ
∂
φ
∂
n
y
ϩ1
ᎏ
in the next order is proportional to the potential (charge) of
the previous order. As a result, nonuniform charging occurs at all higher order terms, but the extrema
remain invariant at Equation (9.23) for all orders. Since the stagnation line is independent of the magni-
tude of the specified flux in the Neumann condition, our small
ω
expansion shows that it exists at
any frequency lower than the characteristic frequency D/
λ
L for capacitive charging [Ajdari, 2002;
Morgan, 2003]. For higher frequencies, the stagnation lines also could exist, although this is beyond our
current theory.
The circulation intensity for capacitive charging is different, however, from Faradaic charging.
Furthermore, the circulation direction is exactly opposite. Capacitive flow at the stagnation point x
stag
,
converges toward a vertical plane. Particles convected by the capacitive flow would need to move verti-
cally upward in this plane. However, the vertical flow is weak at the stagnation point and an opposite ver-
tical force can prevent this vertical motion away from the electrodes. The particles would then be trapped
at the stagnation line, as seen in Figure 9.7. Such an opposite vertical force on the particle can be a DEP
force [Pohl, 1978], which is a short-range force as described in Equation (9.3). It also can be gravitational
force if the particle is not negatively buoyant and the electrode is at the bottom of the container. These
weak forces on the particle are overwhelmed by AC eletroosmotic convection due to capacitive charging
everywhere except at the stagnation lines.
In contrast, Faradaic flow at the stagnation point x
stag
is a diverging flow toward the electrode surface.
On the electrode surface, the tangential electroosmotic convection is perpendicular to DEP or any other
Nonlinear Electrokinetic Devices 9-13
(b)
(a)
FIGURE 9.7 (See color insert following page 2-12.)Particle focusing lines along the stagnation points for capacitive
charging. The vertical force toward the electrode is a weak DEP or gravitational force. The circulation is opposite for
Faradaic charging. An actual image of the assembled particles is shown below.
© 2006 by Taylor & Francis Group, LLC
weak vertical force. Hence, particle convection cannot be eliminated by these other forces. Therefore, one
does not expect any trapping with Faradaic flow. In fact, any particle assembly at x
stag
is expected to be
swept away by the Faradaic flow in a reverse erasure mechanism.
To verify this prediction, 100 nm Al and Ti/Au electrodes are fabricated using photolithography and
liftoff. The separation between the two electrodes is 20 µm and the electrode width L is 300µm. An AC
electric potential at 100 Hz was applied between two electrodes. Latex particles 5 microns in diameter and
of concentration of about 10
6
particles per cc are suspended in DI water and are allowed to settle by grav-
ity onto the electrodes. For all electrodes, linear self-assembly is observed at low voltages and, although
the demarcation voltage varies with electrode material. Erasure is not observed until V ϭ 3.6 Vrms for Al
but occurs at V ϭ 2.2 Vrms for Au. In Figure 9.8, the formation and stage-wise erasing of the lines are
imaged for Au electrodes. Before their collection onto the electrodes, the particles are also observed to be
convected by the vortices with circulations consistent with capacitive and Faradaic charging during the
writing and erasing conditions respectively.
Concentrating and segregating microsized particles in electrolytes are extremely slow and difficult.
Natural or imposed attractive forces (electrostatic, gravitational, electrophoretic, dielectrophoretic, etc.)
are very weak and short range due to Debye screening and high-power (quadratic or cubic) scaling with
respect to particle size. Yet the vortices generated by our AC electrokinetic mechanisms have normal
dimensions as large as the electrode width, which can be increased almost indefinitely. Their linear veloc-
ity also can reach as high as 1 mm/s. The use of such a long-range and strong hydrodynamic force to focus
particles first to a plane and then to a line (3D to 1D projection) offers a very attractive mechanism to
rapidly trap and concentrate particles in dilute suspensions.With AC capacitive charging, Wu et al. (2004)
can concentrate bacteria of 10
4
cells per cc. Two co ncentrated bacteria lines are shown in Figure 9.9.
9-14 MEMS: Applications
(a)
(c)
(b)
(d)
1Vrms
2,2Vrms
FIGURE 9.8 (See color insert following page 2-12.) The writing and erasure processes for Au electrodes at
ω
ϭ 100 Hz. The frames are taken at 0s, 5 s, 10s, and 15s after the field is turned on. The initial voltage is 1.0 Vrms
and is increased to 2.2 Vrms at 7.0 s. Particles on the electrode in the first two frames (a) and (b) move in directions
consistent with electro-osmotic flow due to capacitive charging and assemble into lines. They are erased by Faradaic
charging in the next two frames (c) and (d). The arrows demonstrate the direction of particle motion. The dashed
lines are located at the theoretical L
/
͙
2
ෆ
.
© 2006 by Taylor & Francis Group, LLC
We have shown that AC electroosmotic flow tends to generate closed vortices. These closed vortices are
good for micromixers but do not produce the net flow required for pumps. Ajdari (2000) and Ramos
et al. (1999) have proposed a solution by using nonsymmetric electrodes and lowering the upper chan-
nel wall to suppress the back flow of the larger vortex on the larger electrode. However, AC electroosmotic
due to capacitive charging only exist in a narrow frequency window. As shown before, reactions will not
screen the electric field at the lower frequency and reverse the flow directions. With the reaction consid-
ered, several designs can be used to break the symmetry to obtain a net flow:
1. An asymmetric electrode geometry can be exploited.
2. The applied potential can be programmed asymmetrically such as by imposing a traveling wave
electric field.
3. A combination of breaking both the geometric symmetry and the electric field symmetry can be used.
An optimum design has yet to be proposed. Lastochkin et al. (2004) reported a new AC pump design
based on AC Faradaic reactions on the electrodes by breaking the geometry symmetry with series of
orthogonal electrode elements.
The T electrode can be regarded as the most asymmetric design and produces net flow down the tip
without a top wall, as shown in Figure 9.10. The transverse flows along the horizontal arm cancel
each other while the longitudinal flow down the tip is unabated above the planar electrode. In the experi-
ments, avoltage larger than 10 volt is used. The reaction constant should be an exponential function
of ϮV cos
ω
t Ϫ
φ
, the potential drop across the polarization layer. To the leading order,
φ
is assumed to be
constant along the electrode (Ben, 2004). Hence, the reaction constant is an exponential function of the
applied voltage. Although a stagnation point exists on the orthogonal electrode, it is expected that little
back flow would develop because the flow is three dimensional.
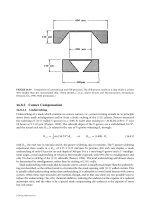
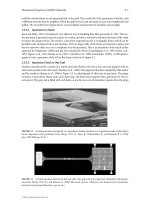
The pump with 16 T-shaped aluminum electrodes, each measuring 100 microns in width, has been
fabricated on glass with standard lithography techniques in the clean room as shown in Figure 9.10 and
successfully tested. Every other T electrode has the same polarity. Frequencies between 200 KHz and
Nonlinear Electrokinetic Devices 9-15
FIGURE 9.9 (See color insert following page 2-12.) Bacteria trapping by AC electroosmotic flow.
FIGURE 9.10 Fabricated planar T electrode arrays made of Aluminum in 1 µm thickness for AC micropump.
The electrodes are 100 microns wide; the length of each element within the array is 1 mm; the gap between T elements
is 300 µm; and the entire array is 2 cm in length. Every other T element has the same polarity.
© 2006 by Taylor & Francis Group, LLC
1 MHz were used in experiments, and the electrolyte was NaCl. The fluid was flowing continually from
right to the left. The velocities are plotted in a semi-log scale as a function of velocity at the deferent
frequencies in Figure 9.11. The results indicate an exponential dependence on the voltage because the
reaction constant is an exponential function of the applied potential as expected. This is larger than the usual
quadratic scaling expected from non-Faradaic AC electroosmosis like AC capacitive charging. It is, in fact,
consistent with the Arhenius exponential dependence of redox or dissolution reactions on voltage. Due
to this exponential scaling, velocities exceeding 1 mm/s can be achieved with the T-electrode micropump.
The operating conditions are such that bubbles are not observed and conductivity measurement after
operating the pump for hours shows little net ion generation even though there is obviously ion production
at the electrode during each half-cycle. Electrolytes with different conductivities are chosen. The velocity
reaches a constant asymptote or blows up as the frequency decreases — in contrast to the capacitive
charging mechanism, which would produce a negligible velocity at low frequency due to external field
screening. This is consistent with the nonscreening Faradaic charging mechanism, as a longer period
increases the Faradaic polarization without screening the external field. Lastochkin et al. (2004) observe
the AC electroosmotic velocity to increase as conductivity increases from 0.001 S/m to 0.01 S/m. This fea-
ture is again different from linear electrokinetics and AC capacitive charging mechanisms where a higher
conductivity usually means higher electrolyte concentration and a thinner double layer. One explanation
is that the reaction kinetic constant depends on the potential drop across the Stern layer. The higher the
conductivity of the solution, the lower the potential drop in the electroneutral region. As a result, the
potential drop across the Stern layer increases and the reaction constant increases such that more charges
are produced by Faradaic charging. Finally, Lastochin et al. are able to increase their rms voltage to 20 V,
corresponding to a large field in excess of 300 V/cm for their electrode separation of less than 100
microns, without producing bubbles. In contrast, bubbles would appear at a DC electrode beyond 1 or 2
volts. Linear electrokinetic pumps even with their high voltages rarely employ a field strength that exceeds
9-16 MEMS: Applications
10
6
10
5
10
4
10
3
5 10 15 20 25
V
d=500 µm κ= 0.1, 0.01 S/m
d=500 µm κ=0.1, 0.01,0.001 S/m
d=500 µm κ=0.1, 0.001 S/m
Ud
FIGURE 9.11 Experimental measured velocities at different frequencies and different voltages before bubbles occur.
© 2006 by Taylor & Francis Group, LLC
100 V/cm. Fields higher than 100 V/cm often denaturalize proteins and produce significant Joule heating.
Nevertheless, the AC Faradaic micropumps of Lastochkin et al. show that nonlinear electrokinetics by the
AC Faradaic mechanism can allow high fields to achieve high flow and velocity for high-conductivity
biofluids without generating bubbles or ions — all clear advantages over linear electrokinetic pumps and
AC pumps without Faradaic reaction.
9.4 Summary
We have reviewed the general features, advantages, and shortcomings of electrokinetic devices for
microfluidic applications. Two specific designs based on AC Faradaic charging are discussed in detail.
One captures, concentrates, and disperses bioparticles, and the other pumps fluids at high speed without
bubble generation and ion contamination. It is expected that many more such nonlinear electrokinetic
devices will be proposed in the near future.
Acknowledgments
Our electrokinetics research at the Center for Micro-Fluidics and Medical Diagnostics at the University
of Notre Dame has benefited from an excellent group of Ph.D. and postdoctoral students. We would like
to acknowledge those who have contributed to the work reported here (with their current affiliation if
they have left Notre Dame) in chronological order: P. Takhistov (Rutgers), A. Indeikina, A. Minerick
(Missippi State), S. Thamida (Unilever), J. Wu (Tennessee), S C. Wang (Chong Cheng), D. Lastochkin,
R. Zhou, and P. Wang.
References
Ajdari, A. (1995) “Electro-Osmosis on Inhomogeneously Charged Surfaces,” Phys. Rev. Lett., 75, p. 755.
Ajdari, A. (2000) “Pumping Liquids Using Asymmetric Electrode Arrays,” Phys. Rev. E, 61, p. R45.
Ajdari, A. (2002) “Electrokinetic ‘Ratchet’ Pumps for Microfluidics,” Appl. Phys. A, 75, p. 271.
Aris, R. (1956) “On the Dispersion of a Solute in a Fluid Flowing Through a Tube,” Proc. Roy. Soc. London
A, 235, p. 67.
Barany, S. Mishchuk, N.A., and Prieve, D.C. (1998) “Superface Electrophoresis of Conducting Dispersed
Particles,” J. Colloid. Interf. Sci., 207, p. 240.
Bazant, M.Z., and Squires, T.M. (2004) “Induced-Charge Electrokinetic Phenomena: Theory and
Microfluidic Applications,” Phys. Rev. Lett., 92, p. 066101.
Bazant, M.Z., Thornton, K., and Ajdari, A. (2004) “Diffuse-Charge Dynamics in Electrochemical
Systems,” preprint.
Ben, Y. (2004) Nonlinear Electrokinetic Phenomena in Microfluidic Devices, Ph.D. dissertation,
University of Notre Dame.
Ben, Y., and Chang, H C. (2002) “Nonlinear Smoluchowski Slip Velocity and Micro-Vortex Generation,”
J. Fluid Mech., 461, p. 229.
Ben, Y., Wu, J., and Chang, H C. (2004) “Linear Particle Assembly and Erasure by AC Electroosmotic
Flow,” in preparation.
Brown, A.B.D., Smith, C.G., and Rennie, A.R. (2000) “Pumping of Water with AC Electric Fields Applied
to Asymmetric Pairs of Microelectrodes,” Phys. Rev. E, 63, p. 016305.
Chang, D.C. (1989) “Cell Fusion and Cell Poration by Pulsed Radio-Frequency Electric Fields,” in
Electroporation and Electrofusion in Cell Biology, Neumann, E., Sowers, A.E., and Jordan, C.A., eds.,
Plenum Press, New York.
Chang, H C. (2001) “Bubble/Drop Transport in Microchannels,” in The MEMS Handbook, 1st ed.,
p. 11–1, CRC Press, Boca Raton.
Cheng, J., and Kricka, L.J. (2001) Biochip Technology, Harwood Academic Publishers.
Cui, L., and Morgan, H. (2000) “Design and Fabrication of Travelling Wave Dielectrophoresis Structure,”
J. Micromech. Microeng., 10, p. 72.
Delgado, A.V. (2002) Interfacial Electrokinetics and Electrophoresis, Marcel Dekker, Inc, New York.
Nonlinear Electrokinetic Devices 9-17
© 2006 by Taylor & Francis Group, LLC
Dukhin, S.S. (1991) “Electrokinetic Phenomena of the Second Kind and Their Application,” Adv. Colloid.
Interf. Sci., 35, p. 173.
Dutta, D., and Leighton, D.T. (2001) “Dispersion Reduction in Pressure Driven Flow through
Microetched Channels,” Anal. Chem., 73, p. 504.
Gascoyne, P.R.C., and Vykoukal, J. (2002) “Particle Separation by Dielectrophoresis,” Eletrophoresis, 23,
p. 1973.
Gimsa, J., and Wachner, D. (1998) “A Unified Resistor-Capacitor Model for Impedance, Dielectrophoresis,
Electrorotation, and Induced Transmembrane Potential,” Biophys. J., 75, p. 1107.
Gimsa,J.(2001) “A Comprehensive Approach to Electro-Orientation,Electrodeformation,Dielectrophoresis,
and Electrorotation of Ellipsoidal Particles and Biological Cells,” Bioelectrochemistry, 54, p. 23.
Gonzalez, A., Ramos, A., Green, N.G., Castellanos, A., and Morgan, H. (2000), “Fluid Flow Induced by
Nonuniform AC Electric Fields in Electrolytes on Microelectrodes: 2. A Linear Double-Layer
Analysis,” Phys. Rev. E, 61, p. 4019.
Green, N.G., Ramos, A., Gonzalez, A., Morgan, H., and Castellanos, A. (2000) “Fluid Flow Induced by
Nonuniform AC Electric Fields in Electrolytes on Microelectrodes: 1. Experimental
Measurements,” Phys. Rev. E, 61, p. 4011.
Green, N.G., Ramos, A., Gonzalez, A., Morgan, H., and Castellanos, A. (2002) “Fluid Flow Induced by
Nonuniform AC Electric Fields in Electrolytes on Microelectrodes: 3. Observation of Streamlines
and Numerical Simulation,” 66, p. 026305-1.
Herr, A.E., Molho, J.I., Santiago, J.G., Mungal, M.G., Kenny, T.W., and Garguilo, M.G. (2000)
“Electroosmotic Capillary Flow with Nonuniform Zeta Potential,” Anal. Chem., 72, p. 1052.
Hu, Y., Glass, J.L., and Griffith, A.E. (1994) “Observation and Simulation of Electrohydrodynamic
Instabilities in Aqueous Colloidal Suspensions,” J. Chem. Phys., 100, p. 4674.
Hughes, M.P. (2002) “Strategies for Dielectrophoretic Separation in Laboratory-on-a-chip Systems,”
Electrophoresis, 23, p. 2569.
Hughes, M.P. (2003) Nanoelectromechanics in Engineering and Biology, CRC Press, Boca Raton.
Jones, T.B. (1995) Electromechanics of Particles, Cambridge University Press, New York.
Jones, T.B., Wang, K L., and Yao, D J. (2004) “Frequency-Dependent Electromechanics of Aqueous
Liquids: Electrowetting and Dielectrophoresis,” Langmuir, 20, p. 2813.
Koch, M., Evans A., and Brunnschweiler, A. (2000) Microfluidic Technology and Applications, Research
Studies Press LTD, Philadelphia.
Laser, D.J., and Santiago, J.G. (2004) “A Review of Micropumps,” J. Micromech. Microeng., 14, p. R35.
Lastochkin, D., Zhou, R., Wang, P., Ben, Y., and Chang, H C. (2004) “Electrokinetic Micropump and
Micro-Mixer Design Based on AC Faradaic Polarization,” accepted, J. Appl.Phys. D.
Minerick, A.R., Ostafin, A.E, and Chang, H C. (2002) “Electrokinetic Transport of Red Blood Cells in
Microcapillaries,” Electrophoresis, 23, p. 2165.
Minerick, A.R., Zhou, R., Takhistov, P., and Chang, H C. (2003) “Manipulation and Characterization of
Red Blood Cells with AC Fields in Micro-Devices,” Electrophoresis, 24, p. 3703.
Mishchuk, N.A., and Takhistov, P.V. (1995) “Electroosmosis of the Second Kind,” Colloid. Surf. A, 95, p. 119.
Morgan, H., and Green, N.G. (2003) AC Electrokinetics: Colloids and Nanoparticles, Research Studies
Press, Ltd, Philadelphia.
Morgan, H., Izquierdo, A.G., Bakewell, D., Green, N.G., and Ramos, A. (2001) “The Dielectrophoretic and
Travelling Wave Forces Generated by Interdigitated Electrode Arrays: Analytical Solution Using
Fourier Series,” J. Phys. D: Appl. Phys., 34, p. 1553
Morrison, F.A., Jr. (1970) “Electrophoresis of a Particle of Arbitrary Shape,” J. Colloid. Interf. Sci., 34, 210.
Mpholo, M., Smith, C.G., and Brown, A.B.D. (2003) “Low Voltage Plug Flow Pumping Using Anisotropic
Electrode Arrays,” Sensors Actuators B, 92, p. 262.
Murtsovkin, V.A. (1996) “Nonlinear Flows Near Polarized Disperse Particles,” Colloid J., 58, p. 341.
Nadal, F., Argoul, F., Hanusse, P., Pouligny, B., and Ajdari, A. (2002) “Electrically Induced Interactions
between Colloidal Particles in the Vicinity of a Conducting Plane,” Phys. Rev. E, 64, p. 061409.
Nguyen, N.T., and Wereley, S.T. (2002) Fundamentals and Applications of Microfluidics, Artech House
Publisher, Boston.
Pethig, R. (1996) “Dielectrophoresis: Using Inhomogeneous AC Electrical Fields to Separate and
Manipulate Cells,” Crit. Rev. Biotechnol., 16, p. 331.
Pohl, H.A. (1978) Dielectrophoresis, Cambridge University Press, Cambridge.
Probstein, R.F. (1994) Physicochemical Hydrodynamics, Wiley-Interscience, New York.
9-18 MEMS: Applications
© 2006 by Taylor & Francis Group, LLC
Ramos, A., Gonzalez, A., Castellanos, A., Green, N.G., and Morgan, H. (2003) “Pumping of Liquids with
AC Voltages Applied to Asymmetric Pairs of Microelectrodes,” Phys. Rev. E, 67, p. 056302-1.
Ramos, A., Morgan, H., Green, N.G., and Castellanos, A. (1999) “AC Electric-Field-Induced Fluid Flow in
Microelectrodes, J. Colloid. Interf. Sci., 217, p. 420.
Reyes, D.R., Iossifidis, D., Auroux, P A., and Manz, A. (2002) “Micro Total Analysis Systems. 1.
Introduction, Theory, and Technology,” Anal. Chem., 74, 2623.
Rhodes, P.H., and Snyder, R.S. (1994) “Theoretical and Experimental Studies on the Stabilization of
Hydrodynamic Flow in Free Fluid Electrophoresis,”in Cell Electrophoresis,by J.Bauer,p.75,Boca Raton.
Russel, W.B., Saville, D.A., and Schowalter, W.R. (1989) Colloidal Dispersion, Cambridge University
Press, Cambridge, New York.
Sides, P.J. (2001) “Electrohydrodynamic Particle Aggregation on an Electrode Driven by an Alternating
Electric Field Normal to It,” Langmuir, 17, p. 5791.
Sides, P.J. (2003) “Calculation of Electrohydrodynamic Flow around a Single Particle on an Electrode,”
Langmuir, 19, p. 2745.
Solomentsev, Y., Bohmer, M., and Anderson, J.L. (1997) “Particle Clustering and Pattern Formation dur-
ing Electrophoretic Deposition: A Hydrodynamic Model,” Langmuir, 13, p. 6058.
Solomentsev, Y., Guelcher, S.A., Bevan, M., and Anderson, J.L. (2000) “Aggregation Dynamics for Two
Particles during Electrophoretic Deposition Under Steady Fields,” Langmuir, 16, p. 9208.
Squires, T., and Bazant, M.Z. (2004) “Induced Charge Electro-Osmosis”, J. Fluid Mech., 509, p. 217.
Studer, V., Pepin, A., Chen Y., and Ajdari, A. (2002) “Fabrication of Microfluidic Devices for AC
Electrokinetic Fluid Pumping,” Microelectron. Eng., 61, p. 915.
Stone, H.A., and Kim, S. (2001) “Microfluidics: Basic Issues, Applications, and Challenges,” AICHE J.,
47, p. 1250.
Stone, H.A., Strook, A.D., and Ajdari, A. (2004) “Engineering Flow in Small Devices: Microfluidics
towards Lab-on-a-Chip,” Annu. Rev. Fluid Mech., 36, p. 381.
Stroock, A.D. , Dertinger, S.K.W, Ajdari, A, Mezic, I., and Stone, H.A., Whitesides, G.M. (2002) “Chaotic
Mixer for Microchannels,” Science, 295, p. 647.
Takhistov, P., Duginova, K., and Chang, H C. (2003) “Electrokinetic Mixing Vortices Due to Electrolyte
Depletion at Microchannel Junctions,” J. Colloid. Interf. Sci., 263, pp. 133–43.
Taylor, G.I. (1954) “The Dispersion of Matter in Turbulent Flow through a Pipe,” Proc. Roy. Soc. London
A, 223, p. 446.
Thamida, S.K., and Chang, H C. (2002) “Nonlinear Electrokinetic Ejection and Entrainment Due to
Polarization at Nearly Insulated Wedges,” Phys.Fluids, 14, p. 4315.
Trau, M., and Battersby, B.J. (2001) “Novel Colloid Materials for High-Throughput Screening
Applications in Drug Discovery and Geomics,” Adv. Mater., 13, p. 975.
Trau, M., Saville, D. A., and Aksay, I.A. (1996) “Field-Induced Layering of Colloidal Crystals,” Science, 272,
p. 706.
Trau, M., Saville, D.A., and Aksay, I.A. (1997) “Assembly of Colloidal Crystals at Electrode Interfaces,”
Langmuir, 13, p. 637.
Wang, S C., Lai, Y W., Ben, Y., and Chang, H C. (2004) “Microfluidic Mixing by AC and DC Nonlinear
Vortex Flows,” Ind. Eng. Chem. Res., accepted, 43, p. 2902.
Wang, X., Wang, X.B., and Gascoyne, P.R. (1997) “General Expressions for Dielectrophoretic Force and
Electrorotational Torque Derived Using the Maxwell Stress Tensor Method,” J. Electrostat., 39, p. 277.
Wang, X.B., Pethig, R., and Jones, T.B. (1992) “Relationship of Dielectrophoretic and Electrorotational
Behavior Exhibited by Polarized Particles,” J. Phys. D: Appl. Phys., 25, p. 905.
Wu, J., Ben, Y., Battigelli, D., and Chang, H C. (2005) “Long-Range AC Electro-Osmotic Trapping and
Detection of Bioparticles,” submitted to Ind. Eng. Chem. Res., 44, p. 2815.
Yao, S.H., Hertzog, D.E., Zeng, S.L., Mikkelsen, J.C., and Santiago, J.G. (2003) “Porous Glass
Electroosmotic Pumps: Design and Experiments,” J. Colloid. Interf. Sci., 268, pp. 143–53.
Yeh, S.R., Seul, M., and Shraiman, B.I. (1997) “Assembly of Ordered Colloidal Aggregates by Electric-
Field-Induced Fluid Flow,” Nature, 386, p. 57.
Yeo, L.Y., Lastochkin, D., Wang, S C., and Chang, H C. (2004) “A New AC Electrospray Mechanism by
Maxwell-Wagner Polarization and Capillary Resonance,” Phys. Rev. Lett., 92, p. 133902.
Zeng, S., Chen, C H., Mikkelsen, J.C., and Santiago, J.G. (2001) “Fabrication and Characterization of
Electroosmotic Micropumps,” Sensors Acturators B, 79, p. 107.
Zimmermann, U., and Neil, G.A. (1996) Electromanipulation of Cells, CRC Press, Boca Raton.
Nonlinear Electrokinetic Devices 9-19
© 2006 by Taylor & Francis Group, LLC
10
Microdroplet
Generators
10.1 Introduction 10-1
10.2 Operation Principles of Microdroplet Generators 10-2
Pneumatic Actuation • Piezoelectric Actuation • Thermal-
Bubble Actuation • Thermal-Buckling Actuation • Acoustic-
Wave Actuation • Electrostatic Actuation • Inertial Actuation
10.3 Physical and Design Issues 10-7
Frequency Response • Thermal/Hydraulic Cross Talk and
Overfill • Satellite Droplets • Puddle Formation • Material Issues
10.4 Fabrication of Micro-Droplet Generators 10-16
Multiple Pieces • Monolithic Fabrication
10.5 Characterization of Droplet Generation 10-19
Droplet Trajectory • Ejection Direction • Ejection Sequence/
Velocity and Droplet Volume • Flow Field Visualization
10.6 Applications 10-22
Ink-jet Printing • Biomedical and Chemical Sample Handling
• Fuel Injection and Mixing Control • Direct Writing and
Packaging • Optical Component Fabrication and Integration
• Solid Free Forming • Manufacturing Process • IC Cooling
10.7 Concluding Remarks 10-29
10.1 Introduction
Microdroplet generators are becoming an important research area in MEMS (microelectromechanical-
systems), not only because of their historically valuable marketing device, the ink-jet printhead, but also
because of many other emerging applications in precise- or micro-amount fluidic control. The history of
microdroplet generators began with the idea’s inception by Sweet (1964, 1971) using piezo actuation. In the
late 1970s HP and the Cannon Corporation [Nielsen et al., 1985] began using thermal bubble actuation.
Since then, numerous research activities regarding ink-jet applications have been conducted. Recently, with
the emerging applications in biomedicine, fuel injection, chemistry, pharmaceuticals, electronic fabrica-
tion, microoptical devices, IC cooling, and solid free form, much research has focused on microdroplet gen-
erators. Thus, many new operation principles, designs, fabrication processes, and materials related to
microdroplet generation were explored and developed during the last decade.
In this chapter, microdroplet generators are defined as devices that generate microsized droplets in a con-
trollable manner; that is, droplet size and number can be controlled and counted accurately. Thus, atomizers,
traditional fuel injectors, or similar droplet generation devices that do not meet those criteria are not discussed.
10-1
Fan-Gang Tseng
National Tsing Hua University
© 2006 by Taylor & Francis Group, LLC
Microdroplet generators usually employ mechanical actuation to generate high pressure that overcomes
liquid surface tension and viscous force and permits droplet ejection. Depending on the droplet size, the
applied pressure is usually higher than several atmospheres. The operation principles, structure/process
designs, and materials often play key roles in the performance of droplet generators.
In addition to the well-known ink-jet printing, applications for microdroplet generators cover a wide
spectrum in various fields such as direct writing, fuel injection, solid free form, solar cell fabrication, LEPD
fabrication, packaging, microoptical components, particle sorting, microdosage, plasma spraying, drug
screening/delivery/dosage, micropropulsion, integrated circuit cooling, and chemical deposition. Many of
these applications may become key technologies for integrated microsystems in the near future.
This chapter provides an overview of the operation principles, physical properties, design issues, fabrica-
tion processes and issues, characterization methods, and applications of microdroplet generators.
10.2 Operation Principles of Microdroplet Generators
There have been many attempts to generate controllable micro droplets [Myers et al., 1984; Buehner et al.,
1977; Twardeck et al., 1977; Carmichael et al., 1977; Ashley et al., 1977; Bugdayci et al., 1983; Darling et al.,
1984; Lee et al., 1984; Nielsen et al., 1985; Bhaskar et al., 1985; Allen et al., 1985; Krause et al., 1995; Chen
et al., 1995; Tseng et al., 1996; Hirata et al., 1996; Zhu et al., 1996]. Most of these have followed the princi-
ple of creating pressure differences by either lowering the outer pressure of a nozzle or increasing the inner
pressure to push or pull liquid out of the nozzle to form droplets. Typical techniques are pneumatic, piezo-
electric, thermal bubble, thermal buckling, focused acoustic wave, and electrostatic actuations. The basic
principles of those droplet generators are introduced in the following sections. Also included in the last
section is an acceleration-based ejection method that employs inertial force for droplet generation.
10.2.1 Pneumatic Actuation
Spray nozzles are presently one of the most commonly used devices for generating droplets, as in airbrushes
or sprayers. Two types of spray nozzles are shown in Figure 10.1. Figure 10.1a shows an airbrush that lowers
10-2 MEMS: Applications
Air brush
Air flow
Air flow
Droplet
Sprayer
Spraying cycle
Droplets
Air inlet
Liquid inlet
Air flow
Refilling cycle
(b)(a)
Liquid
FIGURE 10.1 Operation principle of (a) airbrush and (b) sprayer, after Tseng (1998d).
© 2006 by Taylor & Francis Group, LLC
pressure at the outer area of the capillary tube by blowing air across the tube’s end; this forces the liquid
to move out of the tube and form droplets. The second device, a sprayer shown in Figure 10.1b,employs
high pressure to push liquid through a small nozzle to form droplets. Typical sizes of the droplets generated
by spray nozzles range from around tens to hundreds of µm in diameter. These devices can be fabricated
in micro sizes by micromachining technology. However, controlling individual nozzles in an array format
is difficult.
10.2.2 Piezoelectric Actuation
Droplet ejection by piezoelectric actuation was invented by Sweet in 1964. Two types of droplet ejection
devices are based on piezoelectric technology. One is the continuous ink-jet [Buehner et al., 1977;
Twardeck et al., 1977; Carmichael et al., 1977; Ashley et al., 1977]. Figure 10.2a schematically shows the
operational principle of this type of ink-jet. Conductive ink is forced out of the nozzles by pressure. The
jet would break up continuously into droplets with random sizes and spacing, but uniform size and spac-
ing of the droplets is controlled by applying an ultrasonic wave at a fixed frequency to the ink through a
piezoelectric transducer. The continuously generated droplets pass through a charge plate, and only the
desired droplets are charged by the electric field and deflected to print out, while the undesired droplets
are collected by a gutter and recycled. One piezoelectric transducer can support multiple nozzles, so the
Microdroplet Generators 10-3
Pump
Piezo
actuator
Charge
electrode
Deflection
electrode
Undeflected
droplets
Deflected
droplets
Droplet
collector
surface
Nozzle
Ink
Droplets
Piezo
actuator
Membrane
Nozzle
Ink
Ink supply
(a)
(b)
FIGURE 10.2 (a) Operation principle of a piezoelectric-actuated continuous droplet generator, after Buehner
(1977). (b) Operation principle of a piezoelectric-actuated droplet-on-demand droplet generator, after Lee (1984).
© 2006 by Taylor & Francis Group, LLC
nozzle spacing can be as small as desired for high-resolution arrays. The complexity of this device’s
droplet charging and collecting system is the major obstacle to its practical application.
The other device, the droplet-on-demand ink-jet, utilizes a piezoelectric tube or disc for droplet ejec-
tion only when printing a spot is desired [Bugdayci et al., 1983; Darling et al., 1984; Lee et al., 1984].
Figure 10.2(b) shows a typical drop-on-demand drop generator. The operational principle is based on the
generation of an acoustic wave in a fluid-filled chamber by a piezoelectric transducer through the appli-
cation of a voltage pulse. The acoustic wave interacts with the free meniscus surface at the nozzle to eject
a single drop. The major advantage of the drop-on-demand method is that it does not require a complex
system for droplet deflection. Its main drawback is that the size of piezoelectric transducer tube or disc,
in the order of sub mm to several mm, is too large for high-resolution applications. It was reported that
the typical frequency for a stable operation of piezoelectric ink-jet would be tens of kHz [Chen et al., 1999].
10.2.3 Thermal-Bubble Actuation
Thermal bubble jet technology has been studied by HP in the United States and by CANON in Japan
since the early 1980s [Nielsen et al., 1985; Bhaskar et al., 1985; Allen et al., 1985]. Many other designs also
are reported in the literature [for example, Krause et al., 1995; Chen et al., 1995; Tseng et al., 1996, 1998].
Figure 10.3 shows the cross-section of a thermal bubble jet device. Liquid in the chamber is heated by
applying a pulse current to the heater under the chamber. The temperature of the liquid covering the sur-
face of the heater rises to around the liquid critical point in microseconds, and then a bubble grows on
the surface of the heater, which serves as a pump. The bubble pump pushes liquid out of the nozzle to
form a droplet. After the droplet is ejected, the heating pulse is turned off and the bubble starts to col-
lapse. Liquid refills the chamber when surface tension on the free surface of the meniscus returns it to the
original position. A second pulse generates another droplet. The energy consumption for ejecting each
10-4 MEMS: Applications
Substrate
Heater
Vapor
bubble
Nozzle plate
Spacer
Liquid
Main droplet
Satellite droplet
Droplet column
FIGURE 10.3 Operation principle of a thermal-bubble-actuated droplet generator, after Allen (1985).
© 2006 by Taylor & Francis Group, LLC
Microdroplet Generators 10-5
Substrate
Cooling hole
Nozzle plate
Spacer
Nozzle
Ink supply
Membrane
Electrode
Heater
Liquid
Droplet
FIGURE 10.4 Operation principle of a thermal-buckling-actuated droplet generator, after Hirata (1996).
droplet is around 0.04mJ for an HP ThinkJet printhead. Because bubbles can deform freely, the chamber
size of the thermal bubble jet is smaller than that of other actuation means, which is important for high-
resolution applications. The resolution reported in the literature ranges from 150 to 600 dpi [Krause et al.,
1995] and 1016 dpi [Chen et al., 1995]. The typical operational frequency for contemporary thermal bubble
jets is around several to tens of kHz.
10.2.4 Thermal-Buckling Actuation
Hirata et al. (1996) employed a buckling diaphragm for droplet generation. Figure 10.4 schematically shows
the technique’s basic operational principle. Acomposite circular membrane consisting of a silicon diox-
ide and nickel layer is fixed on the border and remains separated from the substrate by a small gap. A heater
is placed at the center of the composite membrane and electrically isolated from it. Pulsed current is sent to
the heater, and then the membrane is heated for several µs.When the thermally induced stress is greater than
the critical stress, the diaphragm buckles abruptly and ejects a droplet out of the nozzle. The power required
to generate a droplet at a speed of 10m/s is around 0.1 mJ using a 300µm diameter diaphragm. The power
consumption and the size of the buckling membrane ink-jet device are much larger than those of the ther-
mal bubble jet. The reported frequency response of a membrane buckling jet ranges from 1.8 to 5 kHz
depending on the desired droplet velocity.
10.2.5 Acoustic-Wave Actuation
Figure 10.5 shows a lensless liquid ejector using constructive interference from acoustic waves to generate
droplets [Zhu et al., 1996]. A PZT thin-film actuator with the help of an on-chip Fresnel lens was employed
to generate and focus acoustic waves on the air–liquid interface for droplet formation. The actuation results
from the excitation of a piezoelectric film under a burst of RF signal. The device does not need a nozzle
to define droplets, reducing the clogging problems that trouble most droplet generators employing noz-
zles. Droplet size also can be controlled by using acoustic waves with specific frequencies. However, due
to the acoustic waves’ vigorous agitation of the liquid, it is difficult to maintain a quiet interface for reliable
and repeatable droplet generation. As a result, a “nozzle area” is still needed to maintain a stable interface.
© 2006 by Taylor & Francis Group, LLC
The applied RF frequency ranges from 100 to 400 MHz, and the burst period is 100µs. The power con-
sumption for one droplet is around 1 mJ, which is high compared to other techniques. The droplet size
ranges from 20 to 100 µm depending on the RF frequency. The reported size of the device is 1 ϫ 1mm
2
,
which is much larger than the droplet generators mentioned previously.
10.2.6 Electrostatic Actuation
The electrostatically driven ink-jet printhead was first introduced by the Seiko Epson Corporation [Kamisuki
et al.,1998,2000] for commercial printing.As shown in Figure 10.6,the actuation is initiated by applying aDC
voltage between an electrode plate and a pressure plate; this deflects the pressure plate for ink filling.
When the voltage stops, the pressure plate reflects back and pushes the droplet out of the nozzle. This device
has been developed for use in electric calculators due to its low power consumption, less than 0.525 mW/
nozzle. The driving voltage for a SEAJet is 26.5 V, and the driving frequency can be up to 18 kHz with uni-
form ink ejection. A 128-nozzle chip with 360 dpi pitch resolution also has been demonstrated. This device
was claimed to offer high printing quality (for bar code), high speed printing, low power consumption, and
long lifetime (more than 4 billion ejections) under heavy-duty usage as well as low acoustic noise. However,
the fabrication comprises a complex bonding process among three different micromachined pieces. Further,
making the pressure plate requires a very precise etching process to control the accuracy and uniformity of its
thickness. Due to the deformation limitation of solid materials and alignment accuracy in the bonding
process, the nozzle pitch may not be easily reduced any further for higher resolution applications.
10.2.7 Inertial Actuation
Inertial droplet actuators apply a high acceleration to the nozzle chip to cause droplet ejection. This type of
apparatus is shown in Figure 10.7. The print module consists of large reservoirs on the top plate, which is
connected to nozzles on the bottom plate. The print module is mounted on a long cantilever beam with
a piezo-bimorph-actuator for acceleration generation. Generating 1nl droplets from 100µm diameter noz-
zles requires 500 µs. Twenty-four liquid droplets of different solution types were demonstrated to be
ejected simultaneously from the nozzles in a 500 µm pitch. The smallest droplet claimed to be generated is
10-6 MEMS: Applications
Liquid
Substrate
Membrane
PZT actuator
Fresnel lens
Droplet
FIGURE 10.5 Operation principle of an acoustic-wave-actuated droplet generator, after Zhu (1996).
© 2006 by Taylor & Francis Group, LLC
100 pl from 50 µm diameter nozzles. This principle provides a gentle ejection process for bioreagent appli-
cations. However, the ejection of smaller droplets may encounter strong surface tension and flow-drag
forces in micro scale that are much larger than the droplet inertial. That the droplets cannot be selectively
and individually ejected from the desired nozzles also limits this technique’s applications.
10.3 Physical and Design Issues
Droplet generation involves wide varieties of physical issues and design concerns including micro fluid flow,
heat transfer, wave propagation, surface properties, material properties, and structure strength. The follow-
ing sections discuss frequency response, thermal cross talk, hydraulic cross talk, overfill, satellite droplets,
puddle formation, and material issues commonly seen in microdroplet generators.
10.3.1 Frequency Response
The frequency response of droplet generators is one of the important measures of their performance. The
reported typical frequency response for thermal bubble jets, piezo jets, thermal buckling jets, acoustic wave
jets, electrostatic, and inertial jets ranges from kHz to tens of kHz. Piezo and acoustic wave jets typically have
higher frequency response than the others. Recently, a novel designbyTseng et al. (1998) improved the
frequency response of thermal bubble jets by about three times (35 kHz),which is compatible with the speed
of piezo jets. Higher speed devices (in the range of hundreds of kHz) are currently under development
by major ink-jet printer makers and will see further breakthroughs in the next few years.
Three important time constants that affect the frequency response of microdroplet generators are
actuation, droplet ejection, and liquid refilling, as shown in Figure 10.8.
The typical time constant from heating to bubble formation in a thermal bubble jet is around 2–10 µs
for chamber sizes ranging from 20 to 100 µm [Tseng et al., 1998d]. Thermal buckling and electrostatic type
microdroplet generators have actuation times of around tens to hundreds of µs [estimated from Hirata
Microdroplet Generators 10-7
Pressure
p
late
Membrane
Liquid
Upper
electrode
Bottom
electrode
Nozzle
Orifice
Reservoir
Droplet
Top glass substrate
Bottom glass substrate
FIGURE 10.6 Operation principle of an electrostatic-actuated droplet generator, after Kamisuki (1998).
Piezo bimorph
actuator
Print module
Droplets
Reservoir
Nozzle
FIGURE 10.7 Operation principle of an inertia-actuated droplet generator, after Gruhler (1999).
© 2006 by Taylor & Francis Group, LLC
et al., 1996], owing to the large actuation plate required for sufficient displacement to form droplets.
Inertial type generators required even longer actuation times [estimated from Gruhler et al., 1999], typically
hundreds to thousands of µs, due to the large cantilever structure for generating large droplets with sufficient
inertial force to overcome liquid surface tension and viscosity. The actuation time for piezo or acoustic wave
type may be shorter [Darling et al., 1984; Zhu et al., 1996], around µsto tens of µs.
After the application of actuation pressure to the liquid, the droplet starts to eject. The ejection sequence
usually takes from a couple to hundreds of µs for droplet volumes from 1 pl to 1 nl [Tseng et al., 1998d],
which does not vary much among the different operational principles.
The liquid refills automatically due to surface tension force after the droplet ejects. Liquid refilling time
can vary by 3 orders of magnitude (e.g., from less than 10 µstoover 1 s), depending on the length and
geometry of the refilling path. In most the commercial ink-jet printhead designs, achamber neck
[Nielsen et al., 1985], an elongated chamber channel [Neilsen et al., 1985], or a physical valve [Karz et al.,
1994] is used to prevent hydraulic cross talk and maintain a high pressure in the firing chamber. However,
if not arranged properly, those designs may greatly increase the refilling time causing a reduction in the
frequency response. As a result, preventing hydraulic cross talk without sacrificing device speed becomes
an important issue in the design of super-high-speed and high-resolution droplet generators. Tseng et al.
(1998a, 1998b, and 1998c) introduced the concept of avirtual chamber neck to speed the refilling
process of thermal bubble jets and suppress cross talk. The virtual neck consists of vapor bubbles, forms
for pressurization while the droplet is ejecting, and opens to reduce flow resistance while the liquid is
refilling, thus increasing the frequency response. This concept is shown in Figure 10.9.
In simulating the droplet actuation and formation sequence, much work [Curry et al., 1977; Lee et al.,
1977; Levanoni et al., 1977; Pimbley et al., 1977; Fromm et al., 1984; Bogy et al., 1984; Asai et al., 1987–92;
Mirfakhraee et al., 1989; Chen et al., 1997–99; Rembe et al., 2000] has been conducted on bubble forma-
tion, droplet generation, and the aerodynamics of droplets traveling in the atmosphere both for thermal-
bubble- and piezo-type jets. Interested readers can refer to those works for details.
Typical bubble formation, growth, and collapse sequences in a thermal bubble jet are shown in
Figure 10.10 (Yang et al., 2004); three different heaters with length-width ratios of 1, 2, and 3 respectively
10-8 MEMS: Applications
Actuation
Droplet ejection
Droplet formation
Liquid refills
Satellite droplets
(a)
(b)
(c)
(d)
FIGURE 10.8 The sequence of droplet generation.
© 2006 by Taylor & Francis Group, LLC