Where.Am.I-Sensors.and.methods.for.mobile.robot.positioning.-.Borenstein(2001) Part 11 pps
Bạn đang xem bản rút gọn của tài liệu. Xem và tải ngay bản đầy đủ của tài liệu tại đây (598.02 KB, 20 trang )
Segment 0
Segment 2
x
y
Robot
crowley3.ds4, .wmf
Chapter 8: Map-Based Positioning 201
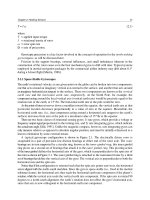
Figure 8.17: Experimental setup for
testing Crowley's map-matching method.
Initially, the robot is intentionally set-off
from the correct starting position.
Figure 8.16:
a. A vehicle with a position uncertainty of 40 cm (15.7 in), as shown by the
circle around the centerpoint (cross), is detecting a line segment.
b. The boundaries for the line segment grow after adding the uncertainty for
the robot's position.
c. After correction by matching the segment boundaries with a stored map
segment, the uncertainty of the robot's position is reduced to about 8 cm
(3.15 in) as shown by the squat ellipse around the robot's center (cross).
Courtesy of [Crowley, 1989].
two tables. The robot system has no a priori knowledge
of its environment. The location and orientation at which
the system was started were taken as the origin and x-axis
of the world coordinate system. After the robot has run
three cycles of ultrasonic acquisition, both the estimated
position and orientation of the vehicle were set to false
values. Instead of the correct position (x = 0, y = 0, and
2 = 0), the position was set to x = 0.10 m, y = 0.10 m and
the orientation was set to 5 degrees. The uncertainty was
set to a standard deviation of 0.2 meters in x and y, with
a uncertainty in orientation of 10 degrees. The system
was then allowed to detect the “wall” segments around it.
The resulting estimated position and covariance is listed
in Table 8.4].
Table 8.3: Experimental results with Crowley's map-matching method. Although initially placed in an incorrect
position, the robot corrects its position error with every additional wall segment scanned.
Initial estimated position (with deliberate initial error) x,y,2 = (0.100, 0.100, 5.0)
Covariance 0.040 0.000 0.000
0.000 0.040 0.000
0.000 0.000 100.0
After match with segment 0
estimated position: x,y,2 = (0.102, 0.019, 1.3)
Covariance 0.039 0.000 0.000
0.000 0.010 0.000
0.000 0.000 26.28
After match with segment 1 estimated position: x,y,2 = (0.033, 0.017, 0.20)
Covariance 0.010 0.000 0.000
0.000 0.010 0.000
0.000 0.000 17.10
202 Part II Systems and Methods for Mobile Robot Positioning
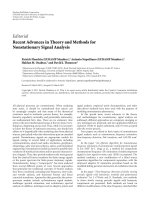
Figure 8.18: a. Regions of constant depth (RCD's) extracted from 15 sonar range scans.
b. True (x), odometric (+), and estimated (*) positions of the mobile robot using
two planar (wall) “beacons” for localization. (Courtesy of Adams and von Flüe.)
8.3.1.3 Adams and von Flüe
The work by Adams and von Flüe follows the work by Leonard and Durrant-Whyte [1990] in
using an approach to mobile robot navigation that unifies the problems of obstacle detection, position
estimation, and map building in a common multi-target tracking framework. In this approach a mobile
robot continuously tracks naturally occurring indoor targets that are subsequently treated as
“beacons.” Predicted targets (i.e., those found from the known environmental map) are tracked in
order to update the position of the vehicle. Newly observed targets (i.e., those that were not
predicted) are caused by unknown environmental features or obstacles from which new tracks are
initiated, classified, and eventually integrated into the map.
Adams and von Flüe implemented the above technique using real sonar data. The authors note
that a good sensor model is crucial for this work. For this reason, and in order to predict the expected
observations from the sonar data, they use the sonar model presented by Kuc and Siegel [1987].
Figure 8.18a shows regions of constant depth (RCDs) [Kuc and Siegel, 1987] that were extracted
from 15 sonar scans recorded from each of the locations marked “×.”
The model from Kuc and Siegel's work suggests that RCDs such as those recorded at the
positions marked A in Figure 8.18a correspond to planar surfaces; RCDs marked B rotate about a
point corresponding to a 90 degree corner and RCDs such as C, which cannot be matched,
correspond to multiple reflections of the ultrasonic wave.
Figure 8.18b shows the same mobile robot run as Figure 8.18a, but here the robot computes its
position from two sensed “beacons,” namely the wall at D and the wall at E in the right-hand scan in
Figure 8.18b. It can be seen that the algorithm is capable of producing accurate positional estimates
Chapter 8: Map-Based Positioning 203
of the robot, while simultaneously building a map of its sensed environment as the robot becomes
more confident of the nature of the features.
8.3.2 Topological Maps for Navigation
Topological maps are based on recording the geometric relationships between the observed features
rather than their absolute position with respect to an arbitrary coordinate frame of reference.
Kortenkamp and Weymouth [1994] defined the two basic functions of a topological map:
a. Place Recognition With this function, the current location of the robot in the environment is
determined. In general, a description of the place, or node in the map, is stored with the place.
This description can be abstract or it can be a local sensory map. At each node, matching takes
place between the sensed data and the node description.
b. Route Selection With this function, a path from the current location to the goal location is
found.
The following are brief descriptions of specific research efforts related to topological maps.
8.3.2.1 Taylor [1991]
Taylor, working with stereo vision, observed that each local stereo map may provide good estimates
for the relationships between the observed features. However, because of errors in the estimates for
the robot's position, local stereo maps don't necessarily provide good estimates for the coordinates
of these features with respect to the base frame of reference. The recognition problem in a topological
map can be reformulated as a graph-matching problem where the objective is to find a set of features
in the relational map such that the relationships between these features match the relationships
between the features on the object being sought. Reconstructing Cartesian maps from relational maps
involves minimizing a non-linear objective function with multiple local minima.
8.3.2.2 Courtney and Jain [1994]
A typical example of a topological map-based approach is given by Courtney and Jain [1994]. In this
work the coarse position of the robot is determined by classifying the map description. Such
classification allows the recognition of the workspace region that a given map represents. Using data
collected from 10 different rooms and 10 different doorways in a building (see Fig. 8.19), Courtney
and Jain estimated a 94 percent recognition rate of the rooms and a 98 percent recognition rate of the
doorways. Courtney and Jain concluded that coarse position estimation, or place recognition, in
indoor domains is possible through classification of grid-based maps. They developed a paradigm
wherein pattern classification techniques are applied to the task of mobile robot localization. With this
paradigm the robot's workspace is represented as a set of grid-based maps interconnected via
topological relations. This representation scheme was chosen over a single global map in order to
avoid inaccuracies due to cumulative dead-reckoning error. Each region is represented by a set of
multi-sensory grid maps, and feature-level sensor fusion is accomplished through extracting spatial
descriptions from these maps. In the navigation phase, the robot localizes itself by comparing features
extracted from its map of the current locale with representative features of known locales in the
312
323
325
327
330
335
350
352
354
360
Hallway Hallway
\book\courtney.ds4, .wmf, 11/13/94
A
B
C
D
E
F
G
204 Part II Systems and Methods for Mobile Robot Positioning
Figure 8.19: Based on datasets collected from 10 different rooms
and 10 different doorways in a building, Courtney and Jain
estimate a 94 percent recognition rate of the rooms and a 98
percent recognition rate of the doorways. (Adapted from
[Courtney and Jain, 1994].)
Figure 8.20: An experiment to determine if the robot can detect
the same place upon return at a later time. In this case, multiple
paths through the place can be "linked” together to form a
network. (Adapted from [Kortenkamp and Weymouth, 1994].)
environment. The goal is to recognize the current locale and thus determine the workspace region
in which the robot is present.
8.3.2.3 Kortenkamp and
Weymouth [1993]
Kortenkamp and Weymouth imple-
mented a cognitive map that is
based on a topological map. In their
topological map, instead of looking
for places that are locally distin-
guishable from other places and
then storing the distinguishing fea-
tures of the place in the route map,
their algorithm looks for places that
mark the transition between one
space in the environment and an-
other space (gateways). In this al-
gorithm sonar and vision sensing is
combined to perform place recogni-
tion for better accuracy in recognition, greater resilience to sensor errors, and the ability to resolve
ambiguous places. Experimental results show excellent recognition rate in a well-structured
environment. In a test of seven gateways, using either sonar or vision only, the system correctly
recognized only four out of seven places. However, when sonar and vision were combined, all seven
places were correctly recognized.
Figure 8.20 shows the experimental
space for place recognition. Key
locations are marked in capital let-
ters. Table 8.5a and Table 8.5b
show the probability for each place
using only vision and sonar, respec-
tively. Table 8.5c shows the com-
bined probabilities (vision and so-
nar) for each place. In spite of the
good results evident from Table
8.5c, Kortenkamp and Weymouth
pointed out several drawbacks of
their system:
The robot requires several ini-
tial, guided traversals of a route in
order to acquire a stable set of loca-
tion cues so that it can navigate
autonomously.
Chapter 8: Map-Based Positioning 205
C Acquiring, storing, and matching visual scenes is very expensive, both in computation time and
storage space.
C The algorithm is restricted to highly structured, orthogonal environments.
Table 8.5a: Probabilities for each place using only vision.
Stored Places
A B C D E F G
A 0.43 0.09 0.22 0.05 0.05 0.1 0.06
B 0.05 0.52 0.21 0.06 0.05 0.05 0.05
C 0.10 0.12 0.36 0.2 0.04 0.13 0.04
D 0.14 0.05 0.24 0.43 0.05 0.04 0.05
E 0.14 0.14 0.14 0.14 0.14 0.14 0.14
F 0.14 0.14 0.14 0.16 0.14 0.14 0.14
G 0.14 0.14 0.14 0.14 0.14 0.14 0.14
Table 8.5b: Probabilities for each place using only sonar.
Stored Places
A B C D E F G
A 0.82 0.04 0.04 0.04 0.04 0 0
B 0.02 0.31 0.31 0.31 0.06 0 0
C 0.02 0.31 0.31 0.31 0.06 0 0
D 0.02 0.31 0.31 0.31 0.61 0 0
E 0.04 0.12 0.12 0.12 0.61 0 0
F 0 0 0 0 0 0.90 0.10
G 0 0 0 0 0 0.10 0.90
Table 8.5c: Combined probabilities (vision and sonar) for each place.
Stored Places
A B C D E F G
A 0.95 0.01 0.02 0.01 0.01 0 0
B 0 0.65 0.26 0.07 0.01 0 0
C 0 0.17 0.52 0.29 0.01 0 0
D 0.01 0.07 0.33 0.58 0.01 0 0
E 0.04 0.12 0.12 0.12 0.61 0 0
F 0 0 0 0 0 0.90 0.1
G 0 0 0 0 0 0.09 0.91
206 Part II Systems and Methods for Mobile Robot Positioning
8.4 Summary
Map-based positioning is still in the research stage. Currently, this technique is limited to laboratory
settings and good results have been obtained only in well-structured environments. It is difficult to
judge how the performance of a laboratory robot scales up to a real world application. Kortenkamp
and Weymouth [1994] noted that very few systems tested on real robots are tested under realistic
conditions with more than a handful of places.
We summarize relevant characteristics of map-based navigation systems as follows:
Map-based navigation systems:
C are still in the research stage and are limited to laboratory settings,
C have not been tested extensively in real-world environments,
C require a significant amount of processing and sensing capability,
C need extensive processing, depending on the algorithms and resolution used,
C require initial position estimates from odometry in order to limit the initial search for features to
a smaller area.
There are several critical issues that need to be developed further:
C Sensor selection and sensor fusion for specific applications and environments.
C Accurate and reliable algorithms for matching local maps to the stored map.
C Good error models of sensors and robot motion.
C Good algorithms for integrating local maps into a global map.
Chapter 9: Vision-Based Positioning 207
CHAPTER 9
VISION-BASED POSITIONING
A core problem in robotics is the determination of the position and orientation (often referred to as
the pose) of a mobile robot in its environment. The basic principles of landmark-based and map-based
positioning also apply to the vision-based positioning or localization which relies on optical sensors
in contrast to ultrasound, dead-reckoning and inertial sensors. Common optical sensors include
laser-based range finders and photometric cameras using CCD arrays.
Visual sensing provides a tremendous amount of information about a robot's environment, and
it is potentially the most powerful source of information among all the sensors used on robots to date.
Due to the wealth of information, however, extraction of visual features for positioning is not an easy
task.The problem of localization by vision has received considerable attention and many techniques
have been suggested. The basic components of the localization process are:
C representations of the environment,
C sensing models, and
C localization algorithms.
Most localization techniques provide absolute or relative position and/or the orientation of
sensors. Techniques vary substantially, depending on the sensors, their geometric models, and the
representation of the environment.
The geometric information about the environment can be given in the form of landmarks, object
models and maps in two or three dimensions. A vision sensor or multiple vision sensors should
capture image features or regions that match the landmarks or maps. On the other hand, landmarks,
object models, and maps should provide necessary spatial information that is easy to be sensed. When
landmarks or maps of an environment are not available, landmark selection and map building should
be part of a localization method.
In this chapter, we review vision-based positioning methods which have not been explained in the
previous chapters. In a wider sense, “positioning” means finding position and orientation of a sensor
or a robot. Since the general framework of landmark-based and map-based positioning, as well as the
methods using ultrasound and laser range sensors have been discussed, this chapter focuses on the
approaches that use photometric vision sensors, i.e., cameras. We will begin with a brief introduction
of a vision sensor model and describe the methods that use landmarks, object models and maps, and
the methods for map building.
9.1 Camera Model and Localization
Geometric models of photometric cameras are of critical importance for finding geometric position
and orientation of the sensors. The most common model for photometric cameras is the pin-hole
camera with perspective projection as shown in Fig. 9.1. Photometric cameras using optical lens can
be modeled as a pin-hole camera. The coordinate system (X, Y, Z) is a three-dimensional camera
coordinate system, and (x, y) is a sensor (image) coordinate system. A three-dimensional feature in
x ' f
X
Z
, y ' f
Y
Z
X
Y
Z
f
X
w
Y
w
Z
w
R
:
R
o
t
a
t
i
o
n
T: Translation
(X, Y, Z)
Feature in 3-D
O
sang01.cdr, .wmf
208 Part II Systems and Methods for Mobile Robot Positioning
(9.1)
Figure 9.1: Perspective camera model.
an object is projected onto the image plane (x, y). The relationship for this perspective projection is
given by
Although the range information is collapsed in this projection, the angle or orientation of the
object point can be obtained if the focal length f is known and there is no distortion of rays due to lens
distortion. The internal parameters of the camera are called intrinsic camera parameters and they
include the effective focal length f, the radial lens distortion factor, and the image scanning
parameters, which are used for estimating the physical size of the image plane. The orientation and
position of the camera coordinate system (X, Y, Z) can be described by six parameters, three for
orientation and three for position, and they are called extrinsic camera parameters. They represent
the relationship between the camera coordinates (X, Y, Z) and the world or object coordinates (X ,
W
Y , Z ). Landmarks and maps are usually represented in the world coordinate system.
W W
The problem of localization is to determine the position and orientation of a sensor (or a mobile
robot) by matching the sensed visual features in one or more image(s) to the object features provided
by landmarks or maps. Obviously a single feature would not provide enough information for position
and orientation, so multiple features are required. Depending on the sensors, the sensing schemes,
and the representations of the environment, localization techniques vary significantly.
a
.
b
.
Camera center
1
p
p
2
p
3
1
r
r
2
r
3
Edge locations
1
r
r
2
r
3
sang02.cdr, .wmf
Chapter 9: Vision-Based Positioning 209
Figure 9.2: Localization using landmark features.
9.2 Landmark-Based Positioning
The representation of the environment can be given in the form of very simple features such as points
and lines, more complex patterns, or three-dimensional models of objects and environment. In this
section, the approaches based on simple landmark features are discussed.
9.2.1 Two-Dimensional Positioning Using a Single Camera
If a camera is mounted on a mobile robot with its optical axis parallel to the floor and vertical edges
of an environment provide landmarks, then the positioning problem becomes two-dimensional. In this
case, the vertical edges provide point features and two-dimensional positioning requires identification
of three unique features. If the features are uniquely identifiable and their positions are known, then
the position and orientation of the pin-hole camera can be uniquely determined as illustrated in
Fig. 9.2a. However, it is not always possible to uniquely identify simple features such as points and
lines in an image. Vertical lines are not usually identifiable unless a strong constraint is imposed. This
is illustrated in Fig. 9.2b.
Sugihara [1988] considered two cases of point location problems. In one case the vertical edges
are distinguishable from each other, but the exact directions in which the edges are seen are not given.
In this case, the order in which the edges appear is given. If there are only two landmark points, the
measurement of angles between the corresponding rays restricts the possible camera position to part
of a circle as shown in Fig. 9.3a. Three landmark points uniquely determine the camera position which
is one of the intersections of the two circles determined by the three mark points as depicted in
Fig. 9.3b. The point location algorithm first establishes a correspondence between the three landmark
points in the environment and three observed features in an image. Then, the algorithm measures the
angles between the rays. To measure the correct angles, the camera should be calibrated for its
intrinsic parameters. If there are more than three pairs of rays and landmarks, only the first three pairs
are used for localization, while the remaining pairs of rays and landmarks can be used for verification.
p
1
p1
p
1
p
2
p2
p
2
p
3
θ + δθ
θ − δθ
θ
camera camera camera
sang03.cdr, .wmf
210 Part II Systems and Methods for Mobile Robot Positioning
Figure 9.3:
a. Possible camera locations (circular arc) determined by two rays and corresponding mark
points.
b. Unique camera position determined by three rays and corresponding mark points.
c. Possible camera locations (shaded region) determined by two noisy rays and
corresponding mark points.
(Adapted from [Sugihara 1988; Krotkov 1989]).
In the second case, in which k vertical edges are indistinguishable from each other, the location
algorithm finds all the solutions by investigating all the possibilities of correspondences. The algorithm
first chooses any four rays, say r , r , r , and r . For any ordered quadruplet (p , p, p, p ) out of n
1 2 3 4 i j l m
mark points p , ,p , it solves for the position based on the assumption that r , r , r , and r
1 n 1 2 3 4
correspond to p, p, p, and p , respectively. For n(n-1)(n-2)(n-3) different quadruples, the algorithm
i j l m
can solve for the position in O(n ) time. Sugihara also proposed an algorithm that runs in O(n log
4 3
n) time with O(n) space or in O(n ) time with O(n ) space. In the second part of the paper, he
3 2
considers the case where the marks are distinguishable but the directions of rays are inaccurate. In
this case, an estimated position falls in a region instead of a point.
Krotkov [1989] followed the approach of Sugihara and formulated the positioning problem as
a search in a tree of interpretation (pairing of landmark directions and landmark points). He
developed an algorithm to search the tree efficiently and to determine the solution positions, taking
into account errors in the landmark direction angle. According to his analysis, if the error in angle
measurement is at most *2, then the possible camera location lies not on an arc of a circle, but in the
shaded region shown in Fig. 3c. This region is bounded by two circular arcs.
Krotkov presented simulation results and analyses for the worst-case errors and probabilistic
errors in ray angle measurements. The conclusions from the simulation results are:
C the number of solution positions computed by his algorithm depends significantly on the number
of angular observations and the observation uncertainty *2.
C The distribution of solution errors is approximately a Gaussian whose variance is a function of
*2 for all the angular observation errors he used: a. uniform, b. normal, and c. the worst-case
distribution.
Betke and Gurvits [1994] proposed an algorithm for robot positioning based on ray angle
measurements using a single camera. Chenavier and Crowley [1992] added an odometric sensor to
landmark-based ray measurements and used an extended Kalman filter for combining vision and
odometric information.
Chapter 9: Vision-Based Positioning 211
9.2.2 Two-Dimensional Positioning Using Stereo Cameras
Hager and Atiya [1993] developed a method that uses a stereo pair of cameras to determine
correspondence between observed landmarks and a pre-loaded map, and to estimate the two-
dimensional location of the sensor from the correspondence. Landmarks are derived from vertical
edges. By using two cameras for stereo range imaging the algorithm can determine the two-
dimensional locations of observed points — in contrast to the ray angles used by single-camera
approaches.
Hager and Atiya's algorithm performs localization by recognizing ambiguous sets of correspon-
dences between all the possible triplets of map points p , p, p and those of observed points o , o , o .
i j k a b c
It achieves this by transforming both observed data and stored map points into a representation that
is invariant to translation and rotation, and directly comparing observed and stored entities. The
permissible range of triangle parameters due to sensor distortion and noise is computed and taken into
account.
For n map points and m observed points, the off-line initialization stage consumes O(n log n)
3
time to compute and sort all triangle parameters from the map points. At run time, the worst case
complexity is O(m (n + log n)). However, an efficient strategy of marking and scanning reduces
3 3
the search space and real-time performance (half a second) is demonstrated for five observed and 40
stored landmarks.
9.3 Camera-Calibration Approaches
The camera-calibration approaches are more complex than the two-dimensional localization
algorithms discussed earlier. This is because calibration procedures compute the intrinsic and extrinsic
camera parameters from a set of multiple features provided by landmarks. Their aim is to establish
the three-dimensional position and orientation of a camera with respect to a reference coordinate
system. The intrinsic camera parameters include the effective focal length, the lens distortion
parameters, and the parameters for image sensor size. The computed extrinsic parameters provide
three-dimensional position and orientation information of a camera coordinate system relative to the
object or world coordinate system where the features are represented.
The camera calibration is a complex problem because of these difficulties:
C All the intrinsic and extrinsic parameters should be computed from the two-dimensional
projections of a limited number of feature points,
C the parameters are inter-related, and
C the formulation is non-linear due to the perspectivity of the pin-hole camera model.
The relationship between the three-dimensional camera coordinate system (see Fig. 1)
X = [X, Y, Z] (9.2)
T
and the object coordinate system
X = [X , Y , Z ] (9.3)
W W W W
T
is given by a rigid body transformation
R '
r
XX
r
XY
r
XZ
r
YX
r
YY
r
YZ
r
ZX
r
ZY
r
ZZ
, T '
t
X
t
Y
t
Z
X
Y
Z
X
w
Y
w
Z
w
R
:
R
o
t
a
t
i
o
n
T: Translation
O
Feature points
sang04.cdr, .wmf
212 Part II Systems and Methods for Mobile Robot Positioning
(9.5)
Figure 9.4: Camera calibration using multiple features and a radial alignment constraint.
X = RX + T (9.4)
W
where
are the rotation and translation matrices, respectively.
Determination of camera position and orientation from many image features has been a classic
problem of photogrammetry and has been investigated extensively [Slama 1980; Wolf 1983]. Some
photogrammetry methods (as described in [Wolf 1983]) solved for the translation and rotation
parameters by nonlinear least-squares techniques. Early work in computer vision includes that by
Fischler and Bolles [1981] and Ganapathy [1984]. Fischler and Bolles found the solution by first
computing the length of rays between the camera center (point O in Fig. 9.1) and the feature
projections on the image plane (x, y). They also established results on the number of solutions for
various number of feature points. According to their analysis, at least six points are required to get
a unique solution. Ganapathy [1984] showed similar results and presented somewhat simplified
algorithms.
More recently several newer methods were proposed for solving for camera position and
orientation parameters. The calibration technique proposed by Tsai [1986] is probably the most
complete and best known method, and many versions of implementation code are available in the
public domain. The Tsai's algorithm decomposes the solution for 12 parameters (nine for rotation and
three for translation) into multiple stages by introducing a constraint. The radial alignment constraint
s ang05.c dr, .w mf
Observed Scene Internal model Correspondence
Chapter 9: Vision-Based Positioning 213
Figure 9.5: Finding correspondence between an internal model and an observed scene.
assumes that the lens distortion occurs only in the radial direction from the optical axis Z of the
camera. Using this constraint, six parameters r , r , r , r , t , and t are computed first, and the
XX XY YX YY X Y
constraint of the rigid body transformation RR =I is used to compute r , r , r , r , and r .
T
XZ YZ ZX ZY ZZ
Among the remaining parameters, the effective focal length f and t are first computed neglecting the
Z
radial lens distortion parameter 6, and then used for estimating 6 by a nonlinear optimization
procedure. The values of f and t are also updated as a result of the optimization. Further work on
Z
camera calibration has been done by Lenz and Tsai [1988].
Liu et al. [1990] first suggested the use of straight lines and points as features for estimating
extrinsic camera parameters. Line features are usually abundant in indoor and some outdoor
environments and less sensitive to noise than point features. The constraint used for the algorithms
is that a three-dimensional line in the camera coordinate system (X, Y, Z) should lie in the plane
formed by the projected two-dimensional line in the image plane and the optical center O in Fig 9.1.
This constraint is used for computing nine rotation parameters separately from three translation
parameters. They present linear and nonlinear algorithms for solutions. According to Liu et al.'s
analysis, eight-line or six-point correspondences are required for the linear method, and three-line or
three-point correspondences are required for the nonlinear method. A separate linear method for
translation parameters requires three-line or two-point correspondences.
Haralick et al. [1989] reported their comprehensive investigation for position estimation from
two-dimensional and three-dimensional model features and two-dimensional and three-dimensional
sensed features. Other approaches based on different formulations and solutions include Kumar
[1988], Yuan [1989], and Chen [1991].
9.4 Model-Based Approaches
A priori information about an environment can be given in more comprehensive form than features
such as two-dimensional or three-dimensional models of environment structure and digital elevation
maps (DEM). The geometric models often include three-dimensional models of buildings, indoor
structure and floor maps. For localization, the two-dimensional visual observations should capture
the features of the environment that can be matched to the preloaded model with minimum
uncertainty. Figure 5 illustrates the match between models and image features. The problem is that
the two-dimensional observations and the three-dimensional world models are in different forms. This
is basically the problem of object recognition in computer vision: (1) identifying objects and (2)
estimating pose from the identified objects.
sang06.cdr, .wmf
214 Part II Systems and Methods for Mobile Robot Positioning
Figure 9.6: Finding a location on a digital elevation maps (DEM) that matches a visual
scene observed from a point. The 'x' marks a possible location in the DEM that could
generate the observed visual scene to the right.
9.4.1 Three-Dimensional Geometric Model-Based Positioning
Fennema et al. [1990] outlined a system for navigating a robot in a partially modeled environment.
The system is able to predict the results of its actions by an internal model of its environment and
models of its actions. Sensing is used to correct the model's predictions about current location or to
progress towards some goal. Motions are composed in a hierarchical planner that sketches overall
paths and details the short term path. Control of the robot is broken down into the action level, the
plan level, and the goal level. Landmarks are chosen to measure progress in the plan. The system must
receive perceptual confirmation that a step in the plan has been completed before it will move to the
next part of the plan. Later steps in a plan expand in detail as earlier steps are completed. The
environment is modeled in a graph structure of connected nodes called locales. Locales may exist at
a variety of scales in different hierarchies of the map. Other information is kept in the system
associated with each locale to provide more detail. Using these models the robot operates in a plan-
and monitor-cycle, confirming and refining plans to achieve overall goals.
The algorithm by Fennema et al. [1990] matches images to the map by first matching the two-
dimensional projection of landmarks to lines extracted from the image. The best fit minimizes the
difference between the model and the lines in the data. Once the correspondence between model and
two-dimensional image is found, the relation of the robot to the world coordinate system must be
found. This relation is expressed as the rotation and translation that will match the robot- and world-
systems. Matching is done by considering all possible sets of three landmarks. Once a close
correspondence is found between data and map, the new data is used to find a new estimate for the
actual pose.
Kak et al. [1990] used their robot's encoders to estimate its position and heading. The
approximate position is used to generate a two-dimensional scene from their three-dimensional world
model and the features in the generated scene are matched against those extracted from the observed
image. This method of image matching provides higher accuracy in position estimation.
Talluri and Aggarwal [1991; 1992] reported their extensive work on model-based positioning.
They use three-dimensional building models as a world model and a tree search is used to establish
a set of consistent correspondences. Talluri and Aggarwal [1993] wrote a good summary of their
algorithms as well as an extensive survey of some other vision-based positioning algorithms.
Chapter 9: Vision-Based Positioning 215
9.4.2 Digital Elevation Map-Based Localization
For outdoor positioning, Thompson et al. [1993] developed a hierarchical system that compares
features extracted from a visual scene to features extracted from a digital elevation maps (DEM).
A number of identifiable features such as peaks, saddles, junctions, and endpoints are extracted from
the observed scene. Similarly, features like contours and ridges are extracted from the DEM. The
objective of the system is to match the features from the scene onto a location in the map. The feature
matching module interacts with each feature extractor as well as with a geometric inference module.
Each module may request information and respond to the others. Hypotheses are generated and
tested by the interaction of these feature extractors, geometric inference, and feature matching
modules.
In order to make matching more tractable, configurations of distinctive and easily identified
features are matched first. Using a group of features cuts down dramatically on the number of
possible comparisons. Using rare and easily spotted features is obviously advantageous to making an
efficient match. A number of inference strategies that express viewpoint constraints are consulted in
the geometric inference module. These viewpoint constraints are intersected as more features are
considered, narrowing the regions of possible robot location.
Sutherland [1993] presented work on identifying particular landmarks for good localization. A
function weighs configurations of landmarks for how useful they will be. It considers the resulting
area of uncertainty for projected points as well as relative elevation. Sutherland showed that a careful
choice of landmarks usually leads to improved localization.
Talluri and Aggarwal [1990] formulated position estimation using DEM as a constrained search
problem. They determined an expected image based on a hypothetical location and compared that to
the actual observed image. Possible correspondences are eliminated based on geometric constraints
between world model features and their projected images. A summary of their work is given in
[Talluri and Aggarwal, 1993].
9.5 Feature-Based Visual Map Building
The positioning methods described above use a priori information about the environment in the form
of landmarks, object models or maps. Sometimes pre-loaded maps and absolute references for
positions can be impractical since the robot's navigation is restricted to known structured
environments. When there is no a priori information, a robot can rely only on the information
obtained by its sensors.
The general framework for map-building has been discussed in the previous chapter. For
constructing the environment model, vision systems usually use image features detected at one or
more robot positions. According to the computer vision theory of structure from motion and stereo
vision, correct correspondences of image features detected in several locations can provide
information about the motion of the sensor (both translation and rotation), as well as of the three-
dimensional structure of the environment at the feature locations. The trajectory of the sensor can be
obtained by visual dead-reckoning, i.e., the integration of the estimated incremental motion. This is
illustrated in Fig. 9.7.
The object features detected in a sensor location become the relative reference for the subsequent
sensor locations. When correspondences are correctly established, vision methods can provide higher
Position 2
Position 3
P
o
s
i
t
i
o
n
1
sang07.cdr, .wmf
216 Part II Systems and Methods for Mobile Robot Positioning
Figure 9.7: Illustration of map building and trajectory integration.
accuracy in position estimation than odometry or inertial navigation systems. On the other hand,
odometry and inertial sensors provide reliable position information up to certain degree and this can
assist the establishment of correspondence by limiting the search space for feature matching. A visual
map based on object features is a sparse description of environment structure.
Moravec [1981] used stereo cameras with variable baseline for obtaining environment structure
in the form of feature locations and estimating position of the sensors. A feature selection method was
suggested and coarse-to-fine correlation feature matching was used. The suggested error measure
is that the uncertainty in feature location is proportional to the distance from the sensor.
Matthies and Shafer [1987] proposed a more systematic and effective error measure using a three-
dimensional Gaussian distribution. A Kalman filter was used for updating robot positions based on
the Gaussian error distribution of detected features.
Ayache and Faugeras [1987] used trinocular stereo and three-dimensional line features for
building, registering and fusing noise visual maps. They used an extended Kalman filter for combining
measurements obtained at different locations.
9.6 Summary and Discussion
We reviewed some of the localization methods based only on photometric camera sensors. These
methods use:
C landmarks
C object models
C maps
C feature-based map-building
Most of the work discussed suggests methodologies that relate detected image features to object
features in an environment. Although the vision-based techniques can be combined with the methods
using dead-reckoning, inertial sensors, ultrasonic and laser-based sensors through sensor fusion,
tested methods under realistic conditions are still scarce.
Chapter 9: Vision-Based Positioning 217
Similar to the landmark-based and map-based methods that were introduced in the previous
chapters, vision-based positioning is still in the stage of active research. It is directly related to most
of the computer vision methods, especially object recognition which involves identification of object
class and pose estimation from the identified object. As the research in many areas of computer vision
and image processing progresses, the results can be applied to vision-based positioning. In addition
to object recognition, relevant areas include structure from stereo, motion and contour, vision sensor
modeling, and low-level image processing. There are many vision techniques that are potentially
useful but have not been specifically applied to mobile robot positioning problems and tested under
realistic conditions.
218 Appendices, References, Indexes
APPENDIX A
A WORD ON KALMAN FILTERS
The most widely used method for sensor fusion in mobile robot applications is the Kalman filter.
This filter is often used to combine all measurement data (e.g., for fusing data from different sensors)
to get an optimal estimate in a statistical sense. If the system can be described with a linear model and
both the system error and the sensor error can be modeled as white Gaussian noise, then the Kalman
filter will provide a unique statistically optimal estimate for the fused data. This means that under
certain conditions the Kalman filter is able to find the best estimates based on the “correctness” of
each individual measurement.
The calculation of the Kalman filter is done recursively, i.e., in each iteration, only the newest
measurement and the last estimate will be used in the current calculation, so there is no need to store
all the previous measurements and estimates. This characteristic of the Kalman filter makes it
appropriate for use in systems that don't have large data storage capabilities and computing power.
The measurements from a group of n sensors can be fused using a Kalman filter to provide both an
estimate of the current state of a system and a prediction of the future state of the system.
The inputs to a Kalman filter are the system measurements. The a priori information required are
the system dynamics and the noise properties of the system and the sensors. The output of the Kalman
filter is the estimated system state and the innovation (i.e., the difference between the predicted and
observed measurement). The innovation is also a measure for the performance of the Kalman filter.
At each step, the Kalman filter generates a state estimate by computing a weighted average of the
predicted state (obtained from the system model) and the innovation. The weight used in the weighted
average is determined by the covariance matrix, which is a direct indication of the error in state
estimation. In the simplest case, when all measurements have the same accuracy and the measure-
ments are the states to be estimated, the estimate will reduce to a simple average, i.e., a weighted
average with all weights equal. Note also that the Kalman filter can be used for systems with time-
variant parameters.
The extended Kalman filter is used in place of the conventional Kalman filter if the system model
is potentially numerically instable or if the system model is not approximately linear. The extended
Kalman filter is a version of the Kalman filter that can handle non-linear dynamics or non-linear
measurement equations, or both [Abidi and Gonzalez, 1992].
Appendices 219
APPENDIX B
UNIT CONVERSIONS AND ABBREVIATIONS
To convert from To Multiply by
(Angles)
degrees (E) radian (rad) 0.01745
radian (rad) degrees (E) 57.2958
milliradians (mrad) degrees (E) 0.0573
(Length)
inch (in) meter (m) 0.0254
inch (in) centimeter (cm) 2.54
inch (in) millimeter (mm) 25.4
foot (ft) meter (m) 30.48
mile (mi), (U.S. statute) meter (m) 1,609
mile (mi), (international nautical) meter (m) 1,852
yard (yd) meter (m) 0.9144
(Area)
inch (in ) meter (m ) 6.4516 × 10
2 2 2 2 -4
foot (ft ) meter (m ) 9.2903 × 10
2 2 2 2 -2
yard (yd ) meter (m ) 0.83613
2 2 2 2
(Volume)
foot (ft ) meter (m ) 2.8317 × 10
3 3 3 3 -2
inch (in ) meter (m ) 1.6387 × 10
3 3 3 3 -5
(Time)
nanosecond (ns) second (s) 10
-9
microsecond (µs) second (s) 10
-6
millisecond (ms) second (s) 10
-3
second (s)
minute (min) second (s) 60
hour (hr) second (s) 3,600
(Frequency)
Hertz (Hz) cycle/second (s- ) 1
1
Kilohertz (KHz) Hz 1,000
Megahertz (MHz) Hz 10
6
Gigahertz (GHz) Hz 10
9
220 Appendices, References, Indexes
To convert from To Multiply by
(Velocity)
foot/minute (ft/min) meter/second (m/s) 5.08 × 10
-3
foot/second (ft/s) meter/second (m/s) 0.3048
knot (nautical mi/h) meter/second (m/s) 0.5144
mile/hour (mi/h) meter/second (m/s) 0.4470
mile/hour (mi/h) kilometer/hour (km/h) 1.6093
(Mass, Weight)
pound mass (lb) kilogram (kg) 0.4535
pound mass (lb) grams (gr) 453.59
ounce mass (oz) grams (gr) 28.349
slug (lbf · s /ft) kilogram (kg) 14.594
2
ton (2000 lbm) kilogram (kg) 907.18
(Force)
pound force (lbf) newton (N) 4.4482
ounce force newton (N) 0.2780
(Energy, Work)
foot-pound force (ft · lbf) joule (J) 1.3558
kilowatt-hour (kW · h) joule (J) 3.60 × 10
6
(Acceleration)
foot/second (ft/s ) meter/second (m/s ) 0.3048
2 2 2 2
inch/second (in./s ) meter/second (m/s ) 2.54 × 10
2 2 2 -2
(Power)
foot-pound/minute (ft · lbf/min) watt (W) 2.2597 × 10
-2
horsepower (550 ft · lbf/s) watt (W) 745.70
milliwatt (mW) watt (W) 10
-3
(Pressure, stress)
atmosphere (std) (14.7 lbf/in ) newton/meter (N/m or Pa) 101,330
2 2 2
pound/foot (lbf/ft ) newton/meter (N/m or Pa) 47.880
2 2 2 2
pound/inch (lbf/in or psi) newton/meter (N/m or Pa) 6,894.8
2 2 2 2
(Temperature)
degree Fahrenheit (EF) degree Celsius (EC) EC = (EF -32) × 5 / 9
(Electrical)
Volt (V); Ampere (A); Ohm (S)