Báo cáo y học: " Discovery of serum biomarkers of alcoholic fatty liver in a rodent model: C-reactive protein" doc
Bạn đang xem bản rút gọn của tài liệu. Xem và tải ngay bản đầy đủ của tài liệu tại đây (7.11 MB, 10 trang )
RESEARC H Open Access
Discovery of serum biomarkers of alcoholic fatty
liver in a rodent model: C-reactive protein
Shu-Lin Liu
1
, Chun-Chia Cheng
2,3
, Chun-Chao Chang
4
, Fu-Der Mai
2,5,6
, Chia-Chi Wang
7
, Shui-Cheng Lee
3
,
Ai-Sheng Ho
8
, Ling-Yun Chen
1*
and Jungshan Chang
2,5,9,10*
Abstract
Background: Excessive consumption of alcohol contributes to alcoholic liver disease. Fatty liver is the early stage
of alcohol-related liver disease. The aim of this study was to search for specific serological biomarkers of alcoholic
fatty liver (AFL) compared to healthy controls, non-alcoholic fatty liver (NAFL) and liver fibrosis in a rodent model.
Methods: Serum samples derived from animals with AFL, NAFL, or liver fibrosis were characterized and compared
using two-dimensional differential gel electrophoresis. A matrix-assisted laser desorption ionization-time of flight
tandem mass spectrometer in conjunction with mascot software was used for protein identification. Subsequently,
Western blotting and flexible multi-analyte profiling were used to measure the expressions of the putative
biomarkers present in the serum of animals and clinical patients.
Results: Eight differential putative biomarkers were identified, and the two most differentiated proteins, including
upregulated C-reactive protein (CRP) and downregulated haptoglobin (Hp), were further investigated. Western
blotting validated that CRP was dramatically higher in the serum of AFL compared to healthy controls and other
animals with liver disease of NAFL or liver fibrosis (p < 0.05). Moreover, we found that CRP and Hp were both
lower in liver fibrosis of TAA-induced rats and clinical hepatitis C virus-infected patients.
Conclusion: The results suggest that increased levels of CRP are an early sign of AFL in rats. The abnormally
elevated CRP induced by ethanol can be used as a biomarker to distinguish AFL from normal or otherwise
diseased livers.
Keywords: alcoholic fatty liver, biomarker, C - reactive protein, haptoglobin, two-dimensional differ ential gel
electrophoresis
Background
Excessive alcohol consumption affects lipid metabolism
in the liver [1,2], contributing to the development of
alcohol-related liver diseases. There are three main types
of alcohol-related liver disease, these are: alcoholic fatty
liver (AFL), alcoholic hepatitis, and a lcoholic cirrhosis.
AFL is the early stage of alcohol-related liver diseases.
Ther efore, identifying putative serum biomarkers of A FL
for early and accurate diagnostic methods is vital.
Histological assessment of liver biopsy specimens
remains the gold standard for determining alcohol-
related liver disease. However, the methodology of histo-
logical assessments needs to overcome several draw-
backs such as its invasive character and sampling error
[3]. Moreover, it has difficulty in distinguishing AFL
from non-alcoholic fatty liver sol ely through a histologi-
cal assessment. On the other hand, predicting ethanol-
induced oxidative stress and tissue injury in the liver
require particularly sensitive markers [4]. A previous
study suggested that glutamyl-transpeptidase (GGT) and
alanine aminotransferase (ALT) are biomarkers for diag-
nosing alcoholic live r disease [5]. Several reports pro-
posed that serum C-reactive protein (CRP), tissue
polypeptide-specific antigen (TPS), and interleukin-6 are
noninvasive biomarkers of alcoholic hepatitis [6-10].
Nevertheless, a reliable biomarker to predict the early
* Correspondence: ;
1
Institute of Biochemistry and Biotechnology, Chung Shan Medical
University, Taichung, Taiwan
2
Graduate Institute of Medical Sciences, College of Medicine, Taipei Medical
University, Taipei, Taiwan
Full list of author information is available at the end of the article
Liu et al. Journal of Biomedical Science 2011, 18:52
/>© 2011 Liu et al; licensee BioMed Central Ltd. This is an Open Access articl e distributed under the terms of the Creative Commons
Attribution License ( which permits unrestricted use, distribution, and reproduction in
any mediu m, provided the original work is p roperly cited.
stage o f alcoholic hepatitis, i.e., AFL, and to distinguish
AFL from other types of liver disease is needed.
A proteomics strategy based on two-dimensional differ-
ential gel electrophoresis (2D-DIGE) [11] allows for the
simultaneous resolution of thousands of proteins from
samples with high precision and replication. 2D-DIGE
was used to screen and determine putative biomarkers of
many diseases [12-15]. Those protein samples of interest
displayed on 2D-DIGE can be extracted and acquired
from gels for identification and further investigation. In
total, we discovered eight differential proteins associated
with AFL using 2D-DIGE, including the most differen-
tiated proteins: CRP and haptoglobin (Hp).
This study revealed that CRP is a novel early biomarker
of alcohol-induced fatty liver, and that CRP and Hp were
both particularly decreased with liver fibrosis. In conclu-
sion, we present CRP as a surveillance marker of alcohol-
induced fatty liver in a rodent model, which may help
diagnose early alcohol-induced pathophysiological altera-
tions in clinical practice.
Materials and methods
Animal model and sample preparation
Animal experime ntation was pe rformed according to
approved procedures of the Institute of Nuclear Energy
Research, Atomic Energy Council, Taoyuan, Taiwan
(approval no.: 98053). Wistar rats were used to generate
animals with AFL, non-AFL (NAFL), and liver fibrosis.
AFL rats (n = 6) were orally fed 5 ml of a 36% alcohol
solution for 4 weeks (6 g/kg/day) [16]. For rats with
NAFL, animals were given food containing 60% fructose
(n = 4) or 45% fa t (n = 6) for 12 weeks. The liver-fibrosis
rats (n = 6) were fed 0.04% thioacetamide (TAA)-contain-
ing drinking water for 12 weeks. Control animals were fed
normal diets with no additives in their food (n = 7). Sera
and liver tissues were collected for further investigation.
Clinical serum collection
The sera of healthy volunteers (n = 16), patients with non-
alcoholic steatohepatitis (n = 1 9) an d patients with hepatitis
C virus (HCV)-infected liver fibrosis ( n = 17) were
obtained from Cheng Hsin General Hospital in Taiwan
(approval no. 97016). A liver biopsy and subsequent histo-
logic al examination were used to assess the stag e of liver
fibrosis according to the Metavir classification, and also to
determine the fatty change and modified HAI grade. A
liver biopsy was not performed in healthy controls due to
ethical issues.
2D-DIGE
Each 50 μg of protein from a normal control or AFL rat
was labeled with 400 pmol of Cy3 or Cy5 and the inter-
nal pooled stand ard (100 μg) was labeled with 800 pmol
of Cy2 for 30 min. The three labeled samples were
pooled together for analysis. IPG strips (18 cm) at pH
4~7 for the f irst-dimension IEF (Ettan IPGphor System,
GE Healthcare) and 12.5% polyacrylamide gels for the
second dimension were used to separate serum proteins.
The Cy2, Cy3, and Cy5-labeled images were acquired on
a Typhoon TRIO Variable Mode Imager (GE Health-
care) using 488-, 532-, and 633-nm lasers with respec-
tive emission filters of 520, 532, and 670 nm. Images
were analyzed using DeCyder 6.5 software (GE Health-
care) to select the differential proteins. Protein spots of
interest were selected according to an independ ent Stu-
dent’s t-test with a significant value of < 0.05.
Protein identification
In-gel digestion and MALDI-TOF MS analysis were per-
formed as previously described [13].
Western blotting
Each serum sample was diluted 1: 1 with a sodium dode-
cylsulfate (SDS) buffer containing 50 mM of Tris-Cl, 8 M
urea, 30% glycerol, 2% SDS, 20 mM of dithiothreitol, and
0.1% bromophenol blue. A 4%~12% SDS- polyacrylamid e
gel electrophoresis (PAGE) (Invitrogen) was performed to
separate the proteins. The iblot (Invitrogen) was used to
transfer proteins to a polyvinylidene difluoride (PVDF)
membrane. After using 0.5% milk to blot the PVDF mem-
brane for 30 min, CRP and Hp were detected by a mouse
anti-CRP immunoglobulin G (IgG) (Affinity BioReagents)
and a mouse anti- Hp IgG (Sigma) for at least 1 h respec-
tively. The s econd antibody conjugated with horseradish
peroxidase (HRP) was incubated for 1 h at room tempera-
ture. The membranes were washed three times in phos-
phate-buffered saline (PBS; 10 mM sodium phosphate
(pH7.4) and 0.9% NaCl) between adding antibodies. The
Imaging System (Gel Doc XR System, Bio-Rad) was used
to acquire images depending on a moderate exploration
time and to semi-quantify protein expressions.
Measurement of CRP and Hp concentration
Flexible multi-analyte profiling (xMAP) was performed
to measure serum concentrations of CRP and Hp in
clinical samples using the commercial Bio-Plex Pro
Human Acute Phase 4-Plex Panel (Bio-Rad). The mea-
surment procedure followed instructions in the manual.
Statistical analysis
The statistical soft ware, SPSS, was used to calculate the
sig nificance according to Student’ s t-test. Significance (p
value) was accepted as < 0.05.
Results
Animal models
Each experimental animal bearing a specific liver disease,
namely: AFL, NAFL and, liver fibrosis was anal yzed and
Liu et al. Journal of Biomedical Science 2011, 18:52
/>Page 2 of 10
compared. To ensure the correct establishment of the
animal models, several indicators in the serum including
aspartate aminotransferase (AST), alanine aminotransfer-
ase (ALT), total bilirubin (TBIL), total cholesterol
(TCHO) and triglyceride (TG) were measured and com-
pared (Table 1). Levels of AST, ALT, and TBIL incr eased
in LF rats [199 ± 37 U/L (p < 0.01), 74.4 ± 19 U/L (p <
0.01), and 0.84 ± 0.10 mg/dl (p < 0.05), respectively] com-
pared to those in normal controls (AST 154 ± 25 U/L;
ALT 56 ± 15 U/L; and TBIL 0.70 ± 0.06 mg/dl), indicat-
ing that the liver function of LF rats was impaired. How-
ever, no significant changes in these three serum
indicators in AFL and NAFL were observed. Other indi-
cators, TCHO and TG, were measured to observe lipid
accumulation in the liver. An increased TG level was
observed only in the group of rats fed the high concen-
tration of fr uctose (91 ± 14 mg/dl, p < 0.05) compared to
other rats fed different diets, but the TCHO level
remained unchanged. These results show that AST, ALT,
and TBIL increased in the serum of LF rats, and TG
increased in rats that were fed a high level fruc tose.
Therefore, these existing serum indicators so far could
not be used to distinguish AFL from the normal controls,
which means that finding differential biomarkers of AFL
is vital.
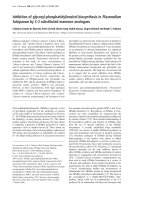
On the other hand, we observed that there was no sig-
nificant difference i n the morpho logy of livers among
normal, AFL and, NAFL rats except for rats with liver
fibrosis showing excess scars (Figure 1) . To more-deeply
assess our established rodent models using histological
examinations , the results showed that livers of rats with
AFL appeared to specifically be filled with macrovesicu-
lar fat within hepatocytes compared to normal controls
according to histological staining with hematoxylin and
eosin (H&E) (Figure 1) , demonstrating that ethanol
treatment induced lipid accumulation in the liver.
Furthermore, signs of focal necroinflammation were
absent from the liver tissues of rats with AFL (Figure 1).
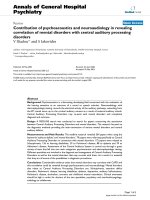
Discovery of AFL biomarkers using 2D-DIGE
In order to explore the signature molecular biomarkers
of AFL, a proteomic methodology, 2D-DIGE, described
above “Materials and methods” was performed to an a-
lyze individual serum from two normal controls or two
AFL rats shown on Figure 2A to search for putative bio-
markers of AFL. In the 2D-DIGE analysis, Cy3 and Cy5
were used to individually label serum samples from nor-
mal controls and AFL rats. For sample normalization,
Cy2 was used to label the internal standard including
50% of normal and 50% o f AFL rats. The protein image
was presented as shown in Figure 2B. Normal control
sera were labeled with Cy3 and appeared colored green
in the gel. Samples derived from rats with AFL were
pre-labeledwithCy5andshowedasaredcolorinthe
gel. Eight differential proteins including CRP, Hp, afa-
min, alpha-fetoprotein (AFP), inter-alpha-inhibitor H4
heavy chain (ITIH4), serine protease inhibitor Kazal-
type 5 (SPINK5), heak shock protein 75 kDa (HSP75),
and vitamin D binding protein prepeptide (VDBP) were
acquired according to the statistical analysis with signifi-
cant p values (t-test, p < 0.05), and an intensity c hange
ratio of > 1.2-fold calculated with DeCyder software.
The location of each protein is shown in Figure 2C.
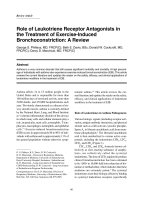
When using a stereopicture and detailed gel images to
present the protein expressions of differential biomar-
kers (Figure 3), CRP, AFP and afamin were increased
higher in the serum of AFL rats, and Hp, ITIH4,
SPINK5, HSP75, and VDBP were conversely lower. In
particular, Hp, ITIH4 and SPINK5 had a series of spots
nearby, but the protein expressional trends were still the
same. We speculated that post-translational modification
would not affect or influence the protein expression.
Essentially, we identified protein spots by comparing the
mass sp ectrum obtained from MALDI-TOF MS coupled
with the NCBI database. The proteins identified are
shown in Table 2. According to the set calculation in
the DeCyder software, the upregulation (+) is presented
Table 1 Levels of some clinical serum indicators in the animals
Indicators Normal
(n =7)
AFL
(n =6)
HF-NAFL (n = 4) HL-NAFL (n =6) LF
§
(n =5)
BW (g) 270 ± 5
¶
/457 ± 14
§
275 ± 3
¶
418 ± 28
§
565 ± 29
§,
*ND
AST (U/L) 154 ± 25 148 ± 34
c
164 ± 31 181 ± 63 199 ± 37*
ALT (U/L) 56 ± 15 41 ± 13
c
48 ± 17 57 ± 22 74 ± 19*
TBIL
(mg/dl)
0.70 ± 0.06 0.62 ± 0.09
a, b, c
0.78 ± 0.04 0.75 ± 0.05 0.84 ± 0.10*
TG
(mg/dl)
51 ± 16 58 ± 10
a
91 ± 14** 56 ± 11 48 ± 14
TCHO
(mg/dl)
61 ± 10 68 ± 8 72 ± 10 71 ± 12 61 ± 17
BW, body weight; AST, aspartate aminotransferase; ALT, alanine aminotransferase; TBIL, total bilirulin; TG, triglyceride; TCHO, total cholesterol; AFL, alcoholic fatty
liver; HF-NAFL, high fructose-induced non-alcoholic fatty liver; HL-NAFL, high lipid-induced non-alcoholic fatty liver; LF, liver fibrosis. Indicators for predicting liver
function include GOT, GPT, and bilirubin and for predicting fat cells include triglyceride and cholesterol. Rats were treated before the age of 6 weeksand
sacrificed by the ages of
¶
10 and
§
18 weeks. ND, Non-detection. The p value was calculated according to Student’s t-test. * p < 0.05 and **p < 0.01 as compared
to normal controls. A significant change (p < 0.05) was also determined for AFL rats compared to
a
HF-NAFL,
b
HL-NAFL, and
c
LF rats.
Liu et al. Journal of Biomedical Science 2011, 18:52
/>Page 3 of 10
as the levels o f AFL divided by that of normal control,
and the downregulation (-) is presented as the levels of
normal control divided by that of AFL. The results
demonstrated that CRP and Hp were dramatically up-
and downregulated, respectively (CRP: +4.71-fold; HP:
-11.54-fold, Table 2).
CRP and Hp validation
We were interested in characterizing the role of CRP
and Hp in A FL due to significant changes in their pro-
tein expressions. In the process of Western blotting, we
precisely controlled the loading protein to 20 μg, and
the total protein stained by SYPRO Ruby was used as a
Figure 1 Histological analysis and comparisons among f our groups of rats. Images of livers from normal control, rats with alcoholic fatty
liver (AFL), non-alcoholic fatty liver (NAFL, fed 60% fructose) and liver fibrosis (left column) were analyzed by hematoxylin and eosin (H&E)
staining (right column). In AFL and NAFL rats, livers were filled with prominent fatty change. The scale bar represents 25 μm for normal, AFL and
NAFL; but 100 μm for liver fibrosis.
Liu et al. Journal of Biomedical Science 2011, 18:52
/>Page 4 of 10
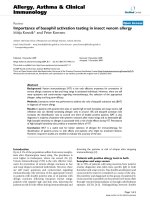
loading standard (data not shown). Figure 4A and 4B
show that CRP particularly increased in AFL rats com-
pared to all other groups including normal rats and rats
with NAFL disease or liver fibrosis (all p <0.05),
demonstrating that CRP is a putative biomarker of AFL.
Meanwhile, Hp did not significantly decrease in the
serum of AFL rats according to the Western blotting
analysis (Figure 4A). Interestingly, we observed that CRP
and Hp were both downregulated in the serum of liver
fibrosis rats compared to normal, AFL, and NAFL rats
(Figure 4B, C, all p < 0.05). On the other hand, we also
examined the level of alpha1 antitrypsin (AAT) to
exclude the elevation of CRP derived from ethanol-
induced gastrointestinal inflammation. The results
showed that AAT levels were not increased in
the serum of AFL rats compared to healthy controls
(Figure 4D).
Moreover, in order to evaluate the decreased expres-
sionsofCRPandHpintheserumofliverfibrosisrats,
we measured serum CRP and Hp concentrations in clin-
ical patients with non-alcoholic steatohepatitis (NASH)
and HCV-induced liver fibrosis compared to healthy
controls. Table 3 shows that CRP and Hp were lower i n
patients with HCV-induced liver fibrosis, which was
consistent with the results demonstrated by West ern
blotting, suggesting that CRP and Hp are reliable bio-
markers of liver fibrosis as downregulated proteins.
Interestingly,wefoundthatserumHpwaselevatedin
NAFL rats, but lower in NASH patients, implying that
theexpressionofHpmayvarybetweenthenon-
necroinflammatory stage (NAFL) and necroinflamma-
tory stage (NASH).
Discussion
The aim of this study was to determine the putative sero-
logical biomarkers of AFL using 2D-DIGE, and then
these candidate markers were validated by Western blot-
ting. To c haracterize AFL disease mark ers, our experi-
mental strategy was first to induce patholophysiological
abnormalities in animals by administering alcohol, high
calories of compounds such as: fructose or fats, and
drinking water with TAA, a fibrosis-inducing chemical.
Under this experimental platform, rats should have
developed AFL, NAFL and liver fibrosis, allowing us to
determine the signature biomarkers for AFL, which is the
early stage in the alcohol-induced liver disease. From our
rodent models, we determined that CRP levels were sig-
nificantly elevated in the serum of rats with AFL, pre-
sumably as a reliable biomarker compared to that in
livers of healthy or sick rats with other liver diseases.
Indeed, CRP increases in other conditions, such as
inflammation, obesity [17,18], and cardiovascular disease
[19,20]; however, it is also a elevated AFL-induced pro-
tein in rats as discovered in this study. Here, our discov-
ery provides a hint that CRP can be used to distinguish
AFL from normal or otherwise diseased livers. A pre-
vious report indicated that CRP is a non-invasive marker
of alcoholic hepatitis in heavy drinkers compared to
Figure 2 Determination of serum biomarkers of alcoholic fatty liver (AFL) using 2D-DIGE. (A) The experimental design used two individual
samples each from healthy controls and AFL. (B) The combination of two different acquired images, in which, green color represents Cy3-labeled
normal control and red color represents Cy5-labeled AFL. (C) The identified proteins are indicated by arrows on the 2D gel. Ultimately there
were eight proteins selected according to statistical significance with a t-test value of < 0.05 (p < 0.05) as analyzed by the DeCyder software.
Vitamin D-binding protein (VDBP), haptoglobin (HP), C-reactive protein (CRP), alpha-fetoprotein (AFP), inter-alpha-inhibitor H4 heavy chain (ITIH4),
serine protease inhibitor Kazal-type 5 (SPINK5) and heak shock protein 75 kDa (HSP75) and afamin.
Liu et al. Journal of Biomedical Science 2011, 18:52
/>Page 5 of 10
Figure 3 Stereopictures and detailed images of eight putative biomarkers . VDBP, vitamin D binding protein; HP, haptoglobin; CRP, C-
reactive protein; AFP, alpha-fetoprotein; ITIH4, Inter-alpha-inhibitor H4 heavy chain; SPINK5, Serine protease inhibitor Kazal-type 5; HSP75, Heak
shock protein 75 kDa. The protein spots are indicated by arrows. Three proteins, CRP, AFP and afamin, were upregulated whereas the other
proteins, including Hp, ITIH4, APINK5, HSP75 and VDBP, were downregulated.
Liu et al. Journal of Biomedical Science 2011, 18:52
/>Page 6 of 10
hepatitis unrelated to alcohol [7]. In this study, we dis-
covered that CRP levels were elevated in A FL rats com-
pared to healthy animals, and rats wit h other forms of
liver diseases, such as NAFL and TAA-induced liver
fibrosis. Although the use of moderate alcohol con-
sumption can lower the level of CRP in the serum and
decrease cardiova scular mortality [21], in our stu dy the
intake of high amounts of alcohol in this rodent model
increased the level of serum CRP, suggesting that the
intake of ethanol is positively associated w ith the level
of serum CRP. To our knowledge, CRP is considered an
inflammatory protein produced from macrophages in
the liver and adipocytes [22,23]. In order to exclude ele-
vated CRP derived from a response to gastrointestinal
inflammation because of ethanol consumption, we
examined protein levels of alpha1 antitrypsin, an acute-
phase marker [24,25], determined by Western blot ting,
which provided a positive reference of an inflammatory
response. The results showed that levels of alpha1 anti-
trypsin in rats among the four groups were the same
(Figure 4A, D), indicating that the elevation of CRP was
not due to gastrointestinal inflammation. Moreover, in
vitro study revealed that ethanol can directly trigger the
secretion of CRP in HepG2 cells (data not shown).
Herein, the results suggest that ethanol-induced forma-
tion of fatty liver was strongly related to the induction
of serum CRP in rats supplied with excess ethanol.
An increase in CRP was also reported to be associated
with obesity [17,18]. To address our concern for the
obesity issue, we also measured animal weight in all
Table 2 Protein spots identified by MALDI-TOF/TOF MS
Gene name Protein name Mr (Da)/pI Coverage ratio Regulation
¶
p value
Crp C-reactive protein 25452/4.89 7%
§
+4.71 0.02
Afm Afamin 49311/6.14 59% +1.64 0.04
Afp Alpha-fetoprotein 47195/5.47 3%
§
+1.46 0.03
Hp Haptoglobin 39052/6.10 48% -11.54 0.04
Gc Vitamin D-binding protein 53493/5.65 4%
§
-1.74 0.04
Itih4 Inter-alpha-inhibitor H4 heavy chain 103885/6.08 48% -1.66 0.03
Spink5 Serine protease inhibitor Kazal-type 5 114816/8.68 74% -1.67 0.04
Trap1 Heak shock protein 75 kDa, mitochondrial 80639/6.56 57% -1.96 0.02
§
Those proteins were identified by MS/MS.
¶
Presented as up- (+) or down regulation (-) compared to normal controls.
Figure 4 Evaluation of the expressions of alcoh olic fatty liver (AFL) biomarkers using western blotting. (A) Confirmation of C-reactive
protein (CRP) and haptoglobin (Hp) expression by Western blotting. AAT was used as an indicator represented as a positive inflammatory
protein for gastrointestinal inflammation (B) The semi-quantification of the results of Western blotting. CRP increased in the serum of AFL rats
compared to normal, NAFL and liver fibrosis ones, but decreased in TAA-induced liver fibrosis. (C) Hp increased in rats suffering from NAFL, but
decreased in liver fibrosis compared to the controls. (D) AAT was not affected among the rats. Three individual samples of healthy controls,
NAFL, and liver fibrosis, and five samples of AFL were examined by using Western blotting. N, normal controls; AFL, alcoholic fatty liver; NAFL,
non-alcoholic fatty liver; CRP, C-reactive protein; Hp, haptoglobin; AAT, alph1 antitrypsin. *p < 0.05, compared to healthy controls;
#
p < 0.05 as
compared to the other groups.
Liu et al. Journal of Biomedical Science 2011, 18:52
/>Page 7 of 10
groups . We observed that macrovesicular fat was appar-
ent in the liver tissues of rats fed diets containing a high
fructose content (HF-NAFL) which did not increase
serum CRP. In AFL rats, macrovesicular fat was also
observed, but serum CRP was elevated. Therefore, this
suggests that alcohol abuse may cause fatty liver and
induce high serum CRP levels, indicating that CRP may
be qualified as a unique biomarker of AFL.
Administration of ethanol can elicit oxidative stress
and injury t o the liver [4,26], and the presence of poly-
unsaturated fats can induce the production of cyto-
chrome P4502E1 (CYP2E1) [27,28]. Under conditions of
persistent ethanol stimulation, CYP2E1 seems to play a
critical role in metabolizing and activating many toxico-
logical substances such as reactive oxygen species (ROS)
[26,29]. A recent study indicated that cytokines such as
tumor necrosis fact or-alpha and interleukin-10 in adi-
pose tissues of acute alcoholic hepatitis patients were
elevated, and were correlated with the serum CRP con-
centration [30], implying that inflammation caused the
production of CRP. Although the mechanism o f how
ethanol induces CRP in serum is unclear, in this study,
we discovered that ethanol consumption is an important
factor positively associated with the production of
serum CRP.
In addition to the increased CRP levels in AFL rats,
serum Hp was also discovered to be a biomarker of AFL
with reduced expressi on levels in the serum of AFL rats
using 2D-DIGE. However, Hp was elevated in the serum
of NAFL rats and even decreased in that of rats with
TAA-induced liver fibrosis (Figure 4C). Previous studies
reported by Chiellini’ s group indicated that elevated
serum Hp is recognized as a marker of adiposity [31].
Our results demonstrate thatHpisnotonlyincreased
in NAFL, but also decreased in TAA-induced and HCV-
induced liver fibrosis. Furthermore, Shu et al. indicated
that Hp was overexpresse d in hepatocellular carcinoma
compared to those with hepatitis B virus (HBV)-relat ed
cirrhosis [32]. However another research group led by
Dr. Lee reported that Hp levels were decreased indepen-
dently in hepatic fibrosis in chronic liver disease [33].
Therefore, the level of serum Hp may vary under var-
ious pathophysiological situations or stages in clinical
liver diseases. Hp is also used in the panel of AshTest
[34] as a down-regulated protein. In this study, we
found that H p was a downregulated protein in NASH
and HCV-infected liver fibrosis although we found that
HpmaybehigherintheserumofNAFLrats.The
results demonstrated that Hp is a reliable downregulated
biomarker of NASH and liver fibrosis in clinical cases.
Conclusions
For a diagnos is of alcoholic liver disease, a biopsy is the
gold standard. Current st udies focusing on the discovery
of a noninvasive biomarker panel for diagnosis or prog-
nosis imply that development of a noninvasive method
is urgent. CRP is considered to be a marker of athero-
sclerotic cardiovascular disease in clinical analysis
[19,20], modulating endothelial function in the process
of atherogenesis [35]; therefore, we suggest that using
CRP to distinguish AFL f rom the other liver diseases
may consider the complication of cardiovascular disease.
In conclusion, this is the first report to r eveal new can-
didate biomarkers of AFL using a proteomics analysis.
In this study, eight AFL-associated serological proteins
were disclosed, which may be associated with AFL in
rats. We suggest that CRP is suitable to serve as a can-
didate biomarker of AFL, and Hp is a reliable biomarker
that decrease in NASH and liver fibrosis. In particular,
serum CRP may be qualified to be an elevated surveil-
lance target for early diagnosis of AFL in clinical
screening.
Acknowledgements
We would like to thank Dr. Jyh-Chin Yang and Dr. Chiang-Ting Chien who
kindly supported and prov ided the animals from National Taiwan University,
Taipei, Taiwan. We also thank David Cooke from Oxfordshire, UK for helping
us to revise the manuscript.
Table 3 Serum concentration of C reactive protein (CRP) and haptoglobin (Hp) in clinical patients
Patients (n) Fibrosis
(n,%)
P-steatosis
(n,%)
HAI
(n,%)
CRP
(mg/L)
Hp
(g/L)
Healthy (16) ND ND ND 1.58 ± 0.48 1.13 ± 0.63
NASH (19) F1~F2
(19, 100%)
Stage 0~1
(7, 37%)
Stage 0~4
(18, 95%)
ND 0.74 ± 0.39*
Stage 2~3
(12, 63%)
Stage 5~13
(1, 5%)
HCV-
liver fibrosis (17)
F1~F2
(7, 41%)
Stage 0~1
(15, 88%)
Stage 0~4
(2, 12%)
1.31 ± 0.44* 0.45 ± 0.58*
,#
F3~F4
(10, 59%)
Stage 2~3
(2, 12%)
Stage 5~13
(15, 88%)
The fibrotic stage was determined according to the Metavir classification. The stage of p-steatosis was determined according to the fatty change. HAI,
necroinflammatory scores. NASH, non-alcoholic steatohepatitis; ND, not determined.* p < 0.05, compared to healthy controls.
#
p < 0.05, compared to NASH. The
significance was calculated according to Student’s t-test. The data are presented as the mean ± SEM.
Liu et al. Journal of Biomedical Science 2011, 18:52
/>Page 8 of 10
Author details
1
Institute of Biochemistry and Biotechnology, Chung Shan Medical
University, Taichung, Taiwan.
2
Graduate Institute of Medical Sciences, College
of Medicine, Taipei Medical University, Taipei, Taiwan.
3
Institute of Nuclear
Energy Research, Atomic Energy Council, Taoyuan, Taiwan.
4
Department of
Internal Medicine, School of Medicine, College of Medicine, Taipei Medical
University Hospital, Taipei, Taiwan.
5
Department of Biochemistry, School of
Medicine, Taipei Medical Uni versity, Taipei, Taiwan.
6
Biomedical Mass
Imaging Research Center, Taipei Medical University, Taipei, Taiwan.
7
Division
of Gastroenterology, Buddhist Tzu Chi General Hospital, Taipei branch,
Taiwan.
8
Division of Gastroenterology, Cheng Hsin General Hospital, Taipei,
Taiwan.
9
Research Center For Biomedical Implants and Microsurgery Devices,
Taipei Medical University, Taipei, Taiwan.
10
Neuroscience Research Center,
Taipei Medical University Hospital, Taipei, Taiwan.
Authors’ contributions
SLL: revised the article and designed the experiments. CCC: participated in
article writing and performed most experiments, including 2D-DIGE, MALDI-
TOF/TOF MS, and Western blotting. FDM and JS: Project leaders and
corresponding authors, participated in this project in revising the article and
providing opinions and inter pretation of the data. SCL: provided suggestions
and analysis regarding experimental outcomes as well as revised the article.
CCW and CCC: performed tissue sampling and diagnosis. ASH: participated
in the collection and diagnosis of clinical samples. LYC: Lab leader and
article final revision, contributed to interpretation of the data. All authors
read and approved the final manuscript.
Competing interests
The authors declare that they have no competing interests.
Received: 25 March 2011 Accepted: 1 August 2011
Published: 1 August 2011
References
1. Rouach H, Fataccioli V, Gentil M, French SW, Morimoto M, Nordmann R:
Effect of chronic ethanol feeding on lipid peroxidation and protein
oxidation in relation to liver pathology. Hepatology 1997, 25:351-355.
2. Grunnet N, Kondrup J, Dich J: Effect of ethanol on lipid metabolism in
cultured hepatocytes. Biochem J 1985, 228:673-681.
3. Maharaj B, Maharaj RJ, Leary WP, Cooppan RM, Naran AD, Pirie D,
Pudifin DJ: Sampling variability and its influence on the diagnostic yield
of percutaneous needle biopsy of the liver. Lancet 1986, 1:523-525.
4. Dey A, Cederbaum AI: Alcohol and oxidative liver injury. Hepatology 2006,
43:S63-74.
5. Levitsky J, Mailliard ME: Diagnosis and therapy of alcoholic liver disease.
Semin Liver Dis 2004, 24:233-247.
6. Fujimoto M, Uemura M, Kojima H, Ishii Y, Ann T, Sakurai S, Okuda K,
Noguchi R, Adachi S, Kitano H, et al: Prognostic factors in severe alcoholic
liver injury. Nara Liver Study Group. Alcohol Clin Exp Res 1999, 23:33S-38S.
7. Vanbiervliet G, Le Breton F, Rosenthal-Allieri MA, Gelsi E, Marine-Barjoan E,
Anty R, Piche T, Benzaken S, Saint-Paul MC, Huet PM, Tran A: Serum C-
reactive protein: a non-invasive marker of alcoholic hepatitis. Scand J
Gastroenterol 2006, 41:1473-1479.
8. Gupta S, Slaughter S, Akriviadis EA, Valenzuela R, Deodhar SD: Serial
measurement of serum C-reactive protein facilitates evaluation in
alcoholic hepatitis. Hepatogastroenterology 1995, 42:516-521.
9. Gonzalez-Quintela A, Mella C, Perez LF, Abdulkader I, Caparrini AM, Lojo S:
Increased serum tissue polypeptide specific antigen (TPS) in alcoholics: a
possible marker of alcoholic hepatitis. Alcohol Clin Exp Res 2000,
24:1222-1226.
10. Hill DB, Marsano L, Cohen D, Allen J, Shedlofsky S, McClain CJ: Increased
plasma interleukin-6 concentrations in alcoholic hepatitis. J Lab Clin Med
1992, 119:547-552.
11. Unlu M, Morgan ME, Minden JS: Difference gel electrophoresis: a single
gel method for detecting changes in protein extracts. Electrophoresis
1997, 18:2071-2077.
12. Byrne JC, Downes MR, O’Donoghue N, O’Keane C, O’Neill A, Fan Y,
Fitzpatrick JM, Dunn M, Watson RW: 2D-DIGE as a strategy to identify
serum markers for the progression of prostate cancer. J Proteome Res
2009, 8:942-957.
13. Ho AS, Cheng CC, Lee SC, Liu ML, Lee JY, Wang WM, Wang CC: Novel
biomarkers predict liver fibrosis in hepatitis C patients: alpha 2
macroglobulin, vitamin D binding protein and apolipoprotein AI. J
Biomed Sci 2010,
17:58.
14. Kondo T, Hirohashi S: Application of 2D-DIGE in cancer proteomics
toward personalized medicine. Methods Mol Biol 2009, 577:135-154.
15. Orenes-Pinero E, Corton M, Gonzalez-Peramato P, Algaba F, Casal I,
Serrano A, Sanchez-Carbayo M: Searching urinary tumor markers for
bladder cancer using a two-dimensional differential gel electrophoresis
(2D-DIGE) approach. J Proteome Res 2007, 6:4440-4448.
16. Keshavarzian A, Farhadi A, Forsyth CB, Rangan J, Jakate S, Shaikh M,
Banan A, Fields JZ: Evidence that chronic alcohol exposure promotes
intestinal oxidative stress, intestinal hyperpermeability and endotoxemia
prior to development of alcoholic steatohepatitis in rats. J Hepatol 2009,
50:538-547.
17. Gentile M, Panico S, Rubba F, Mattiello A, Chiodini P, Jossa F, Marotta G,
Pauciullo P, Rubba P: Obesity, overweight, and weight gain over adult life
are main determinants of elevated hs-CRP in a cohort of Mediterranean
women. Eur J Clin Nutr 2010, 64:873-878.
18. Oda E: CRP may be superior to anthropometric markers of obesity. Circ J
2007, 71:1332, author reply 1332-1333.
19. Martinez VB, Gonzalez-Juanatey JR: Markers of inflammation and
cardiovascular disease: clinical applications of C-reactive protein
determination. Am J Cardiovasc Drugs 2009, 9(Suppl 1):3-7.
20. Ridker PM: Clinical application of C-reactive protein for cardiovascular
disease detection and prevention. Circulation 2003, 107:363-369.
21. Albert MA, Glynn RJ, Ridker PM: Alcohol consumption and plasma
concentration of C-reactive protein. Circulation 2003, 107:443-447.
22. Pepys MB, Hirschfield GM: C-reactive protein: a critical update. J Clin Invest
2003, 111:1805-1812.
23. Das T, Sen AK, Kempf T, Pramanik SR, Mandal C, Mandal C: Induction of
glycosylation in human C-reactive protein under different pathological
conditions. Biochem J 2003, 373:345-355.
24. Laskowska-Klita T, Czerwinska B: [Concentration of C-reactive protein,
procalcitonin and alpha-1-antitrypsin in blood of neonates and infants
with signs of inflammation]. Med Wieku Rozwoj 2002, 6:5-11.
25. Borawski J, Naumnik B, Mysliwiec M: Serum alpha1-antitrypsin but not
complement C3 and C4 predicts chronic inflammation in hemodialysis
patients. Ren Fail 2003, 25:589-593.
26. Cederbaum AI, Lu Y, Wu D: Role of oxidative stress in alcohol-induced
liver injury. Arch Toxicol 2009, 83:519-548.
27. Nanji AA, Zhao S, Lamb RG, Dannenberg AJ, Sadrzadeh SM, Waxman DJ:
Changes in cytochromes P-450, 2E1, 2B1, and 4A, and phospholipases A
and C in the intragastric feeding rat model for alcoholic liver disease:
relationship to dietary fats and pathologic liver injury. Alcohol Clin Exp
Res 1994, 18:902-908.
28. Cao Q, Mak KM, Lieber CS: Cytochrome P4502E1 primes macrophages to
increase TNF-alpha production in response to lipopolysaccharide. Am J
Physiol Gastrointest Liver Physiol 2005, 289:G95-107.
29. Lu Y, Cederbaum AI: CYP2E1 and oxidative liver injury by alcohol. Free
Radic Biol Med 2008, 44:723-738.
30. Naveau S, Cassard-Doulcier AM, Njike-Nakseu M, Bouchet-Delbos L, Barri-
Ova N, Boujedidi H, Dauvois B, Balian A, Maitre S, Prevot S, et al: Harmful
effect of adipose tissue on liver lesions in patients with alcoholic liver
disease. J Hepatol 2010, 52:895-902.
31. Chiellini C, Santini F, Marsili A, Berti P, Bertacca A, Pelosini C, Scartabelli G,
Pardini E, Lopez-Soriano J, Centoni R, et al: Serum haptoglobin: a novel
marker of adiposity in humans. J Clin Endocrinol Metab 2004, 89:2678-2683.
32. Shu H, Kang X, Guo K, Li S, Li M, Sun L, Gan L, Liu Y, Qin X: Diagnostic
value of serum haptoglobin protein as hepatocellular carcinoma
candidate marker complementary to alpha fetoprotein. Oncol Rep 2010,
24:1271-1276.
33. Lee HH, Seo YS, Um SH, Won NH, Yoo H, Jung ES, Kwon YD, Park S,
Keum B, Kim YS, et al: Usefulness of non-invasive markers for predicting
significant fibrosis in patients with chronic liver disease. J Korean Med Sci
2010, 25:67-74.
34. Thabut D, Naveau S, Charlotte F, Massard J, Ratziu V, Imbert-Bismut F,
Cazals-Hatem D, Abella A, Messous D, Beuzen F, et al: The diagnostic value
of biomarkers (AshTest) for the prediction of alcoholic steato-hepatitis in
patients with chronic alcoholic liver disease. J Hepatol 2006, 44:1175-1185.
Liu et al. Journal of Biomedical Science 2011, 18:52
/>Page 9 of 10
35. Pasceri V, Willerson JT, Yeh ET: Direct proinflammatory effect of C-reactive
protein on human endothelial cells. Circulation 2000, 102:2165-2168.
doi:10.1186/1423-0127-18-52
Cite this article as: Liu et al.: Discovery of serum biomarkers of alcoholic
fatty liver in a rodent model: C-reactive protein. Journal of Biomedical
Science 2011 18:52.
Submit your next manuscript to BioMed Central
and take full advantage of:
• Convenient online submission
• Thorough peer review
• No space constraints or color figure charges
• Immediate publication on acceptance
• Inclusion in PubMed, CAS, Scopus and Google Scholar
• Research which is freely available for redistribution
Submit your manuscript at
www.biomedcentral.com/submit
Liu et al. Journal of Biomedical Science 2011, 18:52
/>Page 10 of 10