Báo cáo y học: "Acute nerve compression and the compound muscle action potentia" doc
Bạn đang xem bản rút gọn của tài liệu. Xem và tải ngay bản đầy đủ của tài liệu tại đây (795.85 KB, 9 trang )
BioMed Central
Page 1 of 9
(page number not for citation purposes)
Journal of Brachial Plexus and
Peripheral Nerve Injury
Open Access
Research article
Acute nerve compression and the compound muscle action
potential
Mark M Stecker*
1,2
, Kelly Baylor
2
and Yiumo Michael Chan
2,3
Address:
1
Department of Neurology, Geisinger Medical Center, Danville, PA 17822 USA,
2
Weis Center for Research, Geisinger Medical Center,
Danville, PA 17822 USA and
3
McColl-Lockwood Laboratory for Muscular Dystrophy Research, Department of Neurology, Carolinas Medical
Center, PO Box 32861, Charlotte, NC 28232 USA
Email: Mark M Stecker* - ; Kelly Baylor - ;
Yiumo Michael Chan -
* Corresponding author
Abstract
Detecting acute nerve compression using neurophysiologic studies is an important part of the
practice of clinical intra-operative neurophysiology. The goal of this paper was to study the changes
in the compound muscle action potential (CMAP) during acute mechanical compression. This is the
type of injury most likely to occur during surgery. Thus, understanding the changes in the CMAP
during this type of injury will be useful in the detection and prevention using intra-operative
neurophysiologic monitoring.
The model involved compression of the hamster sciatic nerve over a region of 1.3 mm with
pressures up to 2000 mmHg for times on the order of 3 minutes. In this model CMAP amplitude
dropped to 50% of its baseline value when a pressure of roughly 1000 mmHg is applied while, at
the same time, nerve conduction velocities decline by only 5%. The ability to detect statistically
significant changes in the CMAP at low force levels using other descriptors of the CMAP including
duration, latency variation, etc alone or in conjunction with amplitude and velocity measures was
investigated. However, these other parameters did not allow for earlier detection of significant
changes.
This study focused on a model in which nerve injury on a short time scale is purely mechanical in
origin. It demonstrated that a pure compression injury produced large changes in CMAP amplitude
prior to large changes in conduction velocity. On the other hand, ischemic and stretch injuries are
associated with larger changes in conduction velocity for a given value of CMAP amplitude
reduction.
Background
Intra-operative neurophysiologic monitoring is an impor-
tant clinical tool that provides surgeons with real time
feedback on the integrity of critical neural structures ena-
bling the surgeon to alter the surgical plan if there is a
warning of impending neurologic injury [1,2]. One partic-
ular application involves stimulating a nerve proximally
while continuously recording compound muscle action
potentials (CMAP's) during a surgical procedure that
places the nerve at risk. For this application, it is critical to
Published: 22 January 2008
Journal of Brachial Plexus and Peripheral Nerve Injury 2008, 3:1 doi:10.1186/1749-7221-3-
1
Received: 15 November 2007
Accepted: 22 January 2008
This article is available from: />© 2008 Stecker et al; licensee BioMed Central Ltd.
This is an Open Access article distributed under the terms of the Creative Commons Attribution License ( />),
which permits unrestricted use, distribution, and reproduction in any medium, provided the original work is properly cited.
Journal of Brachial Plexus and Peripheral Nerve Injury 2008, 3:1 />Page 2 of 9
(page number not for citation purposes)
understand the physiology of nerve injuries occurring
over seconds to minutes. Although the interest in the
physiology of hyperacute nerve injury is relatively new,
there has been much study into the changes in peripheral
nerve conduction during compression beginning with the
pioneering studies of Erlanger and Gasser [3]. Despite
these early physiologic studies, most prior work in the
reaction of peripheral nerve to injury has been related to
chronic or subacute injury either by imaging [4-7], clinical
or chronic neurophysiology [8]. A few studies [9-12]
beginning with Causey and Palmer [11] have investigated
the neurophysiologic effects of compression over shorter
time scales. Only one of the above studies has monitored
the CMAP and evaluated changes over the period of sec-
onds important for neurophysiologic monitoring [11]. In
that particular study, however, only CMAP amplitudes
were measured and not changes in the shape of the CMAP
or its latency which are also critical components of neuro-
physiologic monitoring.
The goal of this paper was to study in detail the changes in
the CMAP, reflecting the function of axons of alpha motor
neurons, during hyperacute nerve injury. In particular,
conduction velocities, CMAP amplitudes, CMAP dura-
tion, and the shape of the CMAP were all be studied as
well as the presence of spontaneous electromyographic
(EMG) activity.
Methods
Use of animals
Under a protocol approved by the Weis Research Center
IACUC (#173-06) 16 sciatic nerves from 10 normal male
golden Syrian (F1-B) hamsters were analyzed. Hamsters
were purchased from BioBreeders (Watertown, MA).
These hamsters have a relatively large body size and can
withstand surgical procedures well. All studies were per-
formed under pentobarbital anesthesia (90 mg/kg admin-
istered by intraperitoneal injection).
Recording the CMAP
Recordings of the CMAP were made from the platinum
subdermal needle electrodes (Model E2-48, Astro-Med,
Inc., West Warwick, RI) placed in the muscles of the hind
paw. The sciatic nerve was stimulated proximally at the
spine using similar subdermal needle electrodes placed in
tripolar fashion with 2 mm separation between the elec-
trodes. Stimulation was accomplished with a Grass S88
stimulator connected to a Grass PSIU6 current isolation
unit. Stimulation was increased in the range of 2–15 mA
to assure supramaximal stimulation at the beginning of
the experiment. The duration of each stimulus was chosen
as 0.01 msec.
The signal from the recording electrodes was amplified by
Grass Model 8 amplifiers (Astro-Med, Inc., West Warwick,
RI) with the high frequency filter set at 10 kHz and the low
frequency filter set at 0.3 Hz. The sensitivity was 300
μ
V/
mm. Continuous recordings of spontaneous muscle activ-
ity were amplified and directed to a loudspeaker so that
spontaneous electromyographic activity could be docu-
mented. The signal was digitized using a PCI-6031E 64
channel, 16 bit, 100 kHz data acquisition card (National
Instruments, Austin, TX). Stimulation was performed at a
rate of 5/sec and the average of 20 traces was computed
prior to saving the response. This number of averages was
chosen as a compromise between the noise reduction
associated with additional averaging and the problems of
jitter related distortions in waveform and reduced tempo-
ral resolution for changes in CMAP characteristics associ-
ated with averaging. Thus, CMAP's were recorded every 4
seconds.
The recordings of the CMAP's were integrated with contin-
uous measurements of the hamster's rectal temperature as
well as the output of a Shipmo DFS-1 force gauge
(Shimpo Instruments, Itasca, IL) with a measurement
accuracy of 0.1 g. Software (Measurement Studio from
National Instruments) was used to record annotations in
synchrony with the CMAP recordings and enabled both
manual and automatic marking of the CMAP's.
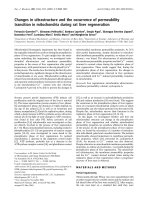
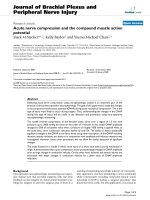
After dissection of the sciatic nerve, a thin metal rod (1.5
mm diameter) was placed under the nerve and secured.
Standard 1.3 mm wide vascular loops were wrapped
around the nerve as shown in Figure 1 in order to cause
compression of the nerve as tension was applied to the
vascular loops. This scheme mimics some types of injury
that might be seen during surgical procedures such as a
clip being placed on a nerve, an instrument inadvertently
Basic setup for the nerve compression studyFigure 1
Basic setup for the nerve compression study.
Journal of Brachial Plexus and Peripheral Nerve Injury 2008, 3:1 />Page 3 of 9
(page number not for citation purposes)
pushing against a nerve or a nerve being trapped against
another structure by a tie or suture.
The compressive force on the nerve increases gradually
with the tension in the loops. This relationship was meas-
ured directly by using known weights to produce s specific
tension in the vascular loops and then using the force
gauge to measure the smallest force required to lift the vas-
cular loop out of contact with the metal rod. A linear
regression was applied to this data to obtain the approxi-
mate empirical relations:
where T is the tension in the vascular loops as measured
by the force gauge, F is the force on the nerve and P is the
pressure on the nerve. It should be noted that the com-
pressed section of nerve is exposed to atmospheric oxygen
throughout the experiment and is unlikely to become
ischemic
Before recording data, the stimulus intensity was adjusted
to obtain a supramaximal stimulus and the recording and
stimulating electrodes were adjusted to obtain a high
amplitude (>500
μ
V) response. The baseline condition
began once all adjustments were complete and the
responses were stable. This was followed by compression
of the nerve corresponding to 20 g tension in the loops for
up to 3 minutes (1
st
compression). The compression was
terminated prior to the 3 minute period if the amplitude
of the CMAP declined more than 50%. This was followed
by a 3 minute recovery period (1
st
recovery) and compres-
sion to 80 g tension in the loops (2
nd
compression).
Again, compression was followed by a 3 minute recovery
time (2
nd
recovery). After this, compression on the nerve
was again instituted and increased until the CMAP disap-
peared (3
rd
compression). This was followed by a 3
minute recovery period (3
rd
recovery). CMAP's were
recorded continuously during the entire period
Statistical analysis
The term latency always refers to the time delay between
the stimulus and the onset of the CMAP and the term
amplitude refers to the maximum peak to peak ampli-
tude. Computation of conduction velocities assumed a
synaptic delay of 0.5 msec [13]. All computed velocities
were corrected to the values corresponding to 37°C
according to the relation derived from an analysis of base-
line latencies:
Latency
corrected
= Latency*e
032*(37-T)
(2)
where T is the rectal temperature at the time of the latency
measurement and the corrected latency is that expected at
37°C.
Four other features of the CMAP are computed, the dura-
tion, the area under the curve (AUC), the mean value of
the CMAP latency and its variance. The duration of the
CMAP is measured as the difference between the time of
the first and last noticeable deflection of the CMAP. Since
the CMAP generally has components above and below
baseline, the area under the curve is computed using
Simpson's rule applied to the absolute value of the CMAP
where t
start
is the shortest time after stimulation at which
reliable data is available and t
stop
is the lastest time for
which a CMAP is present. It is also possible to define the
mean latency of the CMAP,
τ
, and its standard deviation,
τ
s
, using the square of the CMAP amplitude as a weighting
function:
In order to facilitate comparisons between the changes in
the CMAP seen during different experiments, it can be
useful to look at the relative variations in these CMAP
descriptors. In order to do this, the mean value of the
parameter during the baseline (pre-compression) state is
computed and the relative values of the parameter
throughout the remainder of the experiment are com-
puted by dividing the actual value of the parameter by its
mean value in the baseline state. Thus, the relative values
of each CMAP parameter begins at 1.
Of interest from the neurophysiologic monitoring stand-
point was a determination of the time at which the first
statistically significant changes in one of the above dis-
cussed CMAP parameters occurred during the experiment.
A simple method to determine this time involved per-
FT
PT
(.*
.*()
Newtons) (g)
mmHg g
=
()
=
0 004
18 4
(1)
AUC =
∫
Vt dt
t
t
start
stop
()
(3)
t
=
∫
∫
Vttdt
t
start
t
stop
Vtdt
t
start
t
stop
2
2
()
()
(4)
t
t
s
Vtt dt
t
start
t
stop
Vtdt
t
start
t
stop
=
−
()
∫
∫
2
2
2
()
()
(5)
Journal of Brachial Plexus and Peripheral Nerve Injury 2008, 3:1 />Page 4 of 9
(page number not for citation purposes)
forming a repeated measures ANOVA in the normalized
variable under study starting with the first two stages of
the experiment (after the baseline) and then adding suc-
cessive stages to the ANOVA until a statistically significant
effect is noted. This successive ANOVA is not the tradi-
tional approach but it accurately reflects the situation that
occurs in neurophysiologic monitoring where all past
data is used to determine if there has been a significant
change up to the point in question. Because of the
assumptions implicit in the ANOVA, similar computa-
tions were also carried out using the Friedman non-para-
metric ANOVA (Statistica, Tulsa, OK). The only difference
between these two analyzes was that the baseline data
from the normalized variables which could not be
included in the parametric ANOVA because of the absence
of variance were included in this analysis which was based
on ranks. In addition, a t-test was used to compare the val-
ues of CMAP parameters when spontaneous EMG activity
is recorded and when it is not. Spearman rank correlations
and linear regression were used as appropriate to deter-
mine whether there were significant relations between
continuous variables. Statistical significance was taken as
p < .05.
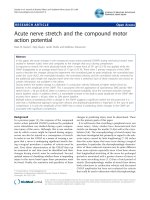
Results
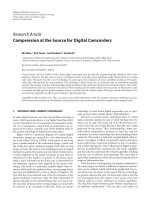
The typical changes in the CMAP during compression of a
single nerve are shown in figure 2. Specifically, figure 2A
shows changes in amplitude while figure 2B documents
the corresponding changes in the CMAP onset latency and
duration. This figure illustrates four common findings
during hyperacute nerve compression. First, compression
to 20 g of tension (P = 370 mmHg) leads to very little
acute reduction in CMAP amplitude (~20%, figure 2A)
while compression to 80 g (P = 1470 mmHg) causes sig-
nificant CMAP amplitude reduction (~60%) but only
minimal CMAP latency increases (figure 2B). Second,
there is considerable variation in the CMAP duration but
durations typically drop as the CMAP amplitude declines.
Third, the CMAP amplitude during the recovery period
may exceed that prior to compression. Fourth, at the high
pressure levels (>80 g) used in this study, there are very
rapid responses to compression.
Knowing these general properties, it is useful to look at the
responses in the entire group of studied nerves. The CMAP
amplitude is reduced by 50% for the first time during
compression at a tension T = 52.7 g (std 22.7, min 18, max
79) corresponding to a mean pressure of 970 mmHg. The
AUC for the CMAP is strongly correlated with the peak to
peak amplitude. Linear regression of the normalized AUC
on the normalized amplitude yields a slope of 0.95 (+/-
.008) with R
2
= .74. As expected, the AUC drops to 50% at
a tension T = 54.4 g (P = 1001 mmHg), similar to the ten-
sion at which the CMAP amplitude drops to 50% of base-
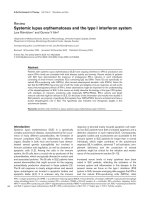
line. Figure 3A shows the mean changes in amplitude and
AUC during each phase of the experiment averaged over
all nerves. The CMAP amplitude and AUC reductions first
reach statistical significance during the phase in which the
nerve is subjected to compression at a tension of 80 g. Fig-
ure 3B shows the mean changes in velocity and duration
of the CMAP during cycles of compression and recovery.
Nerve conduction velocity changes minimally until levels
of compression significant enough to reduce the CMAP
amplitude to less than 20% of its initial value are attained.
Although small, the 5% reduction in conduction velocity
seen during the 80 g compression is statistically signifi-
cant. Figure 3B also confirms the decline in CMAP dura-
tion during compression. There is much variability in this
measure and significant differences are not seen until the
terminal compression phase. Figure 3C demonstrates that
the CMAP onset and mean latency, do not change signifi-
cantly during the early phases of compression. Significant
change is only observed at the terminal compression
phase. Although the latency variance does increase during
compression and decrease during recovery, this effect does
not reach statistical significance until the terminal com-
pression phase. We also investigated whether any combi-
nation of the above parameters show statistically
significant changes earlier in the experiment. These
included products of the primary parameters discussed
earlier in such combinations as amplitude*velocity,
amplitude*velocity*duration, amplitude*velocity*
τ
s
.
However, none of these derived parameters showed statis-
tically significant changes in the CMAP at an earlier point
than either the CMAP amplitude or velocity alone. It
should be noted that similar results were obtained using
both the parametric and non-parametric ANOVA testing.
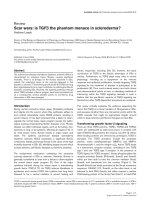
In all cases where a CMAP was recordable, the maximum
velocity was never less than half of its initial value. In
order to better elucidate the changes in the CMAP, figures
4 and 5 show the normalized CMAP velocity and CMAP
duration respectively from each recorded potential as a
function of the normalized CMAP amplitude. In both of
these cases, no change in the measured parameters greater
than 10% occurs until the CMAP amplitude is reduced by
over 80%. Similar effects of the mean latency and latency
variance are noted.
An examination of the behavior of individual nerves
shows that the CMAP amplitude returns to baseline or
above in 9/16 nerves in the recovery period after the 1
st
compression (20 g) while 16/16 achieved amplitudes
>30% of baseline. After the 2
nd
(80 g) compression, only
4/16 nerves returned to baseline amplitude and 10/16
reached amplitudes greater than 30% of baseline. After
the 3
rd
compression, during which the tension was
adjusted to make the CMAP disappear, 0/14 nerves
achieved an amplitude >30% of baseline during the recov-
ery period. Thus, the ability to recover is better after com-
Journal of Brachial Plexus and Peripheral Nerve Injury 2008, 3:1 />Page 5 of 9
(page number not for citation purposes)
CMAP parameters and nerve compression tension as a function of time during a typical nerve compression experimentFigure 2
CMAP parameters and nerve compression tension as a function of time during a typical nerve compression experiment. (A)
Changes in CMAP amplitude and CMAP waveform. (B) Changes in CMAP onset latency and duration. In both cases, the applied
force is shown on the right y-axis and the CMAP parameter value on the left y-axis.
Journal of Brachial Plexus and Peripheral Nerve Injury 2008, 3:1 />Page 6 of 9
(page number not for citation purposes)
(A) Changes in amplitude and area under the curve at various points during the compression and recovery cyclesFigure 3
(A) Changes in amplitude and area under the curve at various points during the compression and recovery cycles. (B) Changes
in nerve conduction velocity and CMAP duration during the various stages of nerve compression. (C) Changes in CMAP onset
latency, mean latency and latency variance during nerve compression and recovery. The data in this figure represent averages
over all nerves. In each case, the error bars represent 95% confidence intervals or roughly 2 standards errors of the mean
above and below the central value.
Journal of Brachial Plexus and Peripheral Nerve Injury 2008, 3:1 />Page 7 of 9
(page number not for citation purposes)
pressions that cause smaller declines in CMAP amplitude.
Despite the minor changes seen in velocity, only 44% of
nerves recovered to equal or better velocity after the 1
st
compression at 20 g, 29% after the 2
nd
compression at 80
g and 0% after the final compression.
In order to determine if the degree of CMAP amplitude
reduction during low level compression predicted the
degree of CMAP reduction with higher level compression,
a Spearman rank correlations is performed. The degree of
reduction in the CMAP amplitude during the 1
st
compres-
sion to 20 g is positively and significantly correlated with
the CMAP amplitude during the 2
nd
compression to 80 g
(Spearman R = 0.5, p < .05) However, there is no signifi-
cant relation between the reduction in amplitude during
the 1
st
compression and the CMAP amplitude during
recovery from 80 g compression (Spearman R = 0.275, p
> .05). There is also no significant correlation between the
CMAP amplitude reduction during the 1
st
compression
and CMAP amplitude reduction during the final recovery.
The degree of reduction in velocity during the 1
st
compres-
sion is positively correlated (Spearman R = 0.77, p < .01)
with the degree of velocity reduction during the 2
nd
com-
pression but not with velocity during the recovery period.
On the other hand, there are positive but statistically
insignificant correlations between the changes in velocity
during the 1
st
compression to 20 g and the amplitude
reductions during the 2
nd
compression to 80 g.
Trains of spontaneous EMG activity are more commonly
recorded when the CMAP amplitude is significantly
reduced from baseline. The normalized CMAP amplitude
when there was no spontaneous EMG activity was 0.657
while the mean amplitude was 0.36 when spontaneous
EMG activity was seen (t = -2.65, p < .01, N = 3897). The
CMAP duration was also shorter when spontaneous EMG
was recorded (0.989 vs 0.82 p < .01 t = -2.65, N = 3897)
than when it was not. There was no effect of the rate of
CMAP change on the appearance of spontaneous EMG
activity.
Discussion
This study has demonstrated that the uniform response to
mild to moderate hyperacute nerve compression over very
short distances (1.3 mm) is characterized by marked
reduction in the CMAP amplitude with relatively small
but significant reductions in CMAP velocity. Only at levels
of compression that reduce the CMAP amplitude by more
than 80% are nerve conduction velocities reduced by as
much as 30–50% and the duration of the CMAP markedly
shortened. This reduction in duration could be seen with
preferential loss of either more rapidly or more slowly
conducting axons. However, the concomitant reduction
in nerve conduction velocity suggests that larger axons are
preferentially affected. This conclusion is also supported
by the fact that larger axons are associated with larger
motor units with longer durations so that loss of these
larger axons should produce shorter duration CMAP's by
this mechanism as well. At first, this might seem to con-
flict with the data of Battista and Albans [14] who found
that acute nerve compression over small lengths of nerve
(1 mm) produced injury to slow conducting C fibres
before changes in rapidly conducting myelinated axons,
while compression over larger lengths (1.2 cm) affected
myelinated axons at lower compressions than C fibres.
Changes in relative CMAP duration as a function of relative CMAP amplitudeFigure 5
Changes in relative CMAP duration as a function of relative
CMAP amplitude.
Changes in relative CMAP velocity as a function of relative CMAP amplitudeFigure 4
Changes in relative CMAP velocity as a function of relative
CMAP amplitude. In each case, relative CMAP values are
derived from the raw measured values of that parameter by
dividing the raw values by the mean value of the given param-
eter in the baseline state.
Journal of Brachial Plexus and Peripheral Nerve Injury 2008, 3:1 />Page 8 of 9
(page number not for citation purposes)
Since the CMAP does not probe the slowly conducting C
fibres, the results obtained in this paper refer only to rap-
idly conducting myelinated axons of alpha motor neu-
rons.
It should be noted that the changes in CMAP amplitude
and velocity in this model are very different than those
observed during ischemia or nerve stretch [15]. In both of
these models there are large increases in latency and
reductions in conduction velocity associated with reduc-
tions in CMAP amplitude of less than 50%. For example,
in the stretch model [15], the conduction velocity
decreased 30% when the amplitude was reduced by 50%.
In studies that aimed to investigate the effects of ischemia
on nerve action potential [16], CMAP [17], and evoked
potential [18], it was found that 50% reduction in CMAP
amplitude was sufficient to elicit a 20% reduction in nerve
conduction velocity, which is again larger than seen in this
study. This difference is expected since the region of nerve
that might have abnormal conduction velocity is quite
substantial in both the ischemia and the stretch models
but is tiny in the compression model used in this study.
For example, a 50% reduction in conduction velocity
across the injured region would cause a 50% reduction in
the CMAP conduction velocity if the entire nerve was
involved. If only 5% of the length of the nerve were
involved (as in our study), there would be only a 5%
reduction in the measured conduction velocity. Thus,
when monitoring for acute focal compressions, small
reductions in the conduction velocity can be clinically sig-
nificant even though in clinical diagnostic studies of
chronic injuries such as carpal tunnel or ulnar neuropathy
the criteria for a significant change in conduction velocity
is generally a change of at least 10–20%.
Another finding of interest is that higher pressure levels
are required to produce significant reductions in the
CMAP amplitude when the compression (1000 mmHg) is
applied over only 3 minutes than when the compression
(200 mmHg) is applied over a longer period of 20 min-
utes [11]. This difference is consistent with the observa-
tion made by Dyck [6] that the changes in fasicular area
during compression show a biphasic curve with initial
rapid declines over the first few minutes that were attrib-
uted to expression of endoneurial fluid followed by
slower changes most consistent with the compression of
axonal components. This suggests that over short time
periods the endoneurial fluid may function as a "shock
absorber" that reduces the chance of axonal injury from
compression.
From the clinical standpoint, these results are also signifi-
cant. They provide clinicians with another tool to deter-
mine based on relative amplitude and velocity changes
whether changes in CMAP are due to ischemia or com-
pression. In addition, it may support the observation of
Quinones-Hinojosa [19] that significant changes in the
transcranial motor evoked potentials (which bear some
similarities to CMAP's recorded after stimulation of motor
axons in the cortical and subcortical areas) are associated
with shortened durations of the recorded CMAP. In this
study, large changes in duration occurred only in the set-
ting of significant compression. However, in the clinical
arena, with the many problems involved in obtaining
high quality recordings, it important and critical to corre-
late the changes in multiple variables simultaneously in
order to confirm the presence and nature of significant
changes in the CMAP. Although, in this study, correla-
tions of changes in multiple variables including the mean
CMAP latency and the CMAP latency variance did not
help detect statistically significant changes at an earlier
point, they would be useful in confirming the presence of
significant changes.
It is also clinically significant that the changes in response
of a nerve to a low level of compression do, to some
extent, predict the response of that same nerve to a larger
compression. This suggests that the possibility that varia-
bility in recorded CMAP amplitudes during a surgical pro-
cedure might be in part a predictor of increased
vulnerability to injury.
One caveat to the use of continuous CMAP recording is
that, although the CMAP is high in amplitude and thus
easy to monitor, changes in the CMAP can be more diffi-
cult to interpret than changes the in the nerve action
potential. This is primarily a result of the complex time-
dependent effects of prolonged stimulation on facilitation
and fatigue at the neuromuscular junction and the muscle
[20,21]. The complexities of these phenomena are evident
in this study. In particular, each experiment was not initi-
ated until the amplitude of the CMAP reached a relatively
stable value after the onset of continuous stimulation.
This occurred over a period of a few minutes and resulted
in a CMAP with an amplitude somewhat less than the
maximal value. During low levels of compression, certain
nerve fibres become temporarily non-conducting so that
some neuromuscular junctions and muscle fibres are not
stimulated. Thus, during the recovery period, when func-
tion in these fibres return, the neuromuscular junctions
have had the opportunity to return toward baseline func-
tion and CMAP amplitudes greater than baseline are
noted. Of course, at higher levels of compression where
nerve fibres are injured to the point where there is no
return of function, this phenomenon is not observed.
Competing interests
The author(s) declare that they have no competing inter-
ests.
Publish with BioMed Central and every
scientist can read your work free of charge
"BioMed Central will be the most significant development for
disseminating the results of biomedical research in our lifetime."
Sir Paul Nurse, Cancer Research UK
Your research papers will be:
available free of charge to the entire biomedical community
peer reviewed and published immediately upon acceptance
cited in PubMed and archived on PubMed Central
yours — you keep the copyright
Submit your manuscript here:
/>BioMedcentral
Journal of Brachial Plexus and Peripheral Nerve Injury 2008, 3:1 />Page 9 of 9
(page number not for citation purposes)
Authors' contributions
MMS helped design the compression protocol, developed
the data collection software, participated in the compres-
sion experiments, the data analysis and writing the manu-
script. KB participated in data collection, primarily
performed the compression experiments, and participated
in the data analysis and checking the manuscript. YMC
helped conceive of the study, provided animals for the
study, and participated in drafting the manuscript. All
authors read and approved the final manuscript.
Acknowledgements
This study was sponsored by grants from the Muscular Dystrophy Society
and by Geisinger Health System to Yiumo Chan
References
1. Moller AR: Intra-Operative Neurophysiologic Monitoring.
Humana Press (Totowa NJ); 2005.
2. Happel L, Kline D: Intra-Operative neurophysiology of the
peripheral nervous system in Neurophysiology in Neurosur-
gery: A Modern Intraoperative Approach (Deletis V and
Shils J eds). Academic Press; 2002.
3. Gasser HS, Erlanger J: The role of fibre size in the establishment
of a nerve block by pressure or cocaine. American Journal of Phys-
iology 1929, 88:581-591.
4. Ochoa J, Fowler TJ, Gilliatt RW: Anatomical changes in periph-
eral nerves compressed by a pneumatic tourniquet. J Anat
1972, 113:433-455.
5. Powell HC, Myers RR: Pathology of experimental nerve com-
pression. Lab Invest 1986, 55:91-100.
6. Dyck PJ, Lais AC, Giannini C, Engelstad JK: Structural alterations
of nerve during cuff compression. Proc Nat Acad Sci 1990,
87:9828-9832.
7. Ochoa J, Marotte L: The nature of the nerve lesion caused by
chronic entrapment in guinea-pig. J Neurol Sci 1973, 19:491-495.
8. Omura T, Sano M, Omura K, Hasegawa T, Nagano A: A mild acute
compression induces neurapraxia in rat sciatic nerve. Interna-
tional Journal of Neuroscience 2004, 114,12:1561-1572.
9. Szabo RM, Sharkey NA: Response of peripheral nerve to cyclic
compression in a laboratory rat model. J Orthop Res 1993,
11:828-833.
10. Rydevik B, Nordborg C: Changes in nerve function and nerve
fibre structure induced by acute, graded compression. J Neu-
rol Neurosurg Psychiatry 1980, 43(12):1070-82.
11. Causey G, Palmer E: The effects of pressure on nerve conduc-
tion and nerve fibre size. Journal of Physiology 1949, 109:220-231.
12. Fern R, Harrison PJ: The effects of compression upon conduc-
tion in myelinated axons of the isolated frog sciatic nerve. J
Physiol 1991, 432:111-122.
13. Katz B, Miledi R: The effect of temperature on the synaptic
delay at the neuromuscular junction. J Physiol 1965,
181:656-670.
14. Battista AF, Alban E: Effect of graded ligature compression on
nerve conduction. Exp Neurol 1983, 80:186-194.
15. Li J, Shi R: Stretch induced nerve conduction deficits in guinea
pig ex vivo nerve. J Biomechanics 2007, 40:569-578.
16. Fox JL, Kenmore PI: The effect of ischemia on nerve conduc-
tion. Exp Neurol 1967, 17:403-419.
17. Hansson S: The association between nerve conduction veloc-
ity and compound motor action potential amplitude during
ischemic blocking. Electromyogr Clin Neurophysiol 1999,
39:113-122.
18. Yamada T, Muroga T, Kimura J: The effect of tourniquet induced
ischemia on somatosensory evoked potentials. Neurology
1981, 31:1524-1529.
19. Quinones-Hinojosa A, Lyon R, Zada G, Lamborn KR, Gupta N, Parsa
AT, McDermott MW, Weinstein PR: Changes in transcranial
motor evoked potentials during intramedullary spinal cord
tumor resection correlate with postoperative motor func-
tion. Neurosurgery 2005, 56:982-993.
20. Zucker RS, Regehr WG: Short term synaptic plasticity. Ann Rev
Physiol 2002, 64:355-405.
21. Enoka RM, Rankin LL, Stuart DG, Volz KA: Fatigability of rat hind-
limb muscle: associateions between electromyogram and
force during a fatigue test. J Physiol 1989, 408:251-270.