Coatings of Polymers and Plastics Part 10 potx
Bạn đang xem bản rút gọn của tài liệu. Xem và tải ngay bản đầy đủ của tài liệu tại đây (404.85 KB, 25 trang )
214 Schoff
F
IG
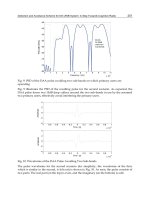
.9 Solvent popping. (From Ref. 5, used with permission.)
pores in the plastic, although other gases may be involved. To reduce or prevent
this defect, it is necessary to use a primer that seals the SMC surface well.
Gassing or blowout is possible over other plastics as well. Any product that has
bubbles and pores, especially close to the surface, has a potential for this defect.
Another volatile-related defect, air entrapment, is a problem for many coatings.
Agitation during manufacture, handling, or application may cause air to mix in
or dissolve in the paint. On application, the air tries to leave the film, but often
is trapped or the bubbles break late in the film formation process so that holes
are left that do not flow out. The result often is difficult to distinguish from
solvent pops or gassing.
A defect that I have seen a number of times on painted plastics is what I
call micropopping (Fig. 12). Very small (0.4–2 mils or 10–50 µm in diameter)
bubbles, bumps, or pinholes appear in the film, often late in the bake. To the eye,
the result may look like haze, give fuzzy reflections or just an appearance that
does not look right. The cause may be trapped solvent, volatile by-products of the
curing process, or even clumps of flow-control agent or pigment. Micropopping
coupled with bumpiness that often occurs on shrinkage during cure can turn a
smooth glossy surface (when wet or early in the bake) into a rough ugly one.
Painting Problems 215
F
IG
.10 Gassing from a plastic substrate. Note the hole in the center of the defect.
3.4 Flow-Related Defects
A number of the defects described previously involve flow driven by surface
tension, but there also are flow defects where surface tension has little or no
involvement. When a paint is applied, it is expected to flow out and level to
produce a smooth film. Unfortunately, this does not always happen. Sometimes
the viscosity is so high when the paint arrives on the part or increases so quickly
after application that there is little flow and the result is a rough, bumpy surface
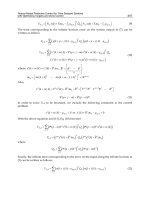
F
IG
.11 Diagram of the cross section of a gassing defect. (From Ref. 5, used with
permission.)
216 Schoff
F
IG
.12 Example of micropopping. Perhaps, microbumps is a more accurate de-
scription in this case. To the eye, the effect is one of fuzziness of reflections.
like the peel of an orange (Fig.13). In base/clear systems, the clear usually is
blamed for orange peel, but a basecoat with poor flow can cause this as well.
This usually is due to telegraphing of the basecoat topography so that the clear
really is bumpy, but I have seen cases in which there was an optical illusion
where clear was smooth, but the rough basecoat showed through. If the paint
viscosity is too low after application or too much is applied, the paint may flow
too well on vertical surfaces (particularly at holes or style lines), causing ugly
sags, runs, and slumps. Even if thicker areas are not considered objectionable
to the eye, popping may occur in them.
3.5 Other Defects
3.5.1 Dirt
The most common defect of all is dirt. This defect rarely is a concern to formu-
lators, yet is a serious problem in most plants where their paints are applied.
Most dirt comes from the paint user’s facility. Occasionally, the dirt is in the
paint as it arrives in the plant and sometimes pigment flocs or seeds form during
Painting Problems 217
F
IG
.13 Orange peel as seen through the microscope.
the circulation of the paint, but both of these are rare compared to dirt from the
plant and the people who work in it.
There are many different kinds of dirt such as fibers (Fig. 14), sanding
dust, resin gel particles, dried paint particles and chips, oven dirt (Fig. 15), rust,
etc. Dirt sources include clothing; wiping cloths; tack rags; gloves; faulty or
clogged filter bags that break; overhead chains and carriers; racks and hangers;
ovens; compressed air for application; food (eating in the booth); dried paint in
pipes and hoses; roof leaks; rust and flaking paint in booths and tunnels; hoses
that are disintegrating, etc. Road and construction dust, truck and locomotive
exhaust, pollen, insects, fly ash, soot, and other particulates may enter from
outside the plant. Sometimes plant exhaust and inlet pipes are positioned so that
plant exhaust is pulled back into the paint shop or paint area when the wind
blows in a certain direction. Poor work practices such as playing around on the
paint line, the wearing of nonapproved gloves and clothing, sprayers not wear-
ing gloves, use of booths as passageways, and careless tacking and wiping all
can cause dirt or make it worse. Some defects that look like dirt really are due
to application problems. Examples are spits, drops, and overspray. Worn, dam-
218 Schoff
F
IG
.14 Dirt—an example of a fiber.
aged, or dirty application equipment; too much shaping or fan air; excessive
paint flow rates; excessive voltage; and loose or overtightened caps and nozzles
all can cause “dirt.”
3.5.2 Color Problems
Color is a surface attribute, but a coating being the wrong shade is not a surface
defect in the usual sense. Color matching of coated parts made of different
plastics or of metal and plastic can be very difficult. In an auto plant, the plastic
always is expected to match the painted steel, but I have been on lines where it
turned out that the original equipment manufacturer (OEM) coating was the
wrong color, not the one on the plastic parts. Color can be affected by film
thickness, by the method of application, whether there is pigment flocculation
or not, etc. A batch of paint may be the correct color to begin with, but on
circulation, the pigment may slowly flocculate causing the color to drift. A
similar thing can happen with aluminum flake in a metallic paint. The parts
become darker with paint circulation time as the flake clumps together and no
longer reflects light. Sometimes an off color is caused by a colored impurity,
usually yellow or pink. This may be in the paint or reducing solvent or may
Painting Problems 219
F
IG
.15 An example of oven dirt.
migrate up from the plastic or another coating layer. Amines and various addi-
tives, including UV absorbers, have been blamed for such problems.
4 FIELD PROBLEMS/FAILURES
Field failures may seem to be completely different from painting problems, but
they may be connected to a greater extent than we realize. An excellent source
of information in this area is Ref. 20. The author points out that for a coating
to fail, it must be stressed. How it responds to this stress depends on the physical
and mechanical properties of the coating and its interface with the substrate.
These, in turn, depend on the chemistry of the coating and the degree of cure,
but may also be affected by the application process, defects in the coating, or
repairs to defects. Let us consider some field failures.
4.1 Adhesion
The most serious problem in paint for plastics is loss of adhesion to the plastic.
Paint is useless if it does not stick. Adhesion failure may occur soon after appli-
220 Schoff
cation or may occur later in the field. The failure may involve very small areas
or very large ones. A high stress such as scraping may be necessary or the paint
may sheet off seemingly with little or no force. As far as a paint user is con-
cerned, a failure is a failure regardless of the magnitude, timing, or force that is
needed. However, these differences are very significant to someone who solves
problems. For example, failure after some period of time or failure with little
stress may mean that a plastic component or additive has migrated to the plastic-
coating interface giving an intermediate layer. This weak boundary layer will
interfere with the plastic-coating bond, yet will have little or no cohesive
strength of its own, so adhesion failure occurs.
What does it take to achieve good adhesion? The first requirement is inti-
mate contact between two surfaces. This is where wetting comes in. However,
wetting is a necessary, but not sufficient condition for good adhesion of a dried
or baked coating. In fact, there are paints that wet surfaces very well, but are
designed to be temporary and that can be peeled off easily once they are baked
and cured. Wetting does involve adhesion of the liquid paint to the substrate,
but loss of solvent and other changes may destroy this bonding. The second
requirement is that one material must adsorb on the other. In order to do this,
they must be highly compatible with each other. There is an old adage that “like
dissolves like.” We also can say that “like wets like” and “like adheres to like.”
The third requirement is that there be polar groups on both materials to aid in
the formation of adhesive bonds. There is evidence in the literature (21–23) that
matching the polarities of the cured paint and the substrate contributes to good
adhesion. This explains why polar coatings do not stick very well to nonpolar
or low polarity plastics. Adhesion promoters are based on the concept of linking
unlike materials by having a two-faced layer that shows one face to the nonpolar
plastic and a very different face to the polar paint. This works even better if the
promoter solvents swell the plastic and allow penetration by the polymer chains
in the promoter.
Adhesion failures over plastics sometimes only occur in certain places on
parts, such as on the corners of bumpers or in the area of the mold gate. Analysis
has shown that these areas have different compositions or different degrees of
crystallinity from the rest of the surface of the part. This can be due to tempera-
ture differences in the mold, imperfect mixing, or different stresses and strains
during filling and cure.
One possible cause of adhesion loss is degradation of the surface of one
of the intermediate layers (primer, adhesion promoter) or the plastic by ultravio-
let light. It only takes a small amount of degradation at an interface to hurt
adhesion. The topcoats are supposed to protect the layers below, but thin clear-
or basecoat films, low pigment loadings, and loss of UV absorbers can allow
UV transmission. Pigments provide UV protection by blocking out the light and
Painting Problems 221
many also absorb UV. Additives are used to absorb UV light and change the
energy to heat energy or act as free radical scavengers.
4.2 Mar and Scratch
The terms mar and scratch refer to surface damage due to contact with sharp
or rough objects. There is general agreement that a scratch is a mark or injury
produced on a surface by something that is sharp or has a ragged edge. It often
involves fracture of the surface. Unfortunately, the term mar is not well defined
and means different things to different people. It may be used to refer to any
surface damage or only to certain kinds such as abraded or off-color spots or
areas. Damage can occur in many places. Painted parts are exposed to a number
of possible scratch and abrasion situations even before they become part of a
car, piece of equipment, or other object. Handling, packaging, storage, and ship-
ping all are operations that can result in damage. This is compounded by the fact
that many coatings take time to develop resistance and may be easily scratched
immediately after painting. During use there are many additional dangers for
the surface. Fortunately, unless they are undercured, coatings for plastics tend
to be tough and flexible and most have reasonably good scratch resistance after
their initial tenderness. The surface often deforms instead of fracturing and the
resultant indentation or groove can heal, especially in warm weather.
4.3 Friction-Induced Damage (Gouging)—Bump
and Rub Impacts
A type of defect that occurs on painted thermoplastic olefin (TPO), particularly
on auto bumpers is damage that occurs when the bumper rubs against a post,
wall, or other immovable object. A strip of coating shears off along with the
top layer of the TPO. Resistance to such damage does not seem to be related to
the adhesion between the coating and the substrate, but rather to the cohesion
between the surface layer and bulk of the TPO.
4.4 Stone Chipping
Cars and trucks are continually bombarded by stones thrown up by their own tires
and those of vehicles in front of them or passing them. Many parts of North
America have gravel roads and/or gravel shoulders on paved roads. Even paved
roads can have loose material. Some vehicle designs (sloping hoods, tires that
stick out beyond fenders, lack of mudguards or protective coverings at the back
of fender cutouts, etc.) invite damage. Considering all of this, stone chipping is a
surprisingly minor problem and coated plastics suffer far less than coated metal.
Resistance to stone chipping depends on having a combination of excellent adhe-
222 Schoff
sion of all layers, good mechanical properties, and the ability to absorb much of
the energy of the stone as it strikes the surface. Plastics tend to give with the
impact, whereas metals do not. Damage is possible, but warranty claims and cus-
tomer complaints are rare, so there is less concern than with other defects.
5 TOOLS
A worker needs tools and so does a coatings problem solver. By tools, I mean
principles and techniques as well as instruments. Many tools are available and
I will discuss a number of them.
5.1 General Tools
5.1.1 Light Microscope
This is the most useful single piece of equipment for solving defect problems.
It is good to use two of them, a low power (5–100X) stereo microscope for
looking at defects and a higher power (100–1000X) one for cross sections,
examining wet paint, etc. Microscopes should be connected to still or video
cameras for documentation of what is seen. Video cameras can be used to print
still pictures (using a videoprinter) or videotape the baking process and the
formation of defects. Addition of a capture board and image analysis software
enables the investigator to take and store pictures, insert them into documents,
send them by email, etc.
5.1.2 Root Cause Analysis Methodology
Root cause analysis involves the determination of the basic or underlying cause
of a defect or problem and the providing of evidence that it is the cause. We
know that craters are caused by contaminants, but the root cause of a cratering
outbreak may be poor tote cleaning, a contaminated drum, overreduction of the
paint so that it flows too much, or a batch of paint that is unusually sensitive to
contaminants that always are present. It may be clear that a defect is a solvent
pop, but the root cause could be an application problem that causes fat edges or
sags that, in turn, lead to pops. Root cause analysis often takes a lot of detective
work, experimentation, and documentation. Sometimes it takes longer than it
did to solve the problem. The point is that if the true root cause has been identi-
fied and removed or fixed, the problem or defect should not occur again.
5.1.3 Regular Audits
Audits for dirt, craters, to measure whether improvements have occurred,
whether best practices are being followed, condition of application equipment,
whether there is oil in the compressed air, etc. are very important for reducing
and ultimately preventing painting problems. Such audits should be done on a
Painting Problems 223
regular basis and ratings should be done against standards. Audits can and
should be incorporated into ISO 9000 or other quality process methodology.
Self-auditing by teams or departments is important and useful, but exchange
audits by people from other plants or parts of an organization also should be
done.
5.2 Tools for Characterizing Wetting and Wettability
5.2.1 Wetting Tests
The main technique for investigating wetting problems is the measurement of
the contact angle of a specific liquid or liquids on the surface of interest. This
normally is an advancing angle, that is, during formation the drop advances
across the surface. The receding contact angle where a drop retracts over a
previously wetted surface would seem to be more useful for characterizing de-
wetting phenomena, but it is rarely measured in the coatings industry.
Critical Surface Tensions. Much wettability testing owes its basis to Zis-
man and his critical surface tension of wetting (24,25). The contact angles of
various liquids (often a homologous series of hydrocarbons) on the surface are
determined and the contact angles are plotted versus the surface tensions of the
liquids (see Fig. 16). The plot is extrapolated to cos θ=1, that is, θ=0°, which
represents the point where the liquid would just spontaneously spread if applied
as a drop. This point defines the critical surface tension, γ
c
. As long as the
F
IG
.16 Critical surface tension (Zisman) plot for wettability of polytetrafluoroethy-
lene by n-alkanes (25). The parameter γ
c
is the critical surface tension. (From Ref.
5, used with permission.)
224 Schoff
surface tension of the paint is below the critical surface tension of the substrate,
the paint will spontaneously wet the surface and spread over it. Zisman plots
have long been useful in predicting or explaining wetting problems. Table 1
lists critical surface tensions of a number of different kinds of substrates, includ-
ing many plastics (4,26,27).
It should be pointed out that a 0° paint contact angle (paint surface ten-
sion < critical surface tension) is not an absolute requirement for good perfor-
mance. The Zisman analysis deals with a drop on a smooth surface, whereas
painting involves a film or layer that has been applied forcibly to a relatively
T
ABLE
1 Critical Surface Tensions from Zisman Plots
Substrate Critical surface tension,
γ (dynes/cm)
Untreated steel 29–30
Fe phosphated steel 43
Zn phosphated steel 45–56
Treated aluminum extrusions 33–35
Tin-plated steel 35
Azdel 817 polypropylene/FG 21
Bayflex 110-25 (unfilled) polyurethane 26
Bayflex 110-50 polyurethane 16
Capron nylon 6 31
Cycolac GPM-5600 ABS 27
Cycoloy C-2950 ABS 20
Dow Magnum 344HP ABS 32
Dow Pulse 830 ABS/polycarbonate 28
Dow Spectrum 50 polyurethane (unwashed) 17
(power washed) 31
(power washed/solvent wiped) 33
GTX Nylon-PPO Alloy 32
Lexan FL-900 polycarbonate 32
Lexan LS2 polycarbonate 24
Noryl FN215 PPO 28
SMC styrene-polyester (untreated, unwashed) 15–25
(power washed, solvent wiped) 36–41
TPO Bailey 3183 24
TPO Himont 3041C, 3131, 3183 23–24
TPU/Estane 23
TESLIN 28
Xenoy 1102U polycarbonate/polyester 27
Xenoy 2230 EU 20
Source: Refs. 4, 27.
Painting Problems 225
rough surface. Good wetting and adhesion can occur with contact angles consid-
erably above 0°. However, it is a good idea to try to keep the contact angle as
low as possible. Most automotive paints have surface tensions of 25–30 dynes/
cm, so substrate critical surface tensions should be above 30 dynes/cm, prefera-
bly above 35.
Some of the plastics listed in Table 1 have very low critical surface ten-
sions and would be difficult to wet, whereas others have relatively high surface
tensions and should be wettable by many paints. The two examples of the effect
of cleaning (Dow Spectrum and SMC) show considerable increases in critical
surface tension and, therefore, wettability. It should be pointed out that most of
these critical surface tensions are like snapshots in time. Unless a range is given,
each value is for a given specimen from a given batch of parts or plaques made
at a certain time. Different mold conditions, cleaning or the lack of it, and other
variables could greatly affect the result (and the wettability).
Contact angles of single liquids sometimes are used to characterize sur-
faces. For example, Cheever (28) used water contact angles to differentiate be-
tween surface regions of polyester-styrene SMC automotive moldings. By mak-
ing a large number of measurements across the surface, a contact angle map
was generated. Cheever was able to estimate the components present on the
surface and relate wettability to coating peel strength. Results correlated with
mold and temperature effects. Water contact angles also have been used to test
surface cleanliness after cleaning operations, ease of wettability by waterborne
paints, and the effectiveness of rinsing processes. Another useful single liquid
for testing is the paint itself. Comparison of contact angles of different paints
or formulations on a substrate of interest can be used for problem solving or
optimizing a formulation for wetting.
Solid Surface Tensions. Zisman plots are very useful, but, in a number
of cases, other techniques seem to explain wettability differences between sur-
faces better (4,5,26,29,30). Solid surface tension (SST) models that take into
account the polarity of surfaces have turned out to be effective. A model that I
like is the Owens-Wendt-Kaelble (O-W-K) relationship (31,32), which uses two
components (dispersion and polar) such that SST,
γ
s
=γ
d
s
+γ
p
s
Contact angles are measured with two liquids (e.g., water and methylene iodide)
and values are substituted into the Owens-Wendt-Kaelble equation (4,5,26,31,32)
γ
l
(1 = cos θ)/2 = [(γ
d
l
γ
d
s
)
1/2
+ (γ
p
l
γ
p
s
)
1/2
]
where γ
l
is the surface tension of the test liquid and γ
s
is the surface tension of
the solid in question. An equation is written for each liquid. All the quantities
are known except γ
d
s
and γ
p
s
, the dispersion and polar components of the SST.
226 Schoff
We are left with two equations in two unknowns and these can be solved to
give the unknown values. The dispersion and polar components are then added
together to give the total SST. The polarity also can be expressed as a percent
of the total surface tension or as the fraction. Table 2 lists some SSTs along
with the dispersion and polar components and also the percent polarity for a
number of relatively pure polymers (data from our laboratory). They are listed
in decreasing order of total SST. Extensive tables of polymer surface tensions
may be found in reference 33. Table 3 (27) lists surface parameters for a number
of substrates, mainly plastics.
The first six polymers in Table 2 have moderate-to-high SSTs and would
be expected to be wettable. The seventh one, poly(vinyl fluoride), might be
borderline for wetting by some paints. That polymer and the next three listed
show the effect of increasing degrees of fluorination and the last two should be
(and are) almost impossible to wet. The polar components vary within a fairly
small range of low-to-moderate values, although the range of percent polarity is
wider.
The total SSTs listed in Table 3 range from 29 to 53. The higher values
indicate good wetting, but the boundary between wetting and nonwetting will
depend on the paint and the application conditions. It will be noted that the total
SST values are not the same as the critical surface tensions and, in most cases,
are considerably higher. This is not unusual. However, with metals and coatings,
dispersion component values often are close to critical surface tensions, but this
does not seem to hold for most of the plastics in this table. The polarities of
many of the plastic surfaces were higher than I expected. This may reflect the
effectiveness of treatment and cleaning rather than basic surface properties.
T
ABLE
2 Solid Surface Tensions of Polymers by
Owens-Wendt-Kaelble Procedure
Dispersion Polar Polarity
Polymer Total component component (%)
Nylon 6-6 47 41 6 13
Poly(ethyleneterephthalate) 47 43 4 9
Poly(vinylidene chloride) 45 42 3 7
Poly(vinyl chloride) 42 40 2 5
Polystyrene 42 41 1 2
Poly(methyl methacrylate) 40 36 4 10
Poly(vinyl fluoride) 37 31 6 16
Poly(vinylidene fluoride) 30 23 7 23
Poly(trifluoroethylene) 24 20 4 17
Poly(tetrafluoroethylene) 14 12 2 14
Painting Problems 227
T
ABLE
3 Solid Surface Tensions of Plastics and other Coating Substrates
by Owens-Wendt-Kaelble Procedure
Surface tensions (dynes/cm)
Dispersion Polar Polarity
Substrate Total component component (%)
Zn phosphated steel 42 35 7 17
Primer-surfacers 35–44 27–41 4–7 9–20
Azdel 817 48 31 17 35
Bayflex 110-25 (unfilled) 40 31 9 22.5
Bayflex 110-50 Polyurethane 32 28 4 12.5
Capron nylon 6 47 35 12 25.5
Cycolac GPM 5600 ABS 45 37 8 18
Cycoloy C-2950 ABS 51 40 11 27.5
Dow Magnum 344HP ABS 42 33 9 21
Dow Pulse 830 ABS/Polycarbonate 47 35 12 25.5
Dow Spectrum 50 (unwashed) 34 29 5 15
(power washed) 31 23 8 26
(power washed, solvent wiped) 54 31 23 43
GTX nylon-PPO Alloy 38 35 3 8
Lexan FL-900 Polycarbonate 46 45 1 2
Lexan LS2 Polycarbonate 50 42 8 16
Noryl FN215 PPO 46 36 10 22
SMC (untreated, unwashed) 29 24 5 12
(ready for painting) 40–52 30–41 5–18 11–35
TPO Bailey 3183 35 23 12 34
TPO Himont 3041C (flex) 33 31 2 6
TPO Himont 3131 (inter.) 30 29 1 3
TPO Himont 3183 (rigid) 38 32 6 16
TPU/Estane 39 36 3 8
TESLIN PE/Silica 45 45 0 0
Xenoy 1102U Polycarb./Polyester 46 38 8 17
Xenoy 2230 EU 49 38 11 22
Source: Ref. 27.
They certainly did not fit the commonly held view that plastic surfaces have
low polarities. Although two-component surface tensions are more complicated
than critical surface tensions and from these results may appear to be less help-
ful, in fact, they usually give valuable information. Low total SST values indi-
cate the possibility of wetting problems. Low polar components signal the possi-
bility of adhesion problems and point to the need for surface treatment or an
adhesion promoter. The same caveat that was given with the critical surface
228 Schoff
tension table applies to this table: values are subject to change without notice!
We have seen significant differences between test plaques and line parts and in
day-to-day or week-to-week results on line parts. This is why it is crucial to
paint and test actual parts and not totally rely on data from painted plaques.
The O-W-K method has been applied to a number of lab and field prob-
lems and has been found to be very useful in explaining and predicting wetting
and adhesion failures (4,5,26). In addition, it has proved to be a good way to
evaluate treatment and cleaning processes such as plasma treatment (34–36) and
UV-ozone irradiation (37).
Adhesion. An example of results showing a correlation between polari-
ties and adhesion are shown in Table 4, which deals with basecoat adhesion.
The low polarity basecoats (after cure) gave good adhesion; the high polarity
basecoats gave poor adhesion. Other tools for adhesion are listed in Section 5.6
and reference 38. Fourier Transform IR spectroscopy is useful for identifying
contaminants and mold release agents on the plastic (perhaps initially detected
by contact angle measurements).
Three-Component SSTs. SST also has been separated into three compo-
nents: usually γ
d
, γ
p
, and γ
h
. These can be established by measuring contact
angles with three pure liquids (23,39–42) or by wetting studies with a series of
liquids (43,44). Note that the d, p, h notation (dispersion, polar, hydrogen bond-
ing) is the same as that used for three-dimensional solubility parameters (δ
d
, δ
p
,
δ
h
). There is a good reason for this as there is a close relationship between these
material properties (45–48) and a solubility parameter plot can be converted to
surface units (43–47).
One three-component system that shows considerable promise is that of
Good and coworkers (40–42) whose “three-liquid” procedure takes into account
the acidic and basic nature of polymer surfaces. This system is based on two
separate and additive attractive forces (dispersion and acid-base) operating
T
ABLE
4 Adhesion and Solid Surface Tension
Solid surface tension
Adhesion
Dispersion Polar.
Cured coating Total component component Test
Old black 40 30 10 Failed
New black 37 33 4 Passed
Old silver 41 31 10 Failed
New silver 40 35 5 Passed
Red 42 37 5 Passed
Undercoat 42 38 4 —
Painting Problems 229
T
ABLE
5 Three-Liquid Surface Parameters (surface
energies − mJ/m2) Based on Advancing Contact Angles
Polymer γLW γ+ γ−
Polymethylmethacrylate (PMMA) 35.0 0 12.2
Chlorinated polyvinylchloride (CPVC) 45.2 0.24 3.1
Polyvinyl fluoride (PVF, TEDLAR) 34.8 0.19 4.5
Polypropylene (PP) 32.6 0 0
(Corona-treated) 41.1 1.3 8.0
(oxidized
a
) 39.1 0.26 33.2
Polytetrafluoroethylene (PTFE) 19.6 0.28 3.2
a
Different Polypropylene sample.
Source: Refs. 41, 49.
across an interface. The three components are γ
LW
(Lifshitz–van der Waals), γ
+
(electron acceptor), and γ
−
(electron donor). The latter two can be thought of as
forming an AB component resulting from acid-base interactions. Such an analy-
sis should be useful for determining the effectiveness of surface treatments for
plastics, characterizing pigment surfaces, and determining wetting interactions
between paints and substrates.
With this procedure, contact angles of at least three liquids, one nonpolar
and two polar, having known Lewis acidity and basicity are measured. From
the results, data such as that shown in Table 5 can be calculated and the presence
of acidic and basic sites established (γ
+
for acidic and γ
−
for basic).
These data indicate that the polymethylmethacrylate (PMMA) surface was
basic and that chlorinated polyvinylchloride (CPVC) and polyvinyl flouride
(PVF) were both acidic and basic. Polypropylene was nonpolar, but corona treat-
ment led to formation of acidic and basic sites. Another example of the effect
of treatments on the surface of a plastic is shown in Table 6 (49). The surface
activity of PVF was increased by plasma treatment, whereas corona treatment
T
ABLE
6 Effect of Surface Treatments
on Surface Tension Parameters (in mJ/m2)
Material γLW γ+ γ−
PVF untreated 38 0.02 13.2
PVF corona 39 0.07 19.2
PVF plasma 45 1.38 32.9
Source: Ref. 49.
230 Schoff
had little effect. The results are based on contact angles with methylene iodide,
water, and formamide.
Osterhold and Armbruster (50) applied the three-liquid method to coatings
problems and showed that clearcoat wetting of dried basecoats correlated well
to γ
LW
, but not to the acid-base components or O-W-K results. Plastic surfaces
also were examined. The O-W-K analysis showed a considerable increase in
surface polarity of TPO on flame treatment. The three-liquid method confirmed
this, but also showed that both acidic and basic sites had formed with the surface
being predominantly basic.
It should be pointed out that you can learn only so much from contact
angles. They can tell you that a surface is contaminated, difficult to wet, oxidized,
otherwise changed, or a problem and even whether there are acidic and basic
groups present. However, chemical analysis techniques must be used to identify
what is actually on the surface. Also important is that wetting measurements are
done at equilibrium at room temperature, whereas paint application and subse-
quent processes are dynamic and temperatures may vary. Therefore, something
that looks good in the lab, may not work on the line or vice versa if line condi-
tions are substantially different.
5.2.2 Dewetting Tests
Lack of dewetting probably is a better test for predicting performance than is
wetting. Two simple tests have been developed to determine the tendency for
dewetting to occur on a substrate and to identify approximate critical surface
tensions. One involves swabbing a series of solvents onto the substrate with
cotton swabs and observing whether the strip of solvent stays in place or dewets
and crawls (51). The breakpoint between wetting and dewetting provides a criti-
cal surface tension of dewetting. Surface tension “pens” that do much the same
thing as the swabs are available commercially. The other test employs drops of
solvent in much the same way (52,53). These tests can be carried out rapidly
and are particularly useful for testing in the field or on curved or irregular
surfaces where accurate contact angle measurements are not possible. Dewetting
can be related to receding contact angles. Hansen (51,54,55) has covered this
subject in some detail and has illustrated the concepts of spontaneous spreading
and dewetting with plots such as those shown in Figure 17 (55). This figure
shows the results of the measurement of advancing and receding contact angles
on a substrate with a series of liquids of different surface tensions. The advanc-
ing angle plot (A-B-C-D) is a typical Zisman plot with points for four solvents
and an intercept on the cos θ=1 line that gives the critical surface tension for
spontaneous wetting. The receding angle plot (C-D-E) is based on angles mea-
sured as the solvent drops were slowly pulled back into the needle. This angle
is lower than the advancing angle because the edge of the drop now is on a
previously wetted area. The intercept of this plot gives a critical surface tension
Painting Problems 231
F
IG
.17 Critical surface tension (Zisman) plots for advancing and receding contact
angles. Liquid A wets the surface very well, B does not wet as well, but will not
dewet. Liquids C, D, and E dewet. (From Ref. 5, used with permission.)
for spontaneous dewetting that nearly always is higher than that for wetting.
Liquids A and B in Figure 17 do not spontaneously wet, but probably can be
forced to wet fairly easily. They will not spontaneously dewet. Paints with their
surface tensions would not be apt to give dewetting defects. On the other hand,
liquids D and E do not want to wet the substrate and if force wet by smearing
or swabbing would dewet. Paints with their surface tensions might well give
crawling, edge-pull, poor edge coverage, and other defects. Liquid C is in be-
tween and might or might not dewet.
5.2.3 Viscosity Effects
Surface tension is not the only property that affects wetting and dewetting. The
viscosity of the applied paint also influences wetting and surface defect forma-
tion. The rate of wetting is dependent on viscosity as well as surface tension
(56). The equation is
Rate of wetting = (k γ cos θ)/2η
Where k = a constant
γ=liquid surface tension
θ=contact angle
η=viscosity
Regarding dewetting, the amount of material that pulls back and the rate at
which it does so are both dependent on viscosity (1). The velocity of the dewet-
ting front is given by:
232 Schoff
ν=(∂γ/∂x) (h/η)
where ∂γ/∂x is the surface tension gradient (the driving force for dewetting
flow), which is defined as the difference in surface tension (∂γ) over a distance
(∂x), h is the wet film thickness, and η is the viscosity. This equation also holds
for the velocity of a crater wave front.
The rate of change of wet film thickness is
∂h/∂t =−∂J/∂x =−(h
2
/2η)(∂
2
γ/∂x
2
)
which means that the rate of dewetting or crater formation depends on the vis-
cosity and the change in the surface tension gradient. High viscosity means a
low dewetting or crater formation rate. Taken together, these three equations
tell us that even if other conditions are favorable (surface tension, contact angle,
surface tension gradient, etc.), spontaneous spreading or dewetting/crater forma-
tion may not occur if the viscosity is too high.
5.2.4 Other Effects, Tests, and Investigations
With some surface tension–related defects such as telegraphing, it rarely is prac-
tical to use surface tension and wetting methods for characterization. This is
mainly because the dewetting and flow occur on such small scales (edges of
scratches, fingerprint swirls, etc.). The problem usually responds to a combina-
tion of solvent wiping of the substrate and formulation changes to reduce flow.
In the case of fiber telegraphing or read-through, the problem is more one of
substrate swelling, although surface tension–driven flow may be involved as
well. A primer that acts as a good barrier will reduce or prevent swelling by the
topcoat solvents, although solvent changes may be necessary as well. Shrinkage
of topcoats on cure can be a factor in both types of telegraphing. Overbaking
of primer-surfacers makes the problem worse, possibly because this leads to a
rougher surface to be painted by the topcoats.
Previously, it was mentioned that root cause analysis of craters usually is
very difficult. That is true, but certain causes turn up again and again. One
example is oil and water in compressed air. Water usually does not cause craters,
but it is an excellent carrier for oil and droplets of oily water do give craters.
Compressed air should be tested periodically for water and oil content using
Dra
¨
ger tubes or some other technique. At the point of paint application, there
should be no oil detectable and the water level should be less than 150 mg/m
3
.
5.3 Tools for Volatile Defects
The light microscope is the most important tool, but often the specimen must
be cross sectioned before it is clear whether the defect really is a pop and where
it originates. Preparation of cross sections is an art in itself, but the results can
be very useful. Thermogravimetric analysis (TGA) can be used to determine the
Painting Problems 233
temperature of volatilization of components. The same technique can be used to
simulate a bake and determine where and when the volatiles come off. Off-
gases from the TGA or from a head space analyzer can be run into a gas chro-
matograph or mass spec for identification.
SMC gassing or blowout is usually due to porosity in the plastic. The
porosity of SMC can be characterized through use of a dye penetration test
(57,58) . A small amount of dye is added to a topcoat or primer-surfacer that is
then applied over primed and unprimed SMC (the latter as a control). A fluores-
cence microscope is used to observe the migration of the dye into the plastic.
The distance that the dye travels can be determined by a calibrated eyepiece,
photographing the image, or by image analysis. The further the dye goes, the
more porous the SMC or the poorer the primer is as a sealer. This technique is
used to characterize SMC and primers designed to seal the SMC surface.
5.4 Tools for Flow Defects
There are many instruments and devices for measuring viscosity and it is easy
to determine the flow properties of the paint that is in the can or drum (59–61).
The difficulty is in determining the viscosity of the paint on the object that has
just been painted and how this changes with time. One method is to apply the
paint, then scrape it off and measure its viscosity. Besides being very tedious,
this technique has poor repeatability and is not recommended. A technique that
I have used extensively for coatings on metal, but only occasionally for coatings
for plastics is rolling ball viscosity (5,59) in which paint is applied to a panel
or plaque that is placed on an inclined plane (at an angle of 15–30 degrees). A
small metal sphere (ball bearing) is rolled down the wet panel every 30 seconds
or so until the paint sets up. The inverse of the velocity of the ball is a measure
of viscosity. The technique has been useful for explaining flow and appearance
differences, clearcoat soak-in, and a few cratering and popping situations.
Another method to measure flow properties after application involves the
application of microdielectric measurements that have shown promise for char-
acterizing film formation and cure (5,10–13). In this technique, the paint is
applied to a thin, flat sensor connected to a frequency generator, an impedance
analyzer and a computer. The sensor monitors the dielectric properties of the
paint film at and near the interface between the sensor and the coating. The
dielectric parameter used to estimate flow is called ion viscosity, but really is
electrical resistivity rather than a true viscosity. Ion viscosity is a measure of
both the number and mobility of ions in a specimen. It is affected by changes
in temperature, loss of solvent, crosslinking and other chemical reactions, forma-
tion of physical structure (such as by a thixotrope), ionic impurities, and ionic
additives. The advantage of this technique is that measurements can be made in
situ during application, flash, and the bake.
234 Schoff
5.5 Tools for Dirt Problems
Dirt reduction/prevention is a process that initially involves identification of the
dirt on painted parts and root cause analysis to determine the source of the dirt.
The latter can be very difficult. Dirt audits of paint plants and customer facilities
help to identify current and potential dirt problems and sources. When done on
a regular basis, they also allow measurement of whether efforts to reduce dirt
are working or not. Another aspect of the process is to analyze dirt found in
defects. It also is useful to collect dirt in a plant (carefully noting its source)
and compare it to the dirt in defects. Removing dirt from defects takes a great
deal of skill, but often is necessary in order to separate the dirt particle from its
cocoon of paint (62,63). Cross sections also can be useful for enabling the inves-
tigator to actually see the dirt (Fig. 18). The key instrument for analysis is a
light microscope. A small 40–60X microscope can be used on line for rapid
identification, but analysis in the lab with a more sophisticated, but still low-
power microscope almost always is more accurate. Cross sections usually are
viewed at higher powers (100–300X). A dirt library with images of previously
identified dirt can be helpful in characterizing new dirt, but analysis by scanning
F
IG
.18 Cross section showing a clump of basecoat overspray in a clearcoat.
Painting Problems 235
electron microscopy/energy dispersive x-ray (SEM/EDX) or IR microscopy often
are necessary for accurate characterization. Even then, knowledge of what the dirt
is does not do much good unless you can figure out where it is coming from.
A very valuable tool for handling dirt problems and preventing new ones
is a plant Dirt Team. Such a group must have representatives from many areas:
production, the paint shop, quality assurance, maintenance, paint suppliers, equip-
ment and filter suppliers, etc. The team or individuals on it must have the author-
ity to make changes in the process and its equipment, otherwise there will be a
lot of discussion, but little will be accomplished.
Prevention of dirt problems requires clean raw materials; clean paint; a
clean paint shop (isolated from the rest of the plant); a clean, dry air supply
(environmental and compressed air); low-lint protective clothing and wiping
cloths; and a properly trained, disciplined workforce. Sanding should be mini-
mized and vacuum sanders should be used where possible. Dirt and dust should
be removed by good tacking and wiping techniques and with effective blow-
offs. Stored parts should be protected from dirt fallout. Entry to paint booths
should be restricted to those who must be there (people = dirt). Booths should
be kept clean, although there is considerable disagreement as to how often they
should be cleaned. I have seen cleaning done as frequently as once a week and
as infrequently as once a year. At most plants, the level of gun and bell mainte-
nance needs to be raised. Ideally, a line should have two sets of gun tips and
bells, one for operation, the other for preventive maintenance. Equipment should
be cleaned during breaks within shifts as well as between shifts.
5.6 Tools for Field Problems
There are a number of tests that can be used to determine resistance to possible
field damage and problems or to explain field failures. Although not aimed
specifically at coatings for plastics, reference 20 gives a good general overview.
5.6.1 Adhesion
There are over 200 adhesion tests available, but only a few are used for painted
plastics. Reference 38 describes several of them in detail. The most widely used
test for coatings is the tape test (ASTM D 3359) in which an X-cut or lattice
pattern is made in the film; pressure-sensitive tape is applied over the cuts and
then rapidly removed; and adhesion is evaluated. As with virtually all adhesion
tests, this test is sensitive only to large differences in adhesion. I do not believe
that it is possible to make precise, accurate numerical comparisons between
coatings with this test, but it works well for ranking coatings. Another class of
tests is comprised of pull-off methods that measure the force needed to pull a
coating from a substrate. ASTM D5179 uses a tensile tester to do the pulling
and D 4541 employs a portable tester. Again, precision is disappointing. Other
236 Schoff
tools for adhesion include the knife-edge scrape test (rub knife edge across
surface), the solvent soak test (submerge an X-scribed test coupon in toluene/
VM&P naphtha), and peel testing (58,64). Chip, scratch, and abrasion tests can
be useful for evaluating adhesion, although mainly to show gross differences.
5.6.2 Mar and Scratch
There are a large number of mar-and-scratch tests. Some are attempts to recreate
field damage such as from car washes; polishing and dry wiping; and general
use and operation. Other tests involve the measurement of basic mechanical
properties that should be useful in predicting resistance to marring and scratch-
ing stresses. Courter and Kamenetzky (65) evaluated a number of tests and their
paper provides a useful comparison of methods. Many mar and scratch tests
really are abrasion tests. They include a method using a reciprocating arm to
rub a cloth back and forth over a dry abrasive on a panel (the crockmeter test,
ASTM D 6279, and references 65–67), a similar test with an abrasive cloth,
desk-top or floor-model car wash simulators, and the Taber abrader (ASTM D
6037, Method A). The degree of damage is determined from visual inspection,
gloss measurements, and image analysis (68–72). Work of fracture tests (65–
67) attempt to measure the toughness of the film. More recent nanoscratch tech-
niques (65,73–75) measure the force to initiate a scratch and relate force and
scratch depth to give what might be called a scratch modulus. Another relatively
new method uses a modified scanning-probe microscope in one mode to stress
the surface and in another to characterize the response (65,67,76,77).
5.6.3 Friction-Induced Damage (Gouging) on TPO
The standard technique for reproducing such failures in the lab is the Slido
instrument (78,79) that applies a sliding stress to a painted panel using a half-
cylinder probe. A wide range of forces can be applied and the device has heating
capabilities to make the coating more sensitive to the sliding action. A Ford instru-
ment called the Statram (80) and heated Taber abrader testing (GM test method
9911P) also have been used to simulate friction-induced damage. Resistance to
gouging is dependent on the cohesive strength of the substrate and the mechanical
properties of the coating, particularly the coefficient of friction (81).
6 CLOSING REMARKS
Perhaps the most daunting thing about painting plastics is the large number of
things that can go wrong. Applying one complicated material (paint) to another
(plastic) with a difficult-to-control process is not the way to make life easy for
oneself. However, it is hoped that this chapter provides sufficient information
and references to enable the reader to reduce the problems to a manageable few.
Painting Problems 237
REFERENCES
1. P Fink-Jensen. Surface disturbances in fluid paint films. Farg och Lack 8:5–14,
39–49, 1962. Farbe Lack 68:155–162, 1962.
2. CM Hansen, PE Pierce. Surface effects in coatings processes. Ind Eng Chem Prod
Res Dev 13:218–225, 1974.
3. LO Kornum, HK Raaschou Nielsen. Surface defects in drying paint films. Progr
Org Coat 8:275–324, 1980.
4. PE Pierce and CK Schoff. Coating Film Defects, rev. ed. Blue Bell, PA: Federation
of Societies for Coatings Technology, 1994.
5. CK Schoff. Surface defects: diagnosis and cure. J Coat Technol 71(888):56–73,
1999.
6. LW Hill, K Kozlowski. Crosslink density of high solids melamine-formaldehyde
cured thermoset coatings. J Coat Technol 59(751):63–71, 1987.
7. T Provder. Cure characterization in product research and development. J Coat
Technol 61(770):33–50, 1989.
8. DJ Skrovanek. The assessment of cure by dynamic mechanical analysis. Progr Org
Coat 18:89–101, 1990.
9. LW Hill. Structure/property relationships of thermoset coatings. J Coat Technol
64(808):29–41, 1992.
10. D Kranbuehl. In-situ cure monitoring of coatings for plastics. Proceedings, Div
Polym Mater Sci Engr, Amer Chem Soc, 63:90–93, 1990.
11. DD Shepard. Studying the drying and curing rates of acrylic automotive topcoats
using dielectric analysis. J Coat Technol 68(857):99–102, 1996.
12. D Kranbuehl, D Hood, C Kellam, J Yang. In-situ sensor for monitoring molecular
and physical changes during film formation. In: T Provder, M Winnik, M Urban,
eds. Film Formation in Waterborne Coatings, ACS Symposium Series No. 648.
Washington: Amer Chem Soc, 1996, pp 96–115.
13. D Kranbuehl, D Hood, J Rogozinski, A Meyer, M Neag. Monitoring the changing
state of a polymeric coating resin during synthesis, cure and use. Progr Org Coat
35:101–107, 1999.
14. RJ Hahn. Cratering and related phenomena. J Paint Technol 43(562):58–62, 1971.
15. CM Hansen, PE Pierce. Cellular convection in polymer coatings–an assessment.
Ind Eng Chem Prod Res Dev 12:67–70, 1973.
16. G Bierwagen. Surface dynamics of defect formation in paint films. Progr Org Coat
3:101–113, 1975.
17. G Bierwagen. Surface defects and surface flows in coatings. Progr Org Coat 19:
59–68, 1991.
18. RHJ Blunk, JO Wilkes. Surface-tension-driven flows of coatings: bondline readout
formation. J Coatings Technol 73(918):63–71, 2001.
19. RE Johnson Jr, RH Dettre. Wetting of low energy surfaces. In: JC Berg, ed. Wett-
ability. Surfactant Science Series, vol. 49. New York: Marcel Dekker, 1993, pp
1–73.
20. DG Weldon. The Failure Analysis of Paints and Coatings. Chichester, England:
John Wiley and Sons, 2000.
238 Schoff
21. U Zorll. Practical matching controls for the adhesion properties of polymeric mate-
rials. Intern Polym Sci Technol 5(4):T/1–T/6, 1978 (orig. in Gummi Asbest Kunst
30(9):634–639, 1977).
22. H Potente, R Kreuger. The importance of the polar and disperse fractions of the
surface tension of plastomers and coating materials for the adhesive strength of
bonded systems. Farbe Lacke 84:72–75,1978.
23. T Imai. New approaches to the problem of corrosion protection by means of or-
ganic coatings. In: GD Parfitt and AV Patsis, eds. Proceedings of the 8th Interna-
tional Conference in Organic Coatings Science and Technology, Athens, July 1982,
pp 301–328; Organic Coatings Science and Technology, vol. 6. New York: Marcel
Dekker, 1984, pp 325–350.
24. WA Zisman. Relation of the equilibrium contact angle to liquid and solid constitu-
tion. In: RF Gould, ed. Contact Angle, Wettability and Adhesion. Adv Chem Series
No. 43. Washington: Amer Chem Soc, 1964, pp 1–51.
25. WA Zisman. Surface energetics of wetting, spreading, and adhesion. J Paint Tech-
nol 44(564):41–57, 1972.
26. CK Schoff. Wettability phenomena and coatings. In: ME Schrader and G Loeb,
eds. Modern Approaches to Wettability. New York: Plenum Press, 1992, pp 375–
395.
27. CA Kondos. Plastics Substrates. Unpublished Report. Allison Park, PA: PPG In-
dustries, Inc., 1993.
28. GD Cheever. Evaluation of heterogeneous surfaces by contact angle distributions.
J Coat Technol 58(732):37–42, 1986.
29. S Wu. Surface tension of solids: an equation of state analysis. J Colloid Interface
Sci 71:605–609, 1979.
30. JR Dann. Forces involved in the adhesive process. I. critical surface tensions of
polymeric solids as determined with polar liquids. J Colloid Interface Sci 32:302–
320, 1970.
31. DK Owens, RD Wendt. Estimation of surface free energy of polymers. J Appl
Polym Sci 13:1741–1747, 1969.
32. DH Kaelble. Dispersion-polar surface tension properties of organic solids. J Adhe-
sion 2:66–81, 1970.
33. S Wu. Surface and interfacial tensions of polymers, oligomers, plasticizers, and
organic pigments. In: J Brandrup, EH Immergut, EA Gilke, eds. Polymer Hand-
book, 4th Ed. New York: John Wiley & Sons, 1999, pp VI/521–VI/541.
34. M Osterhold, K Armbruster. Surface tension measurements and ESCA investiga-
tions on pretreated polymer samples. Farbe Lack 97:780–783, 1991.
35. H Gleich, H Hansmann. Low pressure plasma treatment for the systematic modifi-
cation of surfaces of thermoplastic adherends. Part II: the analysis and evaluation
of plasma-modified synthetic resin surfaces. Adha
¨
sion 35(3):27–32,1991.
36. Y Yao, X Liu, Y Zhu. Surface modification of high-density polyethylene by plasma
treatment. J Adhesion Sci Technol 7:63–75, 1993.
37. AB Ponter, WR Jones Jr, RH Jansen. Surface energy changes produced by ultravio-
let-ozone irradiation of poly(methyl methacrylate), polycarbonate, and polytetraflu-
oroethylene. Polym Eng Sci 34:1233–1238, 1994.