Novel Applications of the UWB Technologies Part 10 potx
Bạn đang xem bản rút gọn của tài liệu. Xem và tải ngay bản đầy đủ của tài liệu tại đây (1.34 MB, 30 trang )
Detection and Avoidance Scheme for DS-UWB System: A Step Towards Cognitive Radio
257
0 1 2 3 4 5 6 7 8 9 10 11
x 10
9
-80
-75
-70
-65
-60
-55
-50
-45
-40
PSD [dBm/MHz]
Frequency [Hz]
M=48
N=2048
avoid two
sub-bands
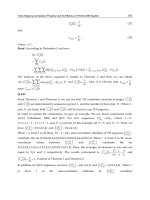
Fig. 9. PSD of the DAA pulse avoiding two sub-bands on which primary users are
operating
Fig. 9 illustrates the PSD of the resulting pulse for the second scenario. As expected, the
DAA pulse forms two 15dB deep valleys around the two sub-bands in use by the assumed
two primary users, effectively avoid interfering the primary users.
-1 -0.8 -0.6 -0.4 -0.2 0 0.2 0.4 0.6 0.8 1
x 10
-9
-4
-2
0
2
4
Time [s]
-1 -0.8 -0.6 -0.4 -0.2 0 0.2 0.4 0.6 0.8 1
x 10
-9
-4
-2
0
2
4
Time [s]
Amplitude
Amplitude
Fig. 10. Waveforms of the DAA Pulse Avoiding Two Sub-bands
The pulse waveforms for the second scenario (for simplicity, the waveforms of the first,
which is similar to the second, is left out) is shown in Fig. 10. As seen, the pulse consists of
two parts: The real part (on the top) is even, and the imaginary (on the bottom) is odd.
Novel Applications of the UWB Technologies
258
The autocorrelation function, as given by Eq. (32), of the DAA pulse is illustrated in Fig. 11,
in which the narrow main-peak suggests that the DAA pulse is sensitive to time jitter,
possibly more sensitive than an ordinary pulse, this is the price to pay for DAA.
-1 0 1
x 10
-9
-1
-0.8
-0.6
-0.4
-0.2
0
0.2
0.4
0.6
0.8
1
Autocorrelation Function of the DAA Pulses
Time [s ]
Fig. 11. Autocorrelation Function of the DAA Pulses Avoiding Two sub-bands.
Detection and Avoidance Scheme for DS-UWB System: A Step Towards Cognitive Radio
259
In multi-user or multi-access situations, the DAA pulse works in a similar manner as in a
general DS-UWB spread-spectrum scheme. So the performance for multi-user or multi-
access under DAA operation is guaranteed by the performance of the pseudorandom or
pseudo-noise (PN) sequence assigned for differentiating multi-users. Therefore, the cross-
correlation properties of the DAA pulses are out of concern here.
3.8.2 Complexity
The suggested DAA algorithm involves mainly matrix multiplications, for which the
dominating operation is complex multiplication. Three factors dictate the total number of
multiplications: first, N the number of sampling points for performing numerical
integration; second, M the dimension of the co-basis; finally, K the length of the resulting
sequence representing the transmission pulse.
The unchanging part
P requires roughly K(MN+M+N) complex-value multiplications and
thus consumes most of the computer time. Given N=2048, M=48, and the resultant K=64, the
complex-value multiplications totals 6,425,600 in the simulations. However, the
P only
needs to be calculated once, so it does not represent the real computational complexity. On
the other hand, the changing part
P´ requires to be updated frequently, but its
computational time is reduced to NK because the intermediate matrix (
) has
already existed; therefore, the real computational complexity is
(NK), totaling roughly
131,072, roughly equivalent to 0.1 second if the digital signal processor embedded in the
UWB radio operates at one million instructions per second. The amount of time does not
vary regardless of the central frequencies and bandwidths of the sub-bands in use by
primary users—as opposed to the changeable computational time in the linear combination
method addressed in (Benedetto et al., 2004). Therefore, the DAA algorithm has predictable
and managable processing delay, and is robust in real-time communications.
3.9 Conclusion
Detection and avoidance, as a cognitive radio scheme, has been proven effective for multi-
band UWB group. The basic idea underlying the DAA is turning off individual carrier-
tone on the interfered sub-band. However, coming to direct-sequence UWB, a competing
technology group with the multi-band UWB, this idea of turning off tones ceases to be
true because shutting off any sub-band would mean to re-design the pulses all over again.
In a cognitive environment, the re-design should be agile enough and easily
reconfigurable. To this end, we devise a DS-UWB-oriented DAA scheme by emphasizing
the side of avoidance (that is, the re-design of the pulse) while de-emphasizing the side of
detection by referencing the well-established spectral estimation methods in existing
literatures. We propose a domain-less co-basis expansion method in the sense that
Hermite-Gaussian functions are used to constitute a common basis (co-basis) for the time
and frequency domains. One advantage of the co-basis is that the transmission pulses are
directly obtained from the expansion of given soft-spectrum masks, so the resulting
pulses fit into arbitrary spectrum masks. Another advantage is that the co-basis functions
(that is, the HGFs) are discretized, built as matrices, and stored in ROM, such that
whenever a soft spectrum is sensed or discovered, the DAA-enabled pulse is generated by
merely matrix multiplying. The amount of computational time is thus trivial, and the re-
design of the pulse can respond quickly to a rapidly-changing soft spectrum. The
algorithm can be implemented through software defined radio (SDR) techniques.
Novel Applications of the UWB Technologies
260
Computer simulation verifies that the DAA algorithm is low complex, easily configurable,
robust, and agile enough to avoid the intended subbands.
4. References
Brent Parr et al., “A novel Ultra-Wideband Pulse Design Algorithm,” IEEE Communications
letters, Vol. 7, No. 5, May 2003.
De, P. & Liang, Y. C. Blind Sensing Algorithms for Cognitive Radio, Proceedings of 2007
IEEE Radio and Wireless Symposium, pp. 201–204, Long Beach, USA, January 9-11,
2007
Dhillon, R. S. & Brown, T. X. Models for Analyzing Cognitive Radio Interference to Wireless
Microphones in TV Bands, IEEE DySPAN 2008, pp. 1 – 10, Chicago, USA, October
14-17, 2008
FCC, “Revision of Part 15 of the Commission’s Rules Regarding Ultra-wideband
Transmission Systems: First Report and Order,” Technical Report FCC 02-48,
2002.
Haldun M. Ozaktas et al., The Fractional Fourier Transform with Applications in Optics and
Signal Processing, John Wiley & Sons, LTD, Chichester, New York, 2000.
Honggang Zhang & Ryuji Kohno, “Soft-Spectrum Adaptation in UWB Impulse Radio,” the
14th IEEE 2003 International Symposium on Personal, Indoor and Mobile Radio
Communication Proceeding.
Hu, W. et al. Dynamic Frequency Hopping Communities for Efficient IEEE 802.22
Operation. IEEE Communications Magazine, Vol. 45, No. 5, (May 2007), pp. 80–87,
ISSN 0163-6804
IEEE P802.22 working Group for WRAN, Cognitive Wireless RAN Medium Access Control
(MAC) and Physical Layer (PHY) specifications: Policies and procedures for
operation in the TV Bands, IEEE P802.22/WDv0.4.7 Draft Standard for WRAN
Part 22, 2006.
Jeffrey H. Reed, Software Radio: A modern Approach to Radio Engineering, Prentice Hall PTR,
2002.
Jim Lansford, “UWB Coexistence and Cognitive Radio,” Ultra Wideband Systems 2004, Joint
with Conference on Ultra wideband Systems and Technologies
John G. Proakis, Digital Communications, Fourth Edition, McGraw-Hill Companies, 2003.
John Walko, “Cognitive Radio,” IEE Review, Http://www.iee.org, May 2005.
Johnstone, I. M. On the distribution of the largest eigenvalue in principle components
analysis, The Annals of Statistics, Vol. 29, No. 2, (2001), pp. 295–327.
Kalke, J. TV Band Low Power Devices the need for Coexistence with IEEE 802.22, IEEE
Plenary Tutorial, pp. 1-10, Vancouver, Canada, November 14-18, 2005
Lei, Z. D. & Chin, F. A Reliable and Power Efficient Beacon Structure for Cognitive Radio
Systems, IEEE Transactions on Broadcasting, Vol. 54, No. 2, (June 2008), pp. 182 – 187,
ISSN 0018-9316
Lim, S.; Kim, S.; Park, C. & Song, M. The detection and classification of the Wireless
Microphone signal in the IEEE 802.22 WRAN system, Asia-Pacific Microwave
Conference 2007, pp.1–4, Bangkok, Thailand, December 11-14, 2007
Detection and Avoidance Scheme for DS-UWB System: A Step Towards Cognitive Radio
261
Maria-Gabriella Di Benedetto et al. (Ed), UWB Communication Systems: A Comprehensive
Overview, Hindawi Publishing Corporation, 2006.
Maria-Gabriella Di Benedetto et al., Understanding Ultra Wide Band Radio Fundamentals,
Prentice Hall PTR, 2004.
Moe Z. Win. “Ultra-Wide Bandwidth Time-Hopping Spread-Spectrum Impulse Radio for
Wireless Multiple-Access Communications,” IEEE Transaction on Communications,
Vol. 48, No. 4, April 2000.
Mohammad Ghavami et al., “Hermite Function Based Orthogonal Pulses for Ultra
Wideband Communications,” Proc. IEEE Wireless Personal Multimedia Conference
(WPMC’01), Aalborg, Denmark, September 2001.
Mossa, A. M. & Jeoti, V. Cognitive Radio: Cyclostationarity-Based Classification Approach
for Analog TV and Wireless Microphone Signals, IEEE Innovative Technologies in
Intelligent Systems and Industrial Applications 2009, pp. 107 – 111, Kuala Lumpur,
Malaysia, July 25-26, 2009
Notor, J. The Evolution of Spectrum Sharing in the IEEE 802.22 WRAN Standards Process,
, Feb. 2006.
P. D. Welch, “The Use of Fast Fourier Transform for the Estimation of Power Spectra: A
Method base on Time-Averaging over Short, Modified Periodograms,” IEEE Trans.
Audio Electroacoustics, Vol. AU-15, pp. 70-73, 1967.
Quan, Z.; Cui, S. G.; Poor, H. & Sayed, A. Collaborative wideband sensing for cognitive
radios, IEEE Signal Processing Magazine, Vol. 25, No. 6, (November 2008), pp. 60 –
73, ISSN 1053-5888
R. Kohno & K. Takizawa, “Detection and Avoidance Based on Soft-Spectrum Adaptation of
UWB Interference to Existing Radio Systems,” IEEE Ninth International Symposium
on Spread Spectrum Techniques and Applications, 2006.
Rife, D. C. & Boorstyn, R. R. Single Tone Parameter Estimation from Discrete-Time
Observations, IEEE Trans. Inform. Theory, Vol. IT-20, (September 1974), pp. 591–598,
ISSN 1089-7771
Simon Haykin, “Cognitive Radio: Brain-Empowered Wireless Communications,” IEEE
Journal on Selected Areas in Communications, Vol. 23, No. 2, Feb. 2005.
Stevenson, C. R. et al. Functional Requirements for the 802.22 WRAN Standard r47, (January
2006)
Teh, K. C.; Teng, C. C.; Kot, A. C. & Li, K. H. Jammer Suppression in Spread Spectrum, IEEE
Conf. on Information Engineering, pp. 220–224, 1995.
Tufts, D. & Kumaresan, R. Singular Value Decomposition and Improved Frequency
Estimation Using Linear Prediction, IEEE Trans. on Acoustics, Speech, and Signal
Processing, Vol. 30, No. 4, (August 1982), pp. 671–675
Unnikrishnan, J. & Shellhammer, S. Simulation of Eigenvalue based sensing of wireless
mics, IEEE 802.22-07/0357r0, (July 2007)
Wu, Y. C; Wang, H. G. & Zhang, P. Protection of Wireless Microphones in IEEE 802.22
Cognitive Radio Networks, IEEE International Conference on Communications
Workshops 2009, pp. 1 – 5, Dresden, Germany, June 14-18, 2009
Novel Applications of the UWB Technologies
262
Zeng, Y. H. & Liang, Y. C. Covariance Based Signal Detections for Cognitive Radio,
Proceedings of 2nd IEEE DySPAN 2007, pp. 202– 207, Dublin, Ireland, April 17-20,
2007
Zeng, Y. H. & Liang, Y. C. Eigenvalue-Based Spectrum Sensing Algorithms for Cognitive
Radio, IEEE Transactions on Communications, Vol. 57, No. 6, (June 2009), pp. 1784 –
1793, ISSN 0090-6778
Zhenzhen Ye, Madhukumar A. S & Francois Chin, “Power Spectral Density and In-Band
Interference Power of UWB Signals at Narrowband Systems,” IEEE International
Conference on Communications 2004, Volume 6, pp. 3561-3565, June 2004.
13
Performance Analysis of Spectrum Management
Technique by Using Cognitive Radio
Keisuke Sodeyama and Ryuji Kohno
Yokohama National University
Japan
1. Introduction
The usage of the radio spectrum and the regulation of radio emissions are coordinated by
national regulatory bodies. As part of radio regulation, the radio spectrum is divided into
frequency bands, and licenses for the usage of frequency bands are provided to operators,
typically for a long time such as one or two decades. With licensed frequency bands,
operators have often the exclusive right to use the radio resources of the assigned bands for
providing radio services. Depending on the type of radio service and on the efficiency of the
radio systems, frequency bands may be used inefficiently.
Therefore, many national regulatory and standards bodies such as the Federal
Communications Commission (FCC)[2], IEEE 802.22 WG [3], and the Ministry of Internal
Affairs and communications in Japan have paid attention to the dynamic spectrum access
(DSA) technology. Using DSA technology, radio systems can dynamically use and release
radio spectrum wherever and whenever they are available. Moreover, DSA technology
helps to minimize unused radio spectrum band [9]. This technology is also referred to as
cognitive radio technology. Cognitive radio is defined as an intelligent wireless communication
system, which may be aware of its environment and adapt to statistical variations in the
input stimuli [8].
On the other hand, wireless communications systems such as wireless local area network
(WLAN) and Bluetooth are becoming pervasive throughout the world. Especially, the main
application of WLAN is wireless connection of PC’s to a network but even includes such
uses as wireless transmission of moving pictures at indoor environment. Thus, WLAN has
dramatically grown in popularity. Bluetooth is also a promising wireless interface solution
in mobile ubiquitous environments and is expected to predominate among such
applications soon. Meanwhile, some new technologies such as ultra wideband (UWB) radio
systems have been proposed for short-range wireless applications [7]. They are expected to
spread as a complement to developed technologies such as WLAN and Bluetooth or to be
merged with such established technologies.
UWB radio may inherently degrade the performance of the primary systems since the radio
band of the UWB radio systems overlaps that of primary systems such as worldwide
interoperability for microwave access (WiMAX), 4th generation mobile cellular systems (4G)
and field pickup unit (FPU). The technical conditions on the usage of UWB radio system
were set up by the Ministry of Internal Affairs and Communications on March 2006, in
Japan. In the conditions, it is essential for UWB radio to equip interference mitigation
technique, detect and avoid (DAA) [11][12].
Novel Applications of the UWB Technologies
264
In the environment for the usage of UWB, coexistence of heterogeneous wireless
communications systems are enabled by using the concepts and techniques of the cognitive
radio. Cognitive radio is a radio system that can sense the surrounding radio wave
environment and use the radio resources efficiently by flexible reconfiguration of the system
as a function of the environment changes [4].
Although UWB radio systems with DAA are allowed to transmit with power level of -41.3
dB/MHz, those without DAA technique must limit their emission level by -70 dBm/MHz,
which is lower than the noise level. Therefore, DAA is essential for UWB radio systems in
order to allow them to transmit with the maximum allowed power level.
The question that may arise at this point is how to design the MAC layer of cognitive radio
systems such as UWB radio with DAA. Therefore, in this paper, this coexistence environment
is analyzed by introducing two important benchmarks and the design issue is discussed based
on these results. Moreover, we discuss the detection technique of primary system signals for
UWB system with DAA and the effect of UWB system performance using DAA.
The rest of this paper is organized as follows. In Section 2, the cognitive radio system design
issue is analyzed. The performance analysis of UWB radio system with DAA technique is
presented in Section 3. Finally, conclusions are drawn in section 4.
2. Analysis of cognitive radio system design issue
2.1 System model
2.1.1 Channel and traffic model
We omit the effect of channel errors in order to make the analysis tractable. Hence, the
channel is either busy or idle. The offered traffic is modelled with two random processes per
radio systems [10], offered traffic and departure rate.
2.1.2 Radio spectrum usage model
Without loss of generality, radio spectrum usage model having two different radio systems
is considered to analyze this coexistence environment. As shown in Fig. 1, radio system A
operates on one frequency channel (center frequency
2
f
) and radio system B operates on
three frequency channels (center frequencies
1
f
,
2
f
,
3
f
).
Radio system A can be considered as an UWB system with DAA technique and radio
system B as a primary system. Radio system B access the channel based on the scheduling
algorithm such as a time-division multiple access (TDMA). Radio system A can occupy a
wideband radio resource if and only if all of the channels of radio system B are idle.
Moreover, radio system A can recognize available channels without
sensing error and delay.
Fig. 1. Frequency channels used by two different types of radio system
Performance Analysis of Spectrum Management Technique by Using Cognitive Radio
265
2.2 Definitions of benchmarks
In this chapter, we employ “air time” and “interference time” as benchmarks. The “air time”
means the ratio of allocation time per radio system to the reference time (say one hour) [10].
Namely,
1
()
1
type
N
type
type
i
allocation time i
air time
N reference time
(1)
where
t
yp
e
N is the number of channels belonging to ,type A B
and ()allocation time i is the
total time of radio resources allocated to
t
yp
e . It characterizes the share of resources each
radio system can allocate.
The “interference time” refers to the ratio of interfere time to the reference time. Hence,
0
1
,
B
N
B
i
inerference time
inerference time
N reference time
(2)
where i
nterference time(i) is the total time when radio system A and B use channels
simultaneously. Note that allocation time (i) does not include interference time(i).
The radio systems with different channel bandwidths have different requirements for the
throughput performance so that the fairness of the network should be considered. However,
the mutual interference of the radio systems is significantly important for the design of this
coexistence network compared to throughputs and the fairness since the radio system B is a
licensed system, which must be protected from the interference from the radio system A
such as the UWB system. Thus, in this paper, the throughput performance is not
investigated and our interest is restricted to analyze the mutual influence and the actual
channel usage rate.
2.3 Numerical results
In this section, computer simulation and the theoretical analysis are presented. We reported
the theoretical analysis in [6]. Fig. 2 and Fig. 3 show
airtime and interference time versus
offered traffic of radio system A or B, respectively. Also, Fig. 4 shows
airtime and interference
time
versus the departure rate of radio system A.
From Fig. 2,
interference time is approximately zero over wide range of offered traffic of radio
system B because of DAA function of system A. The
airtime of system B can achieve about
0.65 without increasing
interference time. However, airtime of system A is decreased by
increasing offered traffic of B. Therefore, a trade-off between
airtime of system A and that of
system B can be found.
From Fig. 3,
airtime of system A may be increased by increasing its offered traffic. However,
maximal
airtime of system A cannot exceed 0.1. On the other hand, offered traffic of system
A also increases
interference time, of which maximal value is about 0.2. Therefore, if the
system A requires more offered traffic, then that of system A should be increased at the cost
of increasing
interference time.
From the Fig. 4, while
interference time is decreased by increasing the departure rate of radio
system A,
airtime of radio system B becomes longer. However, airtime of system A is
decreased since the occupancy time of channels becomes shorter by increasing the departure
rate of system A.
Novel Applications of the UWB Technologies
266
In order to minimize the interference time, the offered traffic of radio system A should be
small and the departure rate large. The
airtime of system B is 0.3 and interference time is 0.5
even if offered traffic of system A is one. On the other hand, the
airtime of system B becomes
zero and
interference time becomes 0.5 if the departure rate of system A is zero. Therefore, the
occupancy time of channels should be shortened for system A rather than decreasing
offered traffic since the departure rate is inversely proportional to the occupancy time.
Fig. 2.
Airtime of each system and interference time vs. offered traffic of radio system B.
Performance Analysis of Spectrum Management Technique by Using Cognitive Radio
267
Fig. 3.
Airtime of each system and interference time vs. offered traffic of radio system A.
Fig. 4.
Airtime of each system and interference time vs. departure rate of radio system A.
Novel Applications of the UWB Technologies
268
3. The performance analysis of UWB radio system with DAA
In Section 3, we show that the mutual interference is inherently occurred even with the ideal
cognitive radio technology. However, in practical situations, the cognitive radio
technologies cannot detect the primary systems ideally and this effect may degrade the
performance of the primary systems. Therefore, in this section, the performance of the
interference mitigation technique for UWB radio communications is investigated under a
practical scenario. Detection technique of primary system for UWB system is discussed
and also the avoidance technique of interference to primary system for UWB system is
presented [5].
3.1 Detection technique primary system
We consider coexistence environment between UWB system and primary system such as
4G and WiMAX under the indoor environment. The detection scheme of primary system
signal using MB-OFDM receiver is studied in order to realize DAA operation. By
comparing the estimated average power of primary system signal obtained from the fast
fourie transform (FFT) outputs corresponding to the primary band with the background
noise average power, detection is performed. For the comparison, it is necessary to
determine the appropriate threshold value so that the miss-detection probability can be
made smaller. In order to perform value for detection this, theoretical detection and miss-
detection probabilities are obtained and they are used to determine the threshold value
for detection.
The MB-OFDM system has
N sub-carriers and the continuous M sub-carriers are interfered
from the primary system signals within the limits of the band of primary system. Therefore,
N sub-carriers the observation signal of MB-OFDM receiver is represented as component
interference and component noise.
If the average power of
N sub-carriers is larger than the average power of (N M) sub-
carriers, then the detector assumes that the primary system exists.
3.2 Avoidance technique of interference for primary system
Among the interference avoidance techniques to primary systems, active interference
cancellation (AIC) is the simplest one in the frequency domain. In this technique the MB-
OFDM receiver detects the primary system signals and the part of sub-carriers which
overlaps the frequency band of primary system are not transmitted therefore forming a
notch. Moreover, this technique reduces the effect of side lobe from neighbor sub-carriers.
Therefore, in this paper, we assume MB-OFDM system can avoid the interference to
primary system by using arbitrary avoidance techniques. Therefore, we consider the
performance of MB-OFDM system with interference mitigation technique for primary
systems. Also, we show significant performance improvement by introducing convolutional
codes with bitwise interleaving.
3.3 Numerical results
3.3.1 Analysis of detection technique
The detection and miss-detection probabilities of primary system in MB-OFDM receiver is
shown in Fig. 5.
Performance Analysis of Spectrum Management Technique by Using Cognitive Radio
269
The detection probability depends on signal to noise ratio (SNR) and threshold, and the
miss-detection probability depends on only the threshold. Here, SNR is defined the MB-
OFDM signal to noise ratio. Although the low threshold should be chosen to obtain the high
detection probabilities, the low threshold also increase the miss-detection probabilities.
Hence, the threshold value should be changed dynamically according to the SNR to keep
the constant detection probability. Fig. 6 indicates the relationship between threshold and
SNR which is satisfied the arbitrary detection probability such as 60, 70, 90%. The miss-
detection probability of the dynamic threshold is shown in Fig. 7.
In Fig. 6, a constant detection probability is obtained since threshold is dynamically
changed by following SNR. The high threshold is required to obtain the high data rate.
However, the high threshold inherently increase the miss-detection probability and thus the
throughput of the MB-OFDM system is decreased.
Fig. 5. The detection/miss-detection probability of primary system
Novel Applications of the UWB Technologies
270
Fig. 6. The relationship between threshold and SNR which is satisfied the arbitrary detection
probability
Fig. 7. The miss-detection probability of dynamic threshold following SNR
Performance Analysis of Spectrum Management Technique by Using Cognitive Radio
271
3.3.2 Analysis of interference avoidance technique
The BER of MB-OFDM system with error correction code and interleave is illustrated in
Fig. 8.
Fig. 8. The performance of MB-OFDM system with DAA
In Fig. 8, the device with DAA technique has a high bit error rate (BER). The error floor
observed in moderate SNR region is due to the power control, which makes the
transmission power level as -70 dB/MHz in the band overlapping with the primary system.
The BER is decreased exponentially again in the high SNR region more than 35dB.
Moreover, combining the bit-interleaved convolution code with DAA, the performance of
MB-OFDM system can be further improved and is asymptotically identical with the ideal
performance.
4. Conclusion
In this chapter, we studied dynamic spectrum access technology in the coexistence
environment of primary systems and cognitive radio systems. We can conclude that the
occupancy time of channels should be shortened for cognitive radio systems rather than
decreasing offered traffic (i.e., arrival rate) since the departure rate is inverse proportion to
the occupancy time.
Moreover, we showed the performance of UWB radio system with DAA in the coexistence
environment between UWB systems and primary systems. DAA technique should be
chosen in consideration to the required performance quality of UWB applications. The
realtime applications such as verbal communication and high-quality video across the
Novel Applications of the UWB Technologies
272
wireless communication are essential to high data rate. Therefore, the unused frequency
band by the primary systems needs to allocated. In this case, the detector of UWB needs a
high detection probability. On the other hand, in the application that allows time delay,
transmitter power control to avoid the interference to primary systems is applied.
Interestingly, the BER performance of bit-interleaved convolutional coded MB-OFDM with
the transmit power control is almost identical with the ideal performance. Hence, this fact
leads that the miss-detection of the primary system may not affect the performance of the
UWB systems. Thus, DAA technology is the effective interference mitigation techniques of
high data rate UWB system.
5. Acknowledgment
This work is partly supported by Research Fellowships of the Japan Society for Promotion of
Science.
6. References
[1] A. Batra, “Time Multi-Band OFDM Physical Layer Proposal for IEEE 802.15 Task Group
3a,” IEEE P802.15-04/493r1-TG3a, Sep. 2004.
[2] FCC, ET Docket No 03-222 Notice of proposed rule making and order, Dec. 2003.
[3] Functional Requirements for the 802.22 WRAN Standard IEEE.
[4] John Polson, “Cognitive Radio Applications in software Defined Radio,”
Software Defined
Radio Technical Conference
, Phoenic, Arizona, Nov. 2004.
[5] K. Sodeyama, M. Itami, R. Kohno, “Performance Analysis of Interference Mitigation
Method for 4G Cellular Systems with MB-OFDM UWB Systems”,
The 29th
Symposium on Information Theory and Its Applications
, Nov. 2006.
[6] K. Watanabe, K. Ishibashi, R. Kohno, “An Analysis of Spectrum Management for
Coexistence of Fixed and Cognitive Radio Systems,”
2006 Software Defined Radio
Technical Conference
, Nov. 2006.
[7] M. Z. Win, R. A. scholtz, “Ultra-Wide Bandwidth Time-Hopping Spread-Spectrum
Impulse Radio for Wireless Multiple-Access Communications,”
IEEE Trans.
Commun
., vol. 48, no. 4, pp. 679?691, April 2000.
[8] Q. Zhao. B. Sadler, A Survey of Dynamic Spectrum Access,” IEEE Signal Processing Mag.,
vol. 24, no. 3, pp. 79-89, May 2007.
[9] S. Haykin, “Cognitive Radio: Brain-Empowered Wireless Communications,”
IEEE J-SAC,
vol. 23, no. 2, pp. 201-220, Feb. 2005.
[10] S. Mangold, K. Challapali, “Coexistence of Wireless Networks in Unlicensed Frequency
Bands,”
WWWRF#9 meeting, Jul. 2003.
[11] T. Zasowski, A. Wittneben, “Performance of UWB Systems using a Temporal Detect-
and-Avoid Mechanism,"
The International Conference on Ultra-Wideband, Sep. 2006.
[12] V. S. Somayazulu, J. R. Foerster, R. D. Roberts, “Detect and Avoid (DAA) Me chanisms
for UWB Interference Mitigation,”
The International Conference on Ultra-Wideband,
Sep. 2006.
Part 4
Novel UWB Applications in Medicine
14
The Future of Ultra Wideband Systems in
Medicine: Orthopedic Surgical Navigation
Mohamed Mahfouz, Michael Kuhn and Gary To
University of Tennessee,
United State of America
1. Introduction
Ultra-wideband (UWB) technology has been utilized in low probability of detection radar
and communications systems for decades since its inception from time domain
electromagnetics in the 1960s (Fontana, 2004). Interest in UWB for unique indoor
communications and positioning applications has skyrocketed since the FCC released its
notice of inquiry in 1998 and then opened up the 3.1-10.6 GHz and 22-29 GHz frequency
bands for UWB use in 2002 (FCC, 2002).
1.1 General overview of ultra-wideband technology for indoor positioning systems
A depiction of a typical indoor positioning system is shown in Figure 1 where the base
stations are connected to a master processing unit, and a reference tag is needed to bring the
mobile tag into the 3-D global coordinate frame. The use of time difference of arrival for 3-D
triangulation combined with leading-edge detection at the UWB receiver help mitigate the
stringent requirements needed in terms of base station synchronization and ranging
sensitivity to dense indoor multipath interference. Although the system architecture shown
in Figure 1 is well known and has been implemented in other wireless positioning systems
including GPS, realizing this architecture for high accuracy indoor 3-D positioning has
proven to be deceptively difficult.
Central difficulties in achieving high 3-D real-time accuracy for indoor localization systems
include indoor multipath interference, sampling-rate limitations, local oscillator phase noise,
phase center effects, system clock jitter and drift, etc. Many techniques have been proposed
for ranging in UWB positioning systems which includes (see Figure 2a): leading-edge
detection (Fontana, 2004), matched filter (Low et al., 2005), received signal strength (Ekahau
Inc, 2008), first peak detect (Alavi & Pahlavan, 2006), and peak search and subtract (Falsi et
al., 2006). The main limitation of peak detection algorithms (e.g. received signal strength,
first peak detect, and peak search and subtract) is assuming a priori information concerning
the received pulse shape. The matched filter is useful in low signal-to-noise ratio (SNR)
environments in conjunction with leading-edge detection. In realistic indoor environments
which contain significant multipath interference, this introduces large 1-D ranging errors
resulting in poor overall 3-D accuracy (Figure 2b). In many current systems, a tunnel (or
square law) diode is used at the receiver for energy detection which integrates a nanosecond
of the incoming signal, putting an upper bound of roughly 5 cm on the 1-D ranging
Novel Applications of the UWB Technologies
276
accuracy even when using leading-edge detection (Fontana, 2004). The ranging limitations
due to multipath interference are compounded with sampling rate limitations. The use of
conventional analog-to-digital converters (ADC), even if 5-10 GSPS, places an upper bound
on the 1-D ranging accuracy of 5 cm.
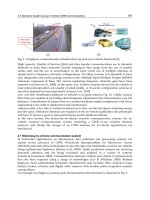
Fig. 1. A typical indoor positioning system where four or more base stations triangulate the
3-D position of a mobile tag, and a reference tag in a known location serves as a reference
point for the global coordinate frame (Mahfouz, Kuhn, Wang et al., 2011).
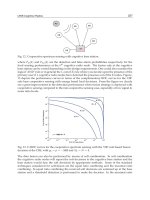
(a) (b)
Fig. 2. (a) Comparison of peak and leading-edge detection methods utilized at the UWB
receiver where the leading-edge of the multipath signal provides the highest accuracy and
does not assume a priori pulse shape information (Mahfouz, Kuhn, Wang et al., 2011), (b)
received signal where significant pulse distortion causes noticeable error in locating the
correct peak position while the leading-edge of the UWB pulse results in mm 1-D ranging
(Kuhn et al., 2010).
0246810
-40
-20
0
20
40
Peak Detection Algorithms
Leading
Edge
Voltage (mV)
Time
(
us
)
Time Extended UWB Pulse w/ Channel Effects
60 Sample Moving Average
Ideal Received UWB pulse w/ no LO offset
© 2011 IEEE
© 2010 IEEE
© 2011 IEEE
The Future of Ultra Wideband Systems in Medicine: Orthopedic Surgical Navigation
277
1.1.1 Commercial systems
As shown in Table 1, current commercial UWB systems can achieve 3-D localization
accuracy in the range of 15 – 30 cm. A comparison of the DART Ultra-Wideband system
from Zebra Enterprise Solutions and the real-time location system (RTLS) from Ubisense is
given in Table 1 (Zebra Enterprise Solutions, 2011, Ubisense, 2011). As shown in Table 1, the
two systems share many commonalities including frequency range, operating range,
compact tag size, and overall 3-D accuracy. One major difference is the method of digital
communication: the Zebra Enterprise Solutions system uses UWB pulse-based modulation
whereas the Ubisense system uses a narrowband 2.4 GHz digital communication scheme.
Although 2.4 GHz communication is a more mature technology than UWB pulse-based
modulation, it has a distinct disadvantage in that it is much more susceptible to multipath
interference and may experience severe degradation depending on the operating
environment of the system. Figure 3 shows the two commercial systems. The Zebra
Enterprise Solutions system is shown in Figure 3a including the main controller and four
hubs while Figure 3b shows two different sized tags from the Ubisense RTLS.
Company
Frequency
Range
(GHz)
Operating
Range (m)
Tag
Size
(cm
3
)
Number of
Tags
Refresh
Rate (Hz)
Localization
Method
Accurac
y
(cm)
Zebra
Enterprise
Solutions
5.94 - 7.12 > 50
1.12x
4.01x
2.11
10,000 <1-100 TDOA < 30
Ubisense 5.8 – 7.2 > 50
3.8x
3.9x
1.65
> 1000 <1-34
TDOA and
AOA
< 15
Table 1. Comparison of commercial UWB localization systems with specifications of their
compact tags.
(a) (b)
Fig. 3. Commercial indoor UWB localization systems (a) Zebra Enterprise Solutions, (b)
Ubisense.
1.1.2 Research systems
Competing technologies for high accuracy indoor positioning include frequency modulated
continuous wave (FMCW), impulse-based (i.e. carrier-free) UWB, and carrier-based UWB.
Novel Applications of the UWB Technologies
278
Table 2 provides a summary of the various research groups utilizing these three approaches
for high accuracy indoor positioning. Similar accuracy levels (0.5-20 cm) have been achieved
for both carrier-based (Meier, 2007; Mahfouz, 2008; Zhang, 2010; Waldmann, 2008;
McEwan, 2004) and impulse-based (Low, 2005; Zetik, 2004; Ossberger, 2004; Fuiji, 2007)
UWB positioning systems, although carrier-based systems have shown the potential for mm
and sub-mm range accuracy even for 3-D indoor environments (Mahfouz, 2008; Zhang,
2010; Meier, 2007; McEwan, 2004). FMCW has proven to be a successful competing
technology for high accuracy positioning systems (Stelzer, 1999, 2004; Ellinger, 2007;
Mosshammer, 2007; Tragas, 2007; Feger, 2009). In the 5.8 GHz band for industrial, medical,
and scientific (ISM) applications, documented accuracy of 5-20 cm for 2-D has been achieved
(Stelzer, 2004; Ellinger, 2007; Mosshammer, 2007; Tragas, 2007). FMCW systems operating at
higher frequencies including 35 GHz and 77 GHz have achieved accuracy levels of 0.1 mm
(Stelzer, 1999, Feger, 2009) with the system described by Feger et al. working at ranges of up
to 10 m (Feger, 2009). The most recent FMCW trend is a European-wide push to create low
power wireless sensor networks built on 5.8 GHz FMCW technology (Ellinger, 2007;
Mosshammer, 2007; Tragas, 2007; Feger, 2009).
1.1.3 Available frequency bands
Wireless medical devices, for both positioning and communication, have stringent
requirements on the frequency bands in which they can operate. Table 3 highlights the
different bands both in the United States and Europe which can be used for indoor medical
applications for both narrowband and UWB applications. UWB has available frequency
bands from 3.1 – 10.6 GHz and 22 – 29 GHz in the U.S. Only portions of that 3.1 – 10.6 GHz
band are currently available in Europe. A number of telemetry bands exist in the U.S., and
both the U.S. and Europe have instrumentation, scientific, and medical (ISM) bands
available, mainly in the 300 MHz to 3 GHz range. As shown in Table 3, in vivo telemetry
applications typically use bands in the RF and lower microwave frequency range for
operation (i.e. 315 MHz, 402 – 405 MHz, and up to 1427 – 1432 MHz in the United States
while Europe uses 433.05 – 434.79 MHz and 868 – 870 MHz). In order to understand why
telemetry bands are not allocated above 1.43 GHz, it is necessary to look at the complex
permittivity of human tissues as done in Section 1.2.1, where losses greatly increase above 1
GHz. The UWB positioning system operates from 5.4 – 10.6 GHz in the upper region of the
3.1–10.6 GHz band while most wireless telemetry systems for in vivo operate at 433.92 MHz
in the 433.05 - 434.79 European ISM band and at 315 MHz for the U.S. ISM band. As shown
in Figure 4, the allocated band in the United States goes from 3-10.6 GHz at a power level of
-41.3 dBm/MHz. Compared to Europe, where the power level is required to be at -71.3
dBm/MHz from 4.8-6 GHz, -65 dBm/MHz from 8.5-10.6 GHz, and can only be at -41.3
dBm/MHz from 3.4-4.8 GHz if detect and avoid (DAA) circuitry is implemented to
minimize interference with other wireless systems operating in this band. Figure 5 compares
the UWB bands in Japan versus the United States. Similar to Europe, the Japanese
regulations also require DAA in the 3.4-4.8 GHz band. The main difference between the
European band and the Japanese band is in the no DAA band: in Europe, this exists from 6-
8.5 GHz while in Japan, this band goes from 8.5-10.6 GHz. From looking at Figure 4 and
Figure 5, it is clear that the various restrictions imposed around the world make designing
one system for worldwide operation difficult to achieve. Multiple variations of a system
may be needed to meet the various worldwide regulations.
The Future of Ultra Wideband Systems in Medicine: Orthopedic Surgical Navigation
279
Research Group/
Company
System Architecture
Frequency
(GHz)
Reported
Error
Operating Range
Mahfouz, 2009 Carrier-Based UWB 5.4-10.6 2-5 mm (3-D) 5 m/ Indoor
Waldmann, 2008 Carrier-Based UWB 7-8 1.7 cm (1-D) 10 m/ Indoor
Meier, 2007 Carrier-Based UWB 22.58-25.7
0.1-2 mm (1-
D)
8 m/ Indoor
McEwan, 2004 Carrier-Based UWB 5.8 < 2 mm (2-D) 10 cm x 10 cm
Ossberger, 2004 Impulse-Based UWB ~2-7 5-10 mm (1-D) 5 m/ Indoor
Fujii, 2007 Impulse-Based UWB 3.7-5 20 cm (2-D) 8 m/ Indoor
Low, 2005 Impulse-Based UWB 3.2-5.2 1 cm (1-D) 8 m/ Indoor
Zetik, 2004 Impulse-Based UWB 0.01-5 1.5 cm (2-D) 2 m/ Indoor
Stelzer, 1999
FMCW and
Interferometry
35 0.1 mm (1-D) < 1 m/ Indoor
Stelzer, 2004 FMCW 5.8 10 cm (2-D) 500 m/ Outdoor
Ellinger, 2007
Mosshammer,
2007
FMCW 5.8 18 cm (2-D) 40 m/ Indoor
Feger, 2009 FMCW 77 0.1 mm (1-D) 1.5 m/Chamber
Table 2. Comparison of current research high accuracy positioning systems.
Location Frequency Band Frequency (MHz)
U.S.
Medical Implant Communications
Service
402 - 405
U.S. Wireless Medical Telemetry Service 608 – 614; 1395 – 1400; 1427 - 1432
U.S.
Instrumentation, Scientific, and Medical
(ISM)
315; 902 – 928; 2400 – 2483.5;
5150 – 5875
Europe ISM
433.05 - 434.79; 868 - 870 (short-range)
2400 - 2483.5
U.S. UWB
3.1 – 10.6 GHz; 22 – 29 GHz, center
freq > 24.075 GHz
Europe UWB 3.4 – 4.8 GHz; 6 – 8.5 GHz
Japan UWB 3.4 – 4.8 GHz; 8.5 – 10.6 GHz
Table 3. Summary of licensed medical wireless frequency bands.
Novel Applications of the UWB Technologies
280
Fig. 4. Comparison of allocated UWB bands between 3-11 GHz in the U.S. versus Europe
(Mahfouz & Kuhn, 2011).
Fig. 5. Comparison of allocated UWB bands between 3-11 GHz in the U.S. versus Japan.
1.2 Microwave interaction with biological tissues
The electrical characteristics of biological tissues change dramatically from DC through
higher frequencies such as X-ray and gamma radiation. At very low frequencies (the kHz
range), the primary means through which electrical current travels through the body is
conduction via the extracellular matrix. At the visible frequency range and even higher in
ultraviolet (UV) and X-ray frequency ranges, most electromagnetic waves are able to pass
through biological tissues, with differing amounts of energy being absorbed by different
tissues. Between these two extremes lie the RF/Microwave frequency bands. Electrical
properties of biological tissues change dramatically over this frequency range. There are
specific techniques, such as coaxial probe dielectric measurements, which can be followed to
apply a uniform method for electrical characterization of biological tissues (or other lossy
media) over this frequency range.
© 2011 IEEE
The Future of Ultra Wideband Systems in Medicine: Orthopedic Surgical Navigation
281
RF/Microwave radiation is considered from 100 kHz – 300 GHz. Although the interaction
of radiation with biological tissues changes significantly over this range, there are some
similar properties that provide coherence for grouping RF/Microwave frequencies
together. First, over this whole frequency range radiation can be considered non-ionizing.
Ionizing radiation includes UV and X-ray, and these frequency ranges are characterized
by disruption of atomic structures. Second, it is convenient and useful to use
RF/Microwave frequencies for the purpose of radiating electromagnetic (EM) energy. At
low frequencies (LF) and extremely low frequencies (ELF), the wavelength of the
transmitting signal is much larger than the structures used in transporting it. Radiation at
LF and ELF is not typically seen. Conversely, the wavelengths in the RF/Microwave
range are comparable to their corresponding transmission lines (millimeter to meter in
size), which makes them ideal for radiation applications. Central to designing a
microwave system which utilizes biological tissues as a transmission medium is a
thorough understanding of the electrical properties of the tissues that will be exposed to
the EM energy. An enormous amount of research has been done in this area. This has
included use of a wide range of measurement techniques, testing on many different types
of animals as well as humans, and testing of biological tissues in different environments
(e.g. in vivo, in vitro, over a range of temperatures, etc.).
1.2.1 Complex permittivity
The complex permittivity is a common method used to characterize the electrical properties
of an arbitrary medium. Combined with other electrical parameters, such as conductivity
and skin depth, it can be used to provide complete electrical characterization. (1) shows the
basic definition of complex permittivity
∗
=
−" (1)
where the first term, ’, represents the capacitive nature of the tissue (amount of charge
stored in it) while ” characterizes the lossy nature of the medium. Using these two terms, it
is possible to calculate and , which can then be used to characterize how an EM wave
behaves inside the medium (Vorst, 2006). (2) defines the loss tangent where ω is the
angular frequency, σ is the conductivity, and
,
,
,,
are defined in (1). (3) describes how to
calculate and using the wavelength in free space
, is the loss tangent, and
′
is
the relative permittivity. (4) shows how the time and distance varying electrical field (,)
is calculated using and .
,,
,
tan
(2)
'
2
'
2
2
(1 1
2
2
(1 1
2
o
o
tan
tan
(3)
()
0
(,)
j
t
j
z
Ezt Ee
(4)