Conductive Polymers and Plastics in Industrial Applications Part 11 doc
Bạn đang xem bản rút gọn của tài liệu. Xem và tải ngay bản đầy đủ của tài liệu tại đây (336.04 KB, 20 trang )
POLY(3-OCTYLPYRROLE)
Work is underway to explore the corrosion properties of poly(3-octylpyrrole) (POP) on alu-
minum alloys. This polymer (prepared at IPRI, Wollongong) is soluble in several organic sol-
vents. Films prepared by solvent casting from solutions of POP dissolved in CH
2
Cl
2
/CCl
4
exhibit good adhesion to aluminum using the tape pull-off test. Thin films prepared by spin
coating techniques will also be evaluated. These substrate/film interfaces are currently being
probed using EIS and the effects of prolonged immersion in dilute Harrison solution will be
assessed. Immersion experiments in which epoxy and urethane top coats are applied over ei-
ther a PVP/SPANI or a POP film are planned, and results of this work will be reported in due
course.
ACKNOWLEDGMENTS
We gratefully acknowledge the Intelligent Polymer Research Institute of the University of
Wollongong, Dr. Gordon G. Wallace, Director, for collaboration on portions of this work.
REFERENCES
1 G. Mengoli et al., J. Applied Polymer Science, 26 (1981) 4247.
2 S.P. Sitaram, J.O. Stoffer and T.J. O’Keefe, J. Coatings Technology, 69 (1997) 65-69.
3 W-K. Lu, R. L. Elsenbaumer and B. Wessling, Synthetic Metals, 71 (1995) 2163-2166.
4 B. Wessling, S. Schroder, S. Gleeson, H. Merkle, S. Schroder and F. Baron, Materials and Corrosion, 47 (1996) 439-445.
5 P.J. Kinlen, D.C. Silverman and C.R. Jeffreys, Synthetic Metals, 85 (1997) 1327-1332.
6 D.E. Tallman and G.G. Wallace, Synthetic Metals, 90 (1997) 13-18.
Corrosion Inhibition of Aluminum and Steel 207
Novel Electrically Conductive Injection Moldable
Thermoplastic Composites For ESD Applications
Moshe Narkis
Department of Chemical Engineering, Technion - Institute of Technology, Haifa, Israel
Gershon Lidor, Anita Vaxman and Limor Zuri,
Carmel Olefins Ltd, Haifa, Israel
INTRODUCTION
Electronic components are susceptible to damage from electrostatic discharge (ESD). The an-
nual losses in products containing sensitive electronic components and subassemblies due to
ESD during manufacturing, assembly, storage and shipping has been estimated in billions of
dollars.
1
A variety of materials has been developed to package sensitive electronic devices and
prevent damage during storage and shipping. The Electronic Industry Association (EIA) clas-
sifies packaging materials according to their surface resistivity as being either conductive,
dissipative, or insulative. According to EIA standards, conductive materials have a surface
resistivity of less than 1.0x10
5
ohms/sq, dissipative materials have a surface resistivity from
1.0x10
5
to 1.0x10
12
ohms/sq and insulative materials have a surface resistivity greater than
1.0x10
12
ohms/sq. For many articles in ESD protected environments the optimal surface re-
sistivity is in the range of 10
6
-10
9
ohms/sq.
2,3
Even higher values may be accepted if the
article is capable of dissipating charge fast enough. Too high surface resistivity results in an
uncontrolled discharge.
2,3
There is a number of mechanisms by which a polymeric material can be made conduc-
tive, static dissipating or antistatic. The conventional methods are through painting or
coating, the addition (internal or external) of hygroscopic materials, or conductive fillers.
Electrostatic dissipating thermoplastic compounds have successfully eliminated electrostatic
discharge failures in many applications in the electronics industry. A variety of conductive
fillers is presently available to material engineers, including carbon blacks (CB), carbon fi-
bers (CF), metallic powders, flakes or fibers, and glass spheres or glass fibers coated with
metals. For a given polymeric compound, electrical conductivity is determined by the
amount, type and shape of the conductive fillers.
4,5,6
The critical amount of filler necessary to
initiate a continuous conductive network is referred to as the percolation threshold, which
varies from polymer to polymer for a given CB type. A small increase of the filler concentra-
tion has a much smaller effect and subsequently a plateau is reached. Although percolative
systems can easily give highly conductive compounds, it is difficult to reliably attain desired
intermediate conductivities levels required for ESD applications, due to the steepness of the
resistivity vs. CB concentration curve. The conductivity of such compounds depends not only
on the CB concentration and morphology, but also on the specific polymer matrix used and
the generated morphology.
7,8,9,10
Carbon black loaded static controlling products usually contain 15 to 20 wt% CB by
weight. Local variation of the concentration of the conductive additives can result in conduc-
tive and insulative regions in the same product. Contamination is also an important issue
since, in highly filled CB compounds, the carbon powder tends to slough and thus contami-
nate the environment. There is a challenge in developing cleaner injection moldable
compounds with consistent surface resistivity in the static dissipative range.
The CarmelStat new technology is based on combining a number of polymeric materials
with glass fibers and CB to produce a uniform, multi-phase thermoplastic composite with
consistent electrical and mechanical properties.
11
When compared with the currently avail-
able static dissipative plastics, based on CB, CF, or surface coating of molded parts, this new
technology offers many advantages, i.e., a combination of permanent and consistent resistiv-
ity levels of 10
6
-10
9
ohms/sq, achieved with about 1 wt% CB, a controlled stiffness/impact
balance, and a high heat deflection temperature.
This chapter describes new thermoplastic composites for injection molding, containing
CB or CB/CF in relation to their electrical and mechanical behavior, as compared to the exist-
ing CB filled thermoplastic compounds.
EXPERIMENTAL
The conductive composites were prepared in a co-rotating twin screw extruder (Berstorff, 25
mm, L:D = 28:1) and subsequently injection molded (Battenfeld, 80 ton).
Commercial grades of polypropylene (PP), polyethylene (PE) and polystyrene (PS)
(Carmel Olefins, Israel) and Noryl (GE, USA) were used in this study. The following carbon
blacks were used: Ketjenblack EC 600 JD (Akzo, The Netherlands), Printex XE 2 (Degussa,
Germany), Black Pearl 2000 (Cabot) and Conductex 975 (Columbian Chemical). The short
glass fibers used had a length of 3 mm and a diameter of 10 microns (Vetrotex, Owen
Corning). The carbon fibers used had a length of 6 mm (Tenax, Germany).
210 Conductive Polymers and Plastics
The surface and volume resistivity of injection molded samples (discs or bars) was
tested using procedures described in EOS/ESD S11.11 and EIA 541, based on ASTM D 257,
using a Keithley 6517 or 2400 Electrometer which was connected to a concentric (guarded
ring) fixture (Keithley, Model 8009), or a 4- point-probe (in the latter method silver paint was
used to eliminate the contact resistance). Each reported value is an average of six test speci-
mens.
The ASTM test methods D638, D790 and D256 were used to determine mechanical
properties, ASTM D648 for the thermal properties and ASTM D792 and D570 for density
measurements. Each reported value is an average of five test specimens.
The Taber abrasion test was used to characterize the abraded average volume loss. This
test (ASTM D1044) involves subjecting a molded plaque to contact with a rotating abrasive
wheel (CS-10) undera1kgload for 1000 cycles.
The material's contamination potential was evaluated by extraction in deionized water at
80
o
C. The water was then analyzed for leachable anions by an inductively coupled mass spec-
troscopy (IC/MS) (Dionex 4500i). Total metals was detected by atomic absorption
spectrometer (Perkin Elmer AAS 3100).
RESULTS AND DISCUSSION
ELECTRICAL PROPERTIES
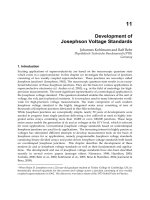
The influence of CB content on volume resis-
tivity (EOS/ESD S11.11) of an injection
molded PP composite, compared with the re-
sistivity of reference unreinforced PP com-
pounds containing different CB grades, is
presented in Figure 1. The characteristic insu-
lating to conducting transition is observed for
all the systems studied. The percolation con-
centration for the CarmelStat composite oc-
curs at about 1 wt% CB, significantly lower
compared with the reference CB filled PP
compounds. From Figure 1 it is evident that
the resistivity values of the new CarmelStat
material are well within the ESD range (10
6
-
10
9
ohms/sq) at a CB concentration of 1-1.5
wt%. The resistivity of all the other
unreinforced compounds, at 1-1.5 wt% CB
exceeds 10
12
ohms/sq. Figure 1 shows that the
Novel Conductive Composites 211
Figure 1. Resistivity vs. carbon black content of an injection
molded CarmelStat composites and polypropylene
compounds containing different carbon black types.
general shape of the resistivity-concentration curves for the CB grades studied is similar and
the critical CB concentrations fall below 10 wt %. Thus, it has been confirmed that in CB
filled polymers, at low CB concentrations the CB particles are isolated and the electrical re-
sistance is high, while beyond a critical loading (greater than 10 wt%), particles form struc-
tures which provide an electrical network through the insulative polymer matrix. Small
changes in filler concentration correspond to multiple order of magnitude changes in the elec-
trical resistivity. The lowest concentration was found for the filled PP compounds containing
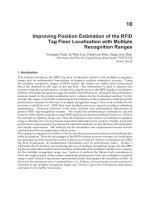
high structure EC 600 carbon black (about 4 wt%). The superior behavior of EC 600 is also
indicated in Figure 2, where the influence of several CB grades on the volume resistivity of
CarmelStat composites is presented. To achieve the ESD range (10
6
-10
9
ohms/sq) higher
concentrations of Printex XE2, Cabot 2000 and Conductex 975, are required compared with
EC 600. EC 600 was thus chosen for the further experiments because it provides resistivity
levels in the 10
6
-10
9
ohms/sq range at the lowest CB contents.
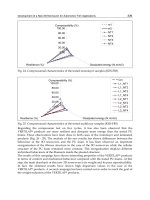
Figure 3 shows the percolation behavior of different polymer matrices containing EC
600. It is evident that the PP compound needs the lowest amount of CB compared with PE, PS
or HIPS to generate resistivities in the 10
6
-10
9
ohms/sq range. Table 1 summarizes the prop-
erties of different conductive thermoplastic composites based on the CarmelStat technology.
212 Conductive Polymers and Plastics
Figure 2. Resistivity vs. carbon black content of injection
molded CarmelStat composites containing various carbon
black types.
Figure 3. Resistivity as function of EC 600 loading for different
matrices.
MECHANICAL PROPERTIES
Table 2 depicts mechanical properties of PP composites with 1 - 1.5 wt% CB as a function of
glass fiber content. Tensile strength and modulus, and the flexural modulus increase with fi-
ber content. Table 2 also shows that CarmelStat exhibits a consistent surface resistivity in the
static dissipating range. The consistency occurs over a wide range of glass fiber concentra-
tions thus also assuring control of the other material properties.
Table 3 compares commercial conductive PP compounds with CarmelStat materials.
The electrical properties data indicate that the other materials are in the conductive or static
dissipative category. The mechanical properties data shown indicate that the CarmelStat
composite is significantly stiffer and stronger than the other PP compounds, which results in
Novel Conductive Composites 213
Table 1. Properties of injection molded CarmelStat composites containing
about 1 wt% carbon black, based on various matrices
Property
Base resin
PP PS HIPS PE Noryl
Specific gravity, kg/m
3
1.082 1.22 1.21 1.07 1.24
Water absorption (24 h, room temp), % 0.04 0.13 0.14 0.06 0.17
Tensile modulus, MPa 2634 3650 2630 746 3382
Tensile strength, MPa 56.2 66 61 19.3 64
Flexural modulus, MPa 4684 7100 6410 1663 6501
Izod impact, notched, J/m 77 51 47 80 38
Volume resistivity, ohm-cm 1.6x10
6
7.0x10
7
3.1x10
9
2.6x10
9
2.0x10
11
Surface resistivity, ohm/sq 1.1x10
7
7.3x10
7
2.8x10
7
2.8x10
8
4.2x10
10
Table 2. Properties of CarmelStat PP composites containing 1 - 1.5 wt% car-
bon black as function of glass fiber content
Property
% GF by weight
10 15 21 25
Specific gravity, kg/m
3
0.981 1.025 1.082 1.212
Tensile modulus, MPa 1771 2030 2634 3133
Tensile strength, MPa 39.4 44 56.2 58
Flexural modulus, MPa 3054 3801 4684 5394
Izod impact, notched, J/m 64 69 77 71
Volume resistivity, ohm-cm 1.9x10
7
1.7x10
7
1.6x10
6
2.0x10
6
Surface resistivity, ohm/sq 2.7x10
7
1.3x10
7
1.1x10
7
5.7x10
6
lower particle shedding and better dimensional stability. Carbon powder is a particulate filler
which reduces the mechanical strength of a thermoplastic base resin compound and thus
lower CB concentrations are an advantage. Moreover, at high CB concentrations, as in the
commercial compounds, the release of carbon particles against a counter-face, commonly
called “sloughing”, may make carbon powder compounds unsuitable for some applications.
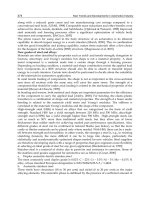
INFLUENCE OF CARBON FIBERS (CF)
Addition of CF to the polymer/CB/glass fiber composites results in higher conductivities and
enhancement of some mechanical properties.
12
Figure 4 shows a significant decrease in resis-
tivity by incorporation of up to 17 wt% CF, to CarmelStat composites containing about 1.2
wt% CB and 20 wt% glass fibers.
INFLUENCE OF POLYPROPYLENE GRADE
To determine if changes in melt viscosity of the base polymer affect the composite conductiv-
ity, three melt flow index (MFI) grades of PP were compounded with 25 wt% glass fibers and
1 wt% CB. Figure 5 reveals that a higher MFI is useful for achieving lower resistivity. Figure
5 also shows that the flexural modulus is practically independent of MFI. CarmelStat com-
posites were prepared with different PP types (homopolymer and copolymer). Table 4 shows
that a conductive composite based on PP copolymer, demands a higher CB loading to reach a
resistivity level similar to the homopolymer based composites. Thus, the presence of rubber,
as shown in Table 4, increases the impact resistance, however the conductivity of the compos-
ite decreases. Carbon black in the rubber containing composites tends to concentrate more in
214 Conductive Polymers and Plastics
Table 3. Properties of CarmelStat composites compared with commercial
compounds
Property
Carmel
Olefins
Carmel
Stat
CS1015
Carmel
Olefins
Carmel
Stat
CS1115
Premix
Pre-Elec
PP1370
Lati
Latistat
57/7-02
Cabot
Cabelec
CA3839
RTP
ESD-A
-100
LNP
Stat-Kon
MHI
Specific gravity, kg/m
3
1.01 1.01 0.98 .94 96 1.05 .97-1.01 1.00
Tensile strength, MPa 55 20 18 30 20 23.4 37
Flexural modulus, MPa 3300 2300 1200 2100 865 1241 1100
Izod impact, notched, J/m 57 125 24 25 18 425 500-700
Heat distortion temp. (045
MN/m
2
),
o
C
160 155 90 115 56 127 87
Volume resistivity, ohm-cm 10
6
-10
7
10
7
-10
8
<10
3
10
2
10
4
10
3
-10
9
10
2
-10
4
Surface resistivity, ohm/sq 10
6
-10
7
10
7
-10
8
<10
4
10
2
10
7
10
3
-10
12
10
2
-10
4
the elastomeric phase rather than forming conductive paths. The distribution of CB in PP/rub-
ber compounds (40 wt% polymer, 20 wt% rubber, 40 wt% conductive filler) was studied by
Haddadi.
13
This study has shown that part of the conductive filler transferred into the rubber
phase and thus about 19 wt% CB was located in the rubbery phase of the compound.
CLEAN ROOM APPLICATION
Free particles adversely affect semiconductor performance. Particles added to the wafers dur-
ing fabrication are the result of contact between the wafers and the wafer carriers. Reduction
Novel Conductive Composites 215
Figure 4. Resistivity and flexural modulus vs. carbon fiber
content, for CarmelStat composites containing 1.2 wt%
carbon black and 20 wt% glass fibers (4-point probe method).
Figure 5. Resistivity and flexural modulus of CarmelStat
composites containing 1.2 wt% carbon black and 25 wt% glass
fiber for PP with different melt flow index (MFI).
Table 4. The influence of polypropylene type (homopolymer vs. copolymer) on
surface resistivity and impact resistance of CarmelStat composites
Homopolymer Copolymer
Carbon black, wt% 1.2 1.2 3.7 4.6 4.8 5.1
Glass fibers, wt% 15.4 15.4 10 15.4 10 10
Surface resistivity, ohm/sq 10
6
>10
12
10
8
10
6
10
5
10
4
Izod, notched, J/m 57 117 140 115 140 135
of the number of such released particles is obviously achieved by using wafer carriers that
generate fewer particles. In our study, the Taber abrasion test was used to characterize the par-
ticle shedding performance of the CarmelStat materials. Figure 6 shows the volume loss of a
CarmelStat material compared with some other conductive compounds for clean room appli-
cations.
14
The data from this Figure reveal that CarmelStat shows better abrasion resistance
than the CB filled PP (black PP and Stat-Pro 100) compounds and has similar low particle
generation as carbon fiber filled PP (Stat-Pro 175).
Clean room materials utilized in storage boxes and wafer carriers, should have the poten-
tial of least ion contamination. The concentrations of leachable anions and metal were
investigated in different CarmelStat PP. From Table 5 it is obvious that compound III is the
most suitable for clean room applications, since it has the lowest contamination level com-
pared with the other composites.
CONCLUSIONS
Static dissipative injection moldable polymer composite materials have been characterized.
Composites with consistent resistivity in the range of 10
6
-10
9
ohms/sq can be prepared based
on combining a number of polymeric materials with glass fibers and about 1 wt% CB.
Mechanical properties of CB filled thermoplastics can be tailored by reinforcing the
polymer with glass fibers and by modifying the polymer with rubber. Such materials can be
216 Conductive Polymers and Plastics
Figure 6. The volume loss, Taber abrasion, of a CarmelStat
composite material compared with commercial compounds.
Table 5. Contamination levels of
CarmelStat composites, PP containing
15 wt% glass fibers and 1 wt% carbon
black (surface resistivity of 10
6
ohm/sq)
Parameter
Different composites
I II III
Leachable anions
Cl, ppb
SO
4
, ppb
1680
260
280
120
120
840
Metal composition
Al, ppm
Ca, ppm
Mg, ppm
Na. ppm
3900
9700
150
840
470
3200
45
540
53
280
8
69
designed for applications in a variety of industries where control of static and contamination
is required.
REFERENCES
1 S. Paul Singh and H. El-Khateeb, Packaging Technology and Science, 7, (1994).
2 K. Vakiparta, EOS/ESD Symposium, 229 (1995), Phoenix.
3 R. W. Cambell and W. Tan, EOS/ESD Symposium, 218 (1995), Phoenix.
4 M. Narkis, A. Ram and F. Flashner, J. Appl. Polym. Sci., 22, 1163 (1978).
5 M. Narkis, A. Ram and Z. Stein, J. Appl. Polym. Sci., 25, 1515 (1980).
6 M. Narkis and A. Vaxman, J. Appl. Polym. Sci., 29, 1639 (1984).
7 Carmona, The Second International Conference on Carbon Black, 213 (1993), Mulhouse.
8 Lee, Journal of Vinyl Technology, 15, 173 (1993).
9 S. Petrovic, B. Martinovic, V. Divjakovic and J. Budinski-Simendic, J. Appl. Polym. Sci., 49, 1659 (1993).
10 R. Tchoudakov, O. Breuer, M. Narkis and A. Siegmann, Polym. Networks and Blends, 6, 1 (1996).
11 M. Narkis, R. Tchoudakov, A. Siegmann and A. Vaxman, “Electrically Conductive Compositions and Methods for
Producing Same”, USA patent application (1996).
12 P. Johnes, I. Emami, J. Goodman and K. Mikkelsen, Microcontamination, January (1993).
13 V. Haddadi-Asl, Iranian Polymer Journal, 5, 75 (1996).
14 J. Mikkelsen, Microcontamination, March, (1996).
Novel Conductive Composites 217
Electrical Properties of Carbon Black-Filled
Polypropylene/Ultra-High Molecular Weight
Polyethylene Composites
Jiyun Feng and Chi-Ming Chan
Department of Chemical Engineering, The Hong Kong University of Science and Technol-
ogy, Clear Water Bay, Kowloon, Hong Kong
INTRODUCTION
An important issue considered in the preparation of carbon black (CB)-filled conductive
polymer composites is the CB content. To maintain balanced properties of the composites, the
CB content must be kept as low as possible otherwise the processing of the composite is diffi-
cult, the mechanical properties are very poor, and the total cost is higher. Thus, the method of
reducing CB content is a major research subject in this field.
It has been found that an effective way to reduce CB content in CB-filled conductive
polymer composites is the use of binary immiscible polymer blends as polymer matrix.
1-8
In
CB-filled immiscible polymer blends, CB particles can be controlled to be selectively local-
ized in one polymer phase or at the interface of immiscible polymer blends due to different
affinities of CB for different polymers during the processing of the composites. For instance,
Gubbels
5
studied CB-filled PE/PS blends and selectively localized CB particles at the inter-
face of PE/PS blends by kinetic control. The percolation threshold for the CB-filled
PE/PS(45/55) composites is only 0.002 volume fraction of CB, which is much lower than that
of CB-filled conventional polymer composites. This result also indicates that the use of im-
miscible polymer blends is a promising approach to prepare CB-filled conductive polymer
composites with a very low percolation threshold.
In this investigation, CB-filled PP/UHMWPE composites were prepared by the conven-
tional melt mixing method, the electrical properties of the composites including the PTC
effect and the CB distributions in the PP/UHMWPE matrix were studied.
EXPERIMENTAL
The polymers used in this investigation were PP (Profax PD382 from Himont) and
UHMWPE (Hifax1900 from Montell). The CB was V-XC72 from Cabot. The CB-filled
PP/UHMWPE composites were prepared using a Haake mixer at 200
o
C and 30 rpm for 15
minutes. The mixed materials were further compressed into 2 mm thick sheets using a hot
press at 200
o
C and 16 MPa.
The resistivity of the composites was determined by a multimeter. Prior to the measure-
ments, the sample surfaces were coated with a layer of silver paint to eliminate the contact
resistance. The resistivity of the composites versus temperature was determined by a comput-
erized system, which comprises a multimeter, a computer and a programmable oven. The
heating rate used was 2
o
C/min. The CB distributions in the composites were studied by opti-
cal microscopy using the transmission mode. Thin sections of 1
µ
m in thickness were cut by a
cryomicrotome at -100
o
C.
RESULTS AND DISCUSSION
ELECTRICAL RESISTIVITY
The electrical resistivity of CB-filled PP/UHMWPE composites with a fixed CB content (10
wt%) as a function of UHMWPE content in the PP/UHMWPE matrix is depicted in Figure 1.
Obviously, the UHMWPE content significantly influences the resistivity of the composites.
As the UHMWPE content increases, the resistivity of the composites decreases remarkably,
reaching a minimum value when the UHMWPE content attains 50 wt%, then increases when
the UHMWPE content further increases. Basically, the addition of UHMWPE particles to the
PP matrix influences the electrical resistivity of the composites in two aspects. Due to the
fixed CB content and extremely high viscosity of UHMWPE particles, CB particles can only
be localized at the interface between PP matrix and UHMWPE particles or in the PP matrix.
Hence, the addition of UHMWPE in the composites results in an increase in the CB content in
the PP matrix which is the continuous phase, leading to a decrease in resistivity. On the other
hand, the addition of UHMWPE particles gives rise to a significant increase in viscosity and
shear strength of the polymer melt. The strong shear strength can break down the secondary
structure of CB, resulting in an increase in resistivity. Accordingly, the higher the amount of
UHMWPE in the composites, the higher is the resistivity of the composites. This is consistent
with the results when the UHMWPE content is higher than 50 wt% as shown in Figure 2.
Thus, by the combination of the two effects, when the UHMWPE content is lower than or
equals 50 wt% in the polymer matrix, the increase in CB content in the PP matrix dominates
the electrical resistivity of the composites while when the UHMWPE content is higher than
220 Conductive Polymers and Plastics
50wt%, the break down of the secondary structure of CB dominates the electrical resistivity
of the composites.
The effect of the CB content on the electrical resistivity of CB-filled PP/UHMWPE(1/1)
composites is illustrated in Figure 2. Apparently, when the CB volume fraction reaches about
1 v%, a sharp decrease in resistivity occurs. Using the percolation theory, the percolation
threshold of the composites is determined to be 0.8% volume fraction of CB with the best fit.
This value is much lower than that of conventional CB-filled single polymer composites.
Thus, PP/UHMWPE (1/1) matrix is a good polymer matrix for the preparation of CB-filled
polymer composites with a very low percolation threshold by the conventional melt-mixing
method.
PTC EFFECT
In addition to electrical resistivity, the PTC effect is another important electrical property of
CB-filled semicrystalline composites. Figure 3 shows the log resistivity of CB-filled
PP/UHMWPE (1/1) composites with various CB contents as a function of temperature.
Clearly, two sharp jumps in resistivity are observed at about 140 and 170
o
C. This is a novel
physical phenomenon, which is different from the PTC behavior of CB-filled single
semicrystalline polymer composites. This effect is referred to as the double-PTC effect. The
Electrical Properties 221
Figure 1. Log resistivity of CB-filled PP/UHMWPE
composites vs. UHMWPE content in PP/UHMWPE matrix.
Figure 2. Log resistivity of CB-filled PP/UHMWPE
composites vs. CB volume fraction.
first jump in resistivity is defined as the first PTC effect and the second jump in resistivity as
the second PTC effect. According to the mechanism of the PTC effect of CB-filled single
semicrystalline polymer composites, the first PTC effect and the second PTC effect are attrib-
uted to the large thermal expansion as a result of the melting of UHMWPE and PP crystallites,
respectively. These results also illustrate that the formation of conductive networks is related
to the UHMWPE particles in the composites. One possibility is that CB particles may accu-
mulate around the UHMWPE particles especially when the CB content is low due to the ther-
modynamic driving force.
5
In this case, as the temperature increases to the melting point of
UHMWPE, the UHMWPE particles melt and expand significantly, breaking down most con-
ductive pathways around them and resulting in a sharp jump in resistivity, as shown in Figure
3. As CB content increases, CB particles are forced to be dispersed in the PP matrix when all
interfaces between PP and UHMWPE particles are occupied by CB particles. In this case,
most conductive pathways are formed in the PP matrix. This is the reason for the fact that as
CB content increases, the first PTC effect of the composites becomes weaker. It should be
noted that after the second PTC effect, a sharp negative temperature coefficient (NTC) effect
occurs. This NTC effect is due to the formation of new conductive pathways which is similar
to that of CB-filled single semicrystalline polymer composites without crosslinking.
To study the effect of the PP/UHMWPE weight ratio on the PTC effect of CB -filled
PP/UHMWPE composites, the composites with a low PP/UHMWPE weight ratio (3/7) and
222 Conductive Polymers and Plastics
Figure 3. Log resistivity of CB-filled PP/UHMWPE (1/1)
composites vs. temperature.
Figure 4. Log resistivity of CB-filled PP/UHMWPE (3/7)
composites vs. temperature.
various CB contents were studied. Figure 4
depicts the log resistivity of the composites
versus temperature. Clearly, the double-PTC
effect is also observed even though the sec-
ond PTC effect becomes weaker as the CB
content increases. The reason for this fact is
that as the PP/UHMWPE weight ratio sig-
nificantly decreases, the PP content also
decreases. Hence, the thermal expansion due
to the melting of PP crystallites decreases,
resulting in a weaker second PTC effect. A
new and important observation for the com-
posites lies in the fact that they do not exhibit
any NTC effects, which is different from that
of the composites with a high PP/UHMWPE
weight ratio. The reason for the elimination
of NTC effect may be due to the very high
concentration of CB in the PP matrix as the PP/UHMWPE weight ratio is lower, which results
in a high viscosity of the composites, hindering the formation of new conductive pathways
and eliminating the NTC effect.
CB DISTRIBUTIONS IN THE PP/UHMWPE MATRIX
To determine the CB distributions in the PP/UHMWPE matrix, optical microscopy was used.
Figure 5 displays the optical micrograph of 1.0 wt% CB-filled PP/UHMWPE (1/1) compos-
ites. Clearly, a two-phase structure is observed. The light areas are identified as the
UHMWPE particles due to the fact that CB particles cannot enter UHMWPE particles as a re-
sult of extremely high viscosity of the UHMWPE. These UHMWPE particles form the dis-
persed phase. While the grey areas are identified as the PP matrix and they form the
continuous phase. It is interesting that around the UHMWPE particles, dark rings are ob-
served, indicating that CB particles accumulate at the interface between PP matrix and
UHMWPE particles. This observation is in agreement with the above discussions. Thus, this
result confirms that CB particles are not only localized in the PP matrix but also accumulate at
the interface between PP matrix and UHMWPE particles.
According to Sumita’s results,
3,4
when CB particles are mixed with PP/HDPE blends,
they are selectively localized in the HDPE phase. Thermodynamically, CB particles have
stronger affinity for HDPE than for PP. In the case of CB-filled PP/UHMWPE composites, al-
though thermodynamically CB particles preferentially enter UHMWPE particle, in practice
they can only reach and accumulate at the interface of UHMWPE particles and cannot go in-
Electrical Properties 223
Figure 5. An optical micrograph of 1.0 wt% CB-filled
PP/UHMWPE (1/1) composite.
side the UHMWPE particles due to their extremely high viscosity of UHMWPE. Finally,
CB-rich regions are formed at the interface between PP matrix and UHMWPE particles. The
results suggest that by the combination of kinetic and thermodynamic factors, the selective
localization of CB particles in immiscible polymer blends can be tailored and obtained.
CONCLUSIONS
Our results indicate that the PP/UHMWPE weight ratio and CB content are the two main fac-
tors that can significantly influence the electrical resistivity of the CB-filled PP/UHMWPE
composites. At a fixed CB content (10 wt%), a minimum value in resistivity is observed at the
PP/UHMWPE weight ratio of 1/1. At a fixed PP/UHMWPE weight ratio (1/1), a percolation
threshold of 0.008 volume fraction of CB is observed which is much lower than that of con-
ventional CB-filled polymer composites.
The measurements of resistivity of the composites versus temperature depict that the
stronger double-PTC effects are observed at low CB content and low PP/UHMWPE weight
ratio. The melting of UHMWPE crystallites at about 140
o
C and the melting of PP crystallites
at about 170
o
C are responsible for the first PTC effect and the second PTC effect, respec-
tively.
The results of the optical microscopy studies illustrate that CB particles are selectively
localized at the interface between PP matrix and UHMWPE particles or in the PP matrix due
to the extremely high viscosity of UHMWPE.
ACKNOWLEDGMENT
This work was supported by UPGC Research Infrastructure Grant under Grant No. RI93/94E.
REFERENCES
1 B. Wessling, Kunststoffe, 76, 930 (1986).
2 G. Genskens, E. De Kezel, S. Blacher and F. Brouers, Eur. Polym. J., 27, 1261 (199 1).
3 M. Sumita, K. Sakata, S. Asai, K. Miyasaka, and H. Nakagawa, Polym. Bull., 25, 265 (1991).
4 M. Sumiata, K. Sakata, H. Nakagawa, S. Asai, K. Miyasaka, and M. Tnaernura, Colloid Polym. Sci., 270, 134 (1992).
5 F. Gubbels, R. Jermore, Ph. Tessie, E. Vanlathern, R. Detour, A. Calderon, V. Parente, and J. L. Breads, Macromolecules,
27, 1972(1994).
6 M. Narkis, R. Tchoudakov, and O. Breuer, ANTEC’95 P1343-1346.
7 R. Tchoudakov, O. Breuer, M. Narkis, and A. Siegaman, Polym. Eng. Sci., 36, 1336(1996).
8 J. Feng and C M Chan, Polym. Eng. Sci. In press.
224 Conductive Polymers and Plastics
The Use of Conducting Polymer Composites in
Thermoplastics for Tuning Surface Resistivity
Sam J. Dahman
RTP Company, Winona, MN
Jamshid Avlyanov
Eeonyx Corporation, Pinole, CA
INTRODUCTION
Electrostatic discharge (ESD) is an issue well known to those in the electronics industry.
l
ESD
can lead to expensive catastrophic and latent failures in sensitive electronic devices. Losses
due to ESD events have been estimated into the billions of dollars.
2
With rapid miniaturization, electronic components have become increasingly suscepti-
ble to ESD. Furthermore, plastics have become the materials of choice in the manufacturing
and packaging of electronics. Unfortunately plastics are insulators, which increases the likeli-
hood of ESD events. Sufficient charge is then able to accumulate with the possibility of a
sudden discharge causing damage to sensitive electronic components. Thus, there is a need
for plastics that control ESD.
Static dissipative thermoplastics have successfully met the requirements for ESD con-
trol in a number of applications for the electronics industry. These applications include but are
not limited to tote boxes, matrix trays, chip carriers, cassettes, card enclosures, fibers, etc.
Static dissipative thermoplastics offer many advantages for ESD protection over other mate-
rials such as metals. For instance, finished devices are typically lighter in weight, more
aesthetic, easier to fabricate, and less expensive.
The ideal static dissipative thermoplastic dissipates charges as they are generated in a
controlled manner. At any point on the surface there is no accumulation of charge, which
could cause hazardous discharge. This means that the thermoplastic should be at least some-
what conductive. However, very high surface conductivities lead to uncontrolled discharges.
For many ESD applications the optimal surface resistivity resides from 10
6
to 10
9
ohms/square.
3
A static dissipative thermoplastic is a material in which a conductive additive is incorpo-
rated into a thermoplastic resin matrix. Conventional conductive additives for ESD
applications have included antistatic agents, carbon black, carbon or graphite fibers, and
metal powders or fibers. Unfortunately, it is difficult to provide consistent surface resistivity
in the ideal range utilizing traditional additives. These compounds are either not conductive
enough or exhibit a sudden increase in conductivity that extends beyond the ideal range once
a critical concentration is reached. An example of this type of behavior is shown in Figure 1.
A new class of conductive additives has been developed through in-situ deposition of in-
trinsically conducting polymers (ICP) onto carbon black substrates. The resulting ICP
composites are thermally stable. Conductive thermoplastics were produced using the ICP
composites in a number of matrix resins without degradation or conductivity loss.
4
A significant advantage of the ICP composites is their inherent flexibility. The type of
ICP, degree of deposition, dopant, pH, and carbon black substrate may all be varied. This flex-
ibility allows selected properties to be tuned to desired values. Through this flexibility, it is
possible to produce static dissipative thermoplastics with surface resistivities tuned into the
ideal range for ESD applications.
EXPERIMENTAL
Various ICP composites were prepared as described elsewhere.
5
Commercially available
thermoplastics were used as matrix resins. Conductive thermoplastics were manufactured by
first physically mixing the ICP composites with matrix resin pellets and then compounding
using a twin-screw compounding extruder. Compound melt flow behavior was analyzed with
a capillary rheometer.
Test specimens were produced via injection molding. The mechanical and electrical
properties of the specimens were tested according to ASTM test methods D-638 for tensile
strength and flexural modulus, D-256 for Izod impact, and D-257 for volume and surface re-
sistivity. Matrix resins and compounds were dried according to established resin guidelines
prior to compounding, rheometry, and molding.
Thermal stability was investigated by aging at elevated temperatures. Test specimens
were aged using standard air circulating ovens at 80, 100, and 130
o
C. Specimens were equili-
brated at 25
o
C and 50% relative humidity prior to testing.
RESULTS AND DISCUSSION
A mechanical performance comparison of various conductive nylon-6 compounds relative to
unfilled resin is given in Table 1. Trends in mechanical properties often associated with par-
ticulate filled materials are lower tensile strengths, greater stiffness, and decreased impact re-
sistance. These trends are also observed with these conductive compounds. However, the
226 Conductive Polymers and Plastics
compounds containing ICP composites outperform the unmodified carbon black material.
The increase in mechanical performance is most likely due to a more complete wetout and
greater adhesion between the conductive particles and the matrix polymer. This is also indi-
cated by the observation that compounds containing ICP composites exhibit reduced particle
generation or “sloughing” compared to standard carbon blacks when exposed to abrasion.
It is widely known that the resistivity does not decrease with carbon black concentration
linearly. Generally, what is observed is a sudden decrease in the resistivity once a critical con-
centration is reached. On either side of the discontinuity, only gradual decreases in the
resistivity are seen. It is difficult to provide controlled and consistent resistivities in the criti-
The Use of Conducting Polymer Composites 227
Table 1. Performance comparison of conductive nylon-6 compounds (mechan-
ical properties relative to neat resin)
Carbon black
ICP composite
ABC
Tensile strength, % 45.5 62.2 74.9 69.3
Flexural modulus, % 92.0 126 108 116
Izod impact, notched, % 43.2 64.8 46.4 74.4
Volume resistivity, ohm-cm 4.12x10
1
8.92x10
0
1.38x10
5
2.59x10
9
Figure 1. Volume resistivity as a function of carbon black
concentration in nylon.
Figure 2. Volume resistivity of nylon-6 compounds as a
function of ICP composite concentration. ICP composite
(a) A, (b) B, (c) C, (d) D.
cal region since minor
changes in bulk additive lev-
els and local fluctuations can
cause large shifts in the resis-
tivity.
Volume resistivities for
the conductive compounds
are also listed in Table 1. Note
that the volume resistivities
vary for different ICP composites. Volume resistivities of various ICP composites in nylon-6
as a function of concentration are given in Figure 2. ICP composite A is the most conductive
and displays similar behavior to traditional carbon blacks with a steep percolation curve. ICP
composites B, C, and D become less conductive and demonstrate a more controllable behav-
ior since the percolation curves are less steep over a wider range of additive concentration.
The surface resistivities of certain nylon-6 compounds with ICP composites are given in
Table 2. Usual definitions to characterize materials based on surface resistivity are: antistatic
(10
9
to 10
12
ohm/sq), static dissipative (10
5
to 10
12
ohm/sq), and conductive (less than 10
5
ohm/sq). With the flexibility of ICP composites, it is possible to tune the surface resistivity of
the compound into any desired classification. It is also possible to achieve the optimal surface
resistivity range (10
6
to 10
9
ohm/sq) required for many ESD applications.
It is important to note that the surface resistivity of the static dissipative compounds with
ICP composites is consistent from specimen to specimen and from location to location on a
specimen as observed during spot checking. This is partly due to the reduced steepness of the
percolation curves. This minimizes variation caused from bulk or local concentration differ-
ences. The consistent behavior is also a result of the additives themselves and not the additive
level being adjusted to provide the desired surface resistivity. Thus, a well-defined network
throughout the matrix can be achieved. This reduces fluctuations caused by local conductive
and insulative regions.
It is generally accepted that conductive compounds filled with carbon black exhibit
higher viscosities than with other types of fillers. This increase in viscosity is due to the
higher surface area of carbon blacks. As a result, it is often difficult to compound carbon
blacks with high surface area into thermoplastics. A key side effect of the deposition of ICPs
onto carbon black surfaces is the reduction of surface area and pore volume.
6
Compounds incorporating ICP composites were found to process much easier than com-
pounds containing standard carbon blacks. Evidence of easier processing can be found in
Figure 3. An ICP composite has a lower viscosity than the corresponding untreated carbon
black. Figure 3 shows that the viscosity is lower even when the ICP composite is used at
higher loading levels than carbon black.
228 Conductive Polymers and Plastics
Table 2. Surface resistivities of nylon-6 compounds
Surface resistivity, ohm/sq
ICP composite A <10
4
ICP composite B 2.1x10
6
ICP composite C 1.0x10
8
ICP composite D 1.7x10
10