Volume 07 - Powder Metal Technologies and Applications Part 5 ppsx
Bạn đang xem bản rút gọn của tài liệu. Xem và tải ngay bản đầy đủ của tài liệu tại đây (3.5 MB, 160 trang )
Surface Area, Density, and Porosity of Powders
Apparatus
Lea and Nurse (Ref 21) developed the apparatus shown in Fig. 4 to provide permeability measurements. The powder was
compacted in the sample cell to a predetermined porosity. Air was permitted to flow through the bed, and the pressure
drop (h
1
) was measured on the first manometer; the air then passed through a capillary flowmeter, across which another
pressure drop was measured as h
2
on a second manometer.
Fig. 4 Lea and Nurse permeability apparatus with manometer and flowmeter
The capillary permitted the system to operate under a constant pressure. The volume rate of flow through the flowmeter,
the pressure drop across the bed as measured by the manometer, and the constants associated with the apparatus permitted
determination of the specific surface area (surface area per unit volume).
Gooden and Smith (Ref 22) added a self-calculating chart to a modified Lea and Nurse apparatus to enable direct readout
of the specific surface. The commercial version of their modification is known as the Fisher subsieve sizer (Fig. 5).
Fig. 5 Fisher subsieve sizer operation
A simplified version of the air permeameter, known as the Blaine permeameter (Fig. 6) (Ref 23), relied on a variable
pressure technique (Ref 24). A vacuum was used to displace the oil in a U-tube connected in series with the powder cell.
The resultant pressure caused air to flow through the powder bed, and the time required for the displaced oil to fall back
to its equilibrium position was measured. This method resulted in a measured specific surface area, which decreased with
porosity. Usui (Ref 25) showed that log t and the void fraction exhibited a linear relationship and that a plot of these
parameters gave a value for surface area.
Fig. 6 Blaine air permeability apparatus. Source Ref 23
References cited in this section
21.
F.M. Lea and R.W. Nurse, J. Soc. Chem. Ind., Vol 58, 1939, p 277-
283; Symposium on Particle Size
Analysis, Trans. Inst. Chem. Eng., (suppl.), Vol 25, 1947, p 47-56
22.
E.L. Gooden and C.M. Smith, Ind. Eng. Chem. Anal. Ed., Vol 12, 1940, p 479-482
23.
K. Niesel, External Surface of Powders From Permeability Measurements A Review, Silicates Industrials,
1969, p 69-76
24.
R.L. Blaine, ASTM Bull., No. 123, 1943, p 51-55; also see ASTM Bull., No. 108, 1941, p 17-20
25.
K. Usui, J. Soc. Mater. Sci. Jpn., Vol 13, 1964, p 828
Surface Area, Density, and Porosity of Powders
Limitations
For very fine powders, the basic Kozeny-Carman equation is not accurate. This is because the laminar flow assumption
on which it is based is no longer valid. Compressed fine particles result in a powder bed with very small channel widths.
If these widths are comparable to the mean free path length of the gas molecules, laminar flow conditions are not
maintained.
Such a situation, involving molecular flow or diffusion conditions, is known as Knudsen flow (Ref 26) and can occur with
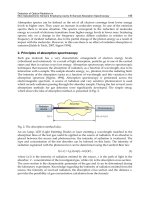
very fine powders or with coarser particles at low pressures. Figure 7 shows a typical apparatus used to measure find
particles under molecular flow conditions (Ref 27, 28). In some powders, both laminar and molecular flow may be
significant. This is known as the transitional region.
Fig. 7 Modified Pechukas and Gage apparatus for fine powders. Source: Ref 27
Evaluating surface areas with steady-state flow conditions historically excluded noninterconnected blind pores. A method
for including blind pores by utilizing transient-state flow measurements is the principle behind the apparatus shown in
Fig. 8(a) (Ref 29, 30). A typical flow rate curve, showing extrapolation of the steady-state portion to determine the time
lag is given in Fig. 8(b). The basic principle of the permeability analysis has not changed much during the last several
years; even so, instruments now use more sophisticated pressure transducer and flowmeter or flow controller. Combined
with a computerization of the instrument and an improved data analysis software, the instrument offer a wider variety of
analysis tasks and computational methods.
Fig. 8(a) Transient flow apparatus
Fig. 8(b) Flow rate curve for the transient flow apparatus
References cited in this section
26.
M. Knudsen, Ann. Physik, Vol 28, 1909, p 75-130
27.
A. Pechukas and F.W. Gage, Ind. Chem. Eng. Anal. Ed., Vol 18, 1946, p 37
28.
P.C. Carman and P.R. Malherbe, J. Soc. Chem. Ind., Vol 69, 1950, p 134
29.
R.M. Barrer and D.M. Grove, Trans. Faraday Soc., Vol 47, 1951, p 826, 837
30.
G. Kraus, R.W. Ross, and L.A. Girifalco, J. Phys. Chem., Vol 57, 1953, p 330
Surface Area, Density, and Porosity of Powders
Pycnometry
Peter J. Heinzer, Imperial Clevite Technology Center
Pycnometry is used to determine the true density of P/M materials. Based on the displacement principle, pycnometry is
actually a method of determining the volume occupied by a solid of complex shape, such as a powder sample. For
commercial pycnometers, typical sample sizes range from 5 to 135 cm
3
(0.30 to 8.24 in.
3
). A properly prepared specimen
can be analyzed in 15 to 20 min.
The pycnometric determination of density can be quite useful in P/M applications. In addition to its primary use in
measuring the true density of a P/M part or product, it can be used to distinguish among different crystalline phases or
grades of material, different alloys, compositions, or prior treatments.
Information on the porosity of a material can be obtained from pycnometry if the sample has a uniform geometry, or if the
bulk volume is known. Pore volume is the difference between the bulk volume (1/bulk density) and the specific volume
(1/true density). Finally, pycnometry can be useful in determining properties that relate to density. Often, P/M materials
have no solid counterpart to use for measuring true density, making percentage of theoretical density measurements
questionable. Pycnometric measurements of the true density of the powder have provided a good point of reference.
Density is one of the most important properties of P/M materials. Critical processing parameters, such as applied force
and pressure, and properties of the resulting P/M product, such as strength and hardness, usually depend on the density of
the materials being processed. Standard industry practice compares the achieved density of a P/M product with the full, or
theoretical, density.
Surface Area, Density, and Porosity of Powders
Theory and Apparatus
Archimedes devised the first method for determining true density by using the displacement principle. Modern
pycnometry represents a refinement of the displacement principle and uses either a liquid or gaseous substance as the
displaced medium.
Absolute densities of solids can be measured by the displacement principle using either liquid or gas pycnometry. In
liquid pycnometry, volume displacement is measured directly, as liquids are incompressible. Inability of the liquid to
penetrate pores and crevices, chemical reaction or adsorption onto the sample surface, wetting or interfacial tension
problems, and evaporation contribute to errors in density measurement. Therefore, gas pycnometry is usually preferred
for P/M applications.
In gas pycnometry, volume displacement is not measured directly, but determined from the pressure/volume relationship
of a gas under controlled conditions. Gas pycnometry requires the use of high-purity, dry, inert, nonadsorbing gases such
as argon, neon, dry nitrogen, dry air, or helium. Of these, helium is recommended because it:
• Does not adsorb on most materials
• Can penetrate pores as small as 0.1 nm (1 )
• Behaves like an ideal gas
In commercial pycnometers, the sample is first conditioned or outgassed to remove contaminants that fill or occlude pores
and crevices, thus changing surface characteristics. This is accomplished by evacuating the system and heating to elevated
temperatures, following by purging with an inert gas such as helium.
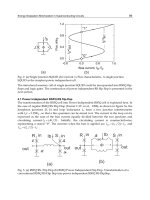
The helium-filled sample system (Fig. 9) is "zeroed" by allowing it to reach ambient pressure and temperature. At this
point, the sample cell and reference volume are isolated from each other and from the balance of the system by valves.
Fig. 9 Flow chart for typical pycnometer
The state of the system can then be defined by:
PV = nRT
(Eq 1)
for the sample cell and:
PV
R
= n
R
RT
(Eq 2)
for the calibrated reference cell. In these equations, P is the ambient pressure, Pa; V is the volume of the sealed empty
sample cell, cm
3
; V
R
is volume of a carefully calibrated reference cell, cm
3
; n is moles of gas in the sample cell volume at
P; n
R
is moles of gas in the reference cell volume at P; R is the gas constant; and T is ambient temperature, K.
A solid sample of volume (V
s
) is then placed in the sample cell:
P(V - V
s
) = n
1
RT
(Eq 3)
where n
1
is moles of gas occupying the remaining volume in sample cell at P. The system is then pressurized to P
2
, about
100 kPa (15 psi) above ambient:
P
2
(V - V
s
) = n
2
RT
(Eq 4)
where n
2
is moles of gas occupying the remaining volume in the sample cell at P
2
. The valve is then opened the connect
the sample cell with the calibrated reference volume, and the pressure drops to a system equilibrium P
3
:
P
3
(V - V
s
) + P
3
V
R
= n
2
RT + n
R
RT
(Eq 5)
Substituting PV
R
from Eq 2 for n
R
RT in Eq 5 and substituting P
2
(V - V
s
) from Eq 4 for n
2
RT results in:
P
3
(V - V
s
) + P
3
V
R
= P
2
(V - V
s
) + PV
R
(Eq 6)
Simplifying:
(P
3
- P
2
) (V - V
s
) = (P - P
3
)V
R
(Eq 7)
(Eq 8)
V
s
= V + V
R
/[1 - (P
2
- P)/(P
3
- P)]
(Eq 9)
Because P is "zeroed" at ambient before pressurizing, the working equation becomes:
V
s
= V + V
R
/[1 - (P
2
/P
3
)]
(Eq 10)
Over the last few years, the gas pycnometer has been further improved by using a more accurate pressure transducer, a
better temperature control of the entire system, and by an automation (computerization) of the actual analysis process.
Modern pycnometers can now reach an accuracy of 0.01%.
Surface Area, Density, and Porosity of Powders
Mercury Porosimetry
H. Giesche, School of Ceramic Engineering and Sciences, Alfred University
Many commercially important processes involve the transport of fluids through porous media and the displacement of one
fluid, already in the media, by another. The role played by pore structure is of fundamental importance in understanding
of these processes. The quality of powder compacts is also affected by the void size distribution between the constituent
particles. For these reasons, mercury porosimetry has long been used as an experimental technique for the
characterization of pore and void structure.
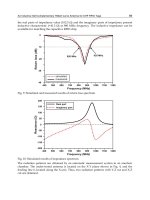
Gas and mercury porosimetry are complementary techniques with the latter covering a much wider size range from 0.3
mm to 3.5 nm (Fig. 10). Mercury porosimetry consists of the gradual intrusion of mercury into an evacuated porous
medium at increasingly higher pressures followed by extrusion as the pressure is lowered. The simplest pore model is
based on parallel circular capillaries that empty completely as the pressure is reduced to zero. This model fails to take into
account the real nature of more porous media, which consist of a network of interconnecting noncircular pores. The
network effects lead to hysteresis and mercury retention during the extrusion cycle.
Fig. 10 Pore radii ranges covered by gas and mercury porosimetry
Surface Area, Density, and Porosity of Powders
General Description
Relationship between Pore Radii and Intrusion Pressure. Mercury porosimetry is based on the capillary rise
phenomenon whereby an excess pressure is required to cause a nonwetting liquid to enter a narrow capillary. The pressure
difference across the interface is given by the equation of Young (Ref 31) and Laplace (Ref 32), and its sign is such that
the pressure is less in the liquid than in the gas (or vacuum) phase if the contact angle is greater than 90° or more if is
less than 90°. If the capillary is circular in cross section, and not too large in radius, the meniscus will be approximately
hemispherical. The curvature of the meniscus can be related to the radius of the capillary, and the Young-Laplace
equation reduces to the Washburn equation (Ref 33):
(Eq 11)
This is the Young-Laplace and Washburn equation where
lv
is the surface tension of the liquid (e.g., for mercury, 0.485
N/m), r
1
and r
2
are mutually perpendicular radii of a surface segment. The angle is the angle of contact between the
liquid and the capillary walls and is always measured within the liquid (Fig. 11). r
P
is the capillary radius.
Fig. 11 Contract angle ( ) of a liquid in a capillary
Equipment Fundamentals. The sample is placed into the penetrometer assembly; it is then evacuated to a set vacuum
level for a specific time, before the sample cell is filled with mercury. Air is admitted to the low-pressure chamber, and
the increasing pressure forces the mercury to penetrate the largest pores of the sample. The amount or volume of mercury
penetrating into the sample is recorded at each pressure (or pore size) point; the first reading usually is taken at a pressure
of 0.5 psi (0.003 MPa), although readings at a pressure of 0.1 psi (0.7 × 10
-4
MPa) are possible. The pressure is then
increased to 1 atm, or in some instruments the pressure is actually increased to a slight overpressure (up to 50 psi in some
cases). After the low-pressure run is finished, the penetrometer is then inserted into a high-pressure port and surrounded
with a special grade of high-pressure oil; it is special with respect to the dielectric constant and viscosity of the oil under
high-pressure conditions. The pressure is increased up to a final pressure of 60 ksi (400 MPa). Commercial instruments
work either in an incremental or continuous mode. In the former, the pressure is increased in steps and the system allowed
to stabilize at each pressure point before the next step. In the continuous mode, the pressure is increased continuously at a
predetermined rate. Schematics of low-pressure and high-pressure systems are shown in Fig. 12 and 13, respectively (Ref
34).
Fig. 12 Low-pressure mercury porosimeter. Source: Ref 34
Fig. 13 Micromeritics high-pressure mercury porosimeter
References cited in this section
31.
T. Young, Miscellaneous Works, Vol 1, Murray 1855, p 418
32.
P.S. Laplace, Mecanique Celeste, Suppl. Book 10, 1806
33.
E.W. Washburn, Proc. Nat. Acad. Sci. U.S.A., Vol 7, 1921, p 115
34.
AutoPore II 9220 Operator's Manual, Micromeritics, 1993
Surface Area, Density, and Porosity of Powders
Measurement Techniques
Measuring Displacement Volumes (Pore Volume). Mercury volume displacements may be measured by direct
visual observation of the mercury level in a glass penetrometer stem (Fig. 14) with graduated markings (Ref 35).
However, most (if not all) instruments on the market will measure this volume automatically by one of the following
techniques:
• Precision capacitive bridges: measure
changes in the capacitance between the column of mercury in a
dilatometer stem and a coaxial sheet surrounding the column
• Mechanical transducer:
indicate the change in height of the mercury column by moving a contact wire
and measuring the displacement of the mercury interface in the stem
• Submerged wires:
measure changes in resistivity corresponding to the change in length of the mercury
column
From a practical point of view, the sample mass (pore volume) and the stem volume of the penetrometer should be
adjusted to use the instrument to its highest resolution. In general, larger samples are preferred because they provide a
better representation of the overall sample.
Fig. 14 Quantachrome filling mechanism and low-pressure porosimetry system. Source: Ref 35
Pressure. The corresponding pressure at which mercury is filling the pore system is usually measured with electronic
pressure transducer or with Heise-Bourdon manometer, used in older manual setups. A series of those pressure
transducers ensures that accurate data are determined over the entire range from 0.1 psi (0.7 × 10
-4
MPa) to 60 psi (0.4
MPa).
Looking at the Washburn equation (Eq 11) makes it obvious that two additional parameters play a critical role in the
calculation of pore size from the applied pressure: contact angle, , and the surface tension,
Hg
.
Contact Angle Determination. Various techniques are available to determine the contact angle:
•
A drop of mercury can be placed on the flat surface of the sample, and the resulting contact angle is
visually observed. Problems related to "micro" and "macro" contact angles have been reported (Fig. 15
)
(Ref 36). Brashforth and Adams (Ref 37
) published tables that allow calculation of the contact angle as
well as the surface tension of liquids from the shape of a drop of mercury on the substrate surface (
Fig.
16). A simplified formula can be used when the maximum height of the drop is reached (Ref 35, 37
,
38):
• with g, the acceleration of gravity, and , the density of the liquid.
• A powder compact can be pressed in such a way that a well-
defined hole is created in a disk. Mercury is
now placed on top of this disk, and the contact angle can be calculated from the necessary
pressure to
force the mercury through this cylindrical pore.
• The Willhelmy plate method (Fig. 17) can be used to determine the contact angle (Ref 39). Figures 17
and 18 illustrate the critical observation of an adv
ancing and receding mercury interface. Surface
roughness (Fig. 18) or the change in surface composition during the con
tact with mercury can explain
the presence of this difference. (Note: there is no thermodynamic reason or explanation for any contact
angle hysteresis.) No surface roughness effects are assumed below pore sizes of about 100 nm. This
effect also emphasizes the importance of clean samples and clean mercury.
The contact angle between mercury and the sample being tested is frequently assumed to be 130 or 140°. This assumption
is probably the largest source of error. Contact angles of different materials may differ significantly, as shown in Table 2
(Ref 40).
Table 2 Contact angle between mercury and select P/M materials
Powder Angle, degrees
Aluminum
140
Copper
116
Glass
153
Iron
115
Zinc
133
Tungsten carbide
121
Tungsten
135
Source: Ref 40
Fig. 15 Differences between microscopic and macroscopic measurement of the contact angle (
) under
conditions of (a) wetting and (b) nonwetting
Fig. 16 Change of mercury-drop shape with size
Fig. 17
Wilhelmy plate method showing the effect of contact angle hysteresis for emersion and immersion.
Adapted from Ref 39
Fig. 18 Effect of surface roughness on contact angles
The Washburn equation is directly proportional to the cosine of the contact angle; the respective pore size errors for iron
( = 115°) and glass ( = 153°), using the values from Table 2 versus a constant value of 130° for , would be:
or
However, published contact angles differ widely between different research groups, even when presumably the same
material was studied.
Some materials might react with mercury, for example, zinc, silver, or lead samples. This severely changes the
nonwetting behavior of mercury with that sample and may even lead to a contact angle of <90°. In those cases a
protective film of stearic acid can be applied to the sample/pore surface and thus prevent the reaction. Though, for several
reactive metals, such as copper, their natural oxide layer on the surface is a sufficient protection (Ref 41).
Surface Tension of Mercury. Values for the surface tension of mercury can vary with atmosphere, temperature, and
purity of the mercury used. The purity of mercury has a significant effect on surface tension. Reported values vary by up
to 0.1 N/m (100 dynes/cm). Mercury is unusually prone to contamination, and this probably accounts for the lack of
reproducibility to be found in the values of surface tension in earlier publications. Later work, however, showed very
consistent results (Table 3) (Ref 6). The effect of temperature is minimal, because the temperature coefficient of the
surface tension of mercury is only 2.1 × 10
-4
N/m · °C. Another error is caused by neglecting the change of surface
tension for very small radii of surface curvature. The following correction has been suggested by Kloubek (Ref 42):
corr
= - 2.66 × 10
-4
m · P
For P = 200 MPa, the correction term gives an error of 12% [
corr
= (0.485 - 0.053) N/m].
Table 3 Surface tension of mercury in vacuum
Temperature, °C
Surface tension, mN/m
Method used
25
484 ± 1.5 Sessile drop
25
484 ± 1.8 Sessile drop
20
485 ± 1.0 Drop pressure
25
483.5 ± 1.0 Sessile drop
25
485.1 Sessile drop
16.5
487.3 Pendant drop
25
485.4 ± 1.2 Pendant drop
20
484.6 ± 1.3 Pendant drop
20
482.5 ± 3.0 Bubble pressure
Source: Ref 6
Compressibility of Mercury. Due to the slight compressibility of mercury, the measured pore volume of a porous
material appears larger than its actual volume. Using a well-balanced combination of the compressibility of the glass
sample cell, the mercury and the changes of dielectric properties especially of the high-pressure fluid minimizes this
blank effect. In general, the larger the sample and pore volume of the sample in comparison to the amount of mercury in
the penetrometer, the smaller the errors due to compressibility. Moreover a blank run correction can be used to correct for
compressibility effects. However, the total effect is a combination of all components in the system: the mercury, the high-
pressure oil, the glass penetrometer, and the sample.
References cited in this section
6. S.J. Gregg and K.S.W. Sing, Adsorption, Surface Area and Porosity, Academic Press, 1982
35.
Lowell and J.E. Shields, Powder Surface Area and Porosity, Chapman & Hall, 1991
36.
R.J. Good and R.Sh. Mikhail, Powder Technol., Vol 29, 1981, p 53
37.
F. Brashforth and J.C. Adams, An Attempt to Test the Theory of Capillary Action,
Cambridge University
Press, 1883
38.
L.I. Osipow, Surface Chemistry, Reinhold, 1964
39.
P.C. Hiemenz and R. Rajagopalan, Principles of Colloid and Surface Chemistry, Marcel Dekker, 1997
40.
H.M. Rootare, A Review of Mercury Porosimetry, Advanced Techniques in Powder Metallurgy,
Vol 5,
Perspectives in Powder Metallurgy, Plenum Press, 1970
41.
M. Svata, Powder Technol., Vol 29, 1981, p 145
42.
J. Kloubek, Powder Technolg., Vol 7, 1981, p 63, 162
Surface Area, Density, and Porosity of Powders
Restrictions and Limitations (Ref 43)
Results obtainable by mercury porosimetry are limited a priori in three ways:
•
The volume of pore space filled with mercury is limited by the maximum pressure. This aspect is related
to the question of what is to be counted as pore space; this is not self-evident for all mater
ials (e.g.,
cement stone). Mercury cannot penetrate very small pores.
•
At the other end of the scale, the penetration of very large pores is limited by the height of the sample,
which determines a minimum pressure. Hence, very large pores may go unnoticed.
(This was observed,
e.g., for porous nickel plaques.)
•
The sample size is finite and usually quite small. This boundary condition determines that results are not
necessarily representative of an infinite pore space, as large pore openings (at the surface)
are more
easily accessible in a smaller sample. Empirical support for this has been found by carrying out
experiments with jacketed and unjacketed samples.
Geometrical properties of the sample can affect the reproducibility and can cause difficulty in giving an unambiguous
interpretation of the result:
•
In many cases, a distinction is to be made between the interparticle and intraparticle voids. In a packing
of nonporous particles there is only an interparticle pore space. However, in many applications
for
example,sorbents
the prime concern is in the intraparticle void space. In such cases, a judgment must
be made as to which part of the measured pore volume belongs to the interparticle voids and which part
belongs to the intraparticle porosity. If the
sample exists as larger particles, the pore size distribution
frequently shows a bimodal pore size distribution. The larger pore size fraction can then be attributed to
the interparticle porosity. It may also help to use a narrow size fraction of these par
ticles for the porosity
analysis. A narrow particle size distribution causes a distinct peak in the pore size distribution at about
20 to 50% of the particle size, which can be clearly attributed to the interparticle voids.
• A special problem is caused by
the roughness of the surface of the particles or lumps that are measured.
Reich (Ref 44) already pointed out that char
acterization of samples should be based on those with the
same surface roughness. He found a significant difference for pieces of brick broken in different ways.
Corrections for the "part of the surface" that belongs to the particle pore space have been ma
de, but it
remains difficult to separate pores at the surface from pores in the inside if a cross-
sectional area
through the surface is different from a cross-
sectional area through the interior of the porous medium.
Sometimes these differences are very gr
eat, and the presence of a characteristic surface layer can
actually be observed.
•
Pretreatment of the sample may involve comminution. This may change the internal pore space in two
ways. First, if closed pores are present, some of these will be broken ope
n. Second, particles tend to
break along large pores; hence the relative volume of larger pores decreases.
•
Similar problems arise for nonparticulate materials such as paper. Sheetlike material should be packed
in a controlled way to eliminate artificial pores between the sheets.
The points mentioned up to now are basically limitations of the technique. If they are overlooked, they can lead to errors
of interpretation. The following is a list of factors that can upset the accuracy and the reliability of the results in a more
direct way.
•
Even if clean mercury is used at the beginning, the surface may soon be contaminated by components
that were adsorbed on the surface of the sample. It is known that impurities can change the surface
tension of mercury by as much as 30%.
•
Before mercury enters the dilatometer, the sample should be outgassed. Evacuation of the sample can
change the contact angle of the sample (compared with the contact angle on the sample in its original
condition). It has been stated that st
rong outgassing is necessary if the smallest pores are to be
measured. However, the error caused by compression of residual air seems to become significant only if
the evacuation does not reach a pressure below 10 torr.
• A serious problem arises when the s
ample is mechanically destroyed by the applied pressure during the
analysis. Fragile porous materials may be subject to a breakdown of pores during pressurization, or sol-
gel materials are frequently compressed reversibly or irreversibly during the mercury
porosimetry
analysis at high pressure. Knowledge of the compressibility or fracture strength of the material to be
analyzed is desirable to properly estimate whether mercury intrusion will occur before deformation or
fracture of the porous material occurs
. In other cases, a powder compact can be further compacted
during the measurement; for example, a powder was compacted at a pressure of 10 MPa; however,
mercury does not penetrate the pores before a pressure of 20 MPa is reached. In this case, the sample
experiences a second compaction and the results are not related to a compaction pressure of 10 MPa but
rather 20 MPa.
•
Corrections have to be made for the compressibility of the dilatometer and the mercury, as well as
compressibility effects of the sample.
Due to the compression of the mercury and oil, the temperature in
the dilatometer may rise considerably when a high pressure is applied. It has been estimated that the
temperature rise could be as much as 15°. Although it has occasionally been mentioned t
hat a cooling
fan is used, this point seems to have gone largely unnoticed. A change in temperature then changes the
volume of the mercury and the dilatometer and thus causes an artificial pore volume effect.
• The so-called kinetic hysteresis effect is rel
ated to the time that is required for the mercury to flow into
pores. If a volume reading is taken before equilibrium has been reached, this will result in a shift of the
pore size distribution toward smaller values.
Moreover, the rate of advance of mercury interfaces in horizontal, cylindrical capillaries was computed and also verified
experimentally. For a given sample size and pore size, the time required for equilibrium to be achieved during injection
can be calculated.
For a horizontal, cylindrical capillary, mercury enters the capillary at the threshold pressure, as given by the Laplace
equation, but does not continue to advance. A finite rate of advance is dependent on an excess pressure ( P) above the
threshold pressure and the distance-to-time relationship for the advancing mercury front is given by the following
equation, which can be derived from the Poiseulle equation (see Ref 39, p 286, and Ref 49):
where t is time, l is distance, is viscosity, r is radius, and P is pressure applied in excess of the injection pressure.
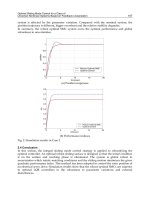
The distance-to-time relationship for mercury in tubes of five different sizes is shown in Fig. 19. A total applied pressure
of 110% of the injection pressure that is P in the previous equation is equal to 10% of injection pressure given by the
Laplace equation was used. The graph shows that for a tube of 0.5 m radius, the time required to travel 3 cm is in
excess of 100 s.
Fig. 19 Distance-to-time ratio for mercury advancing in tubes of five different radii (r). Source: Ref 49
The measured data are not reliable if they do not refer to an equilibrium situation. In older publications, for example,
kinetic hysteresis is stressed and the effect of mechanical vibrations ("tapping") is noted. In practice, those limitations
only apply to very large samples or for extremely small pore sizes. An equilibration time of 1 to a maximum of 5 min
should be sufficient in all samples.
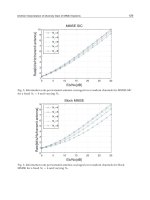
In general, effects due to different intrusion rates are not very severe. However, an example where pore size as well as
pore volume was greatly influenced is shown in Fig. 20. Five samples of an alumina extrudate were analyzed with
different equilibration routines. One sample was scanned (equilibration by time for 0 s). Three others were analyzed at
different equilibration intervals (2, 10, and 30 s), and a fourth was analyzed at an equilibration rate of 0.001 L/g· s. The
data from the five experiments are summarized in Fig. 20.
Fig. 20
Effect of equilibration routines on measurement of (a) cummulative intrusion and (b) log differential
intrusion with alumina extrudate. Source: Courtesy of D. Smith, Micromeritics and Ref 53
References cited in this section
39.
P.C. Hiemenz and R. Rajagopalan, Principles of Colloid and Surface Chemistry, Marcel Dekker, 1997
43.
J. van Brakel, S. Modry, and M. Svata, Powder Technol., Vol 29, 1981, p 1
44.
B. Reich, Chem. Ing. Tech., Vol 39 (No. 22), 1967, p 1275
49.
N.C. Wardlow and M. McKellar, Powder Technol., Vol 29, 1981, p 127
53.
P. Webb and C. Orr, Analytical Methods in Fine Particle Technology, Norcross, 1997, p 165
Surface Area, Density, and Porosity of Powders
Surface Area Determination
Under the assumption of a specific pore geometry, one can calculate the surface area of a sample from mercury
porosimetry measurements. Usually the cylinder pore model is used.
Rootare and Prenzlow (Ref 45) derived the following equation:
This equation is equivalent to the cylinder pore model.
The later derivation does not contain an assumption about the pore geometry; it does however, assume that the movement
of the mercury meniscus is reversible. For an interconnected pore system, this is not the case and the equation will always
calculate higher values for the surface area. Surprisingly many publications report a relatively good correlation between
surface area values derived from mercury porosimetry measurements and corresponding N
2
-gas adsorption BET values
(Ref 6, 45) (Table 4).
Table 4 Comparison of surface area measurements with N
2
gas adsorption and Hg porosimetry
Surface area, m
2
/g Sample
Hg-porosimetry
N
2
-adsorption
Tungsten powder
0.11 0.10
Iron powder
0.20 0.30
Zinc dust
0.34 0.32
Copper powder
0.34 0.49
Silver iodide
0.48 0.53
Aluminum dust
1.35 1.14
Fluorspar
2.48 2.12
Iron oxide
14.3 13.3
Anatase
15.1 10.3
Graphitized carbon black
15.7 12.3
Boron nitride
19.6 20.0
Hydroxyapatite
55.2 55.0
Carbon black (Spheron-6)
107.8 110.0
The value of the specific surface area is often used to determine ("adjust") the contact angle of mercury on a specific
material by modifying the contact angle until the surface area calculated from mercury porosimetry measurements
correlates with the values determined from nitrogen adsorption data. For materials that do not indicate a severe effect of
compressibility or pores smaller than about 10 nm, this method might be a valid alternative to determine the contact
angle.
Hysteresis and Entrapped Mercury in the Sample. Interpretation of the extrusion data from mercury porosimetry
measurements has been mostly neglected because the interpretation was very vague and questionable. Traditionally, three
theories are used to explain the hysteresis between the intrusion and extrusion curve in mercury porosimetry
measurements (Fig. 21) (Ref 48): contact angle hysteresis, ink-bottle theory, and connectivity model.
Fig. 21 Mercury porosimetry analysis of an ordered packed sphere structure. Source: Ref 48
Contact Angle Hysteresis. Numerous authors have reported different values for advancing and receding contact
angles (Fig. 22). The problem, however, is much more complicated because thermodynamic reasoning does not support
such a difference. In addition, the observed intrusion and extrusion curves do not fit as perfectly as they should according
to the contact angle hysteresis model. Moreover, the model does not provide any explanation for the trapped mercury,
which may remain in the sample even after complete depressurization.
Fig. 22 Hysteresis model based on differences in advancing and receding angles
The ink-bottle theory accurately describes the situation in which mercury enters and leaves pores (Fig. 23). It
explains why some of the mercury remains trapped in the sample. However, it explains the principal hysteresis only in
part. For most samples, the ink-bottle theory would predict a much larger amount of mercury remaining in the sample
than actually observed in the measurement. The contradiction has not been resolved.
Fig. 23 The ink-bottle theory of hysteresis when mercury enters and leaves the pores
The connectivity model uses a network of pores. In order for a pore to become filled with mercury, it is essential to
be larger than the corresponding pore size at the applied pressure, but it is also necessary that a continuous path of
mercury leads to the pore. Large internal voids that are surrounded by smaller pores are not filled unless the pressure is
sufficient to fill the smaller pores. During the extrusion process, the reverse process can occur, and certain pores or
islands of pores remain filled with mercury.
The connectivity model probably best describes the real situation, but conflicting results have been reported as well.
Several new approaches have been studied recently, and further details are given in the corresponding publications (Ref
46, 47, 48, 49). Analysis of the extrusion curve as well as a back-and-forward pressure scanning within the hysteresis is
presently studied. This technique can provide a better understanding of the pore and network structure of the sample.
References cited in this section
6. S.J. Gregg and K.S.W. Sing, Adsorption, Surface Area and Porosity, Academic Press, 1982
45.
H.M. Rootare and C.F. Prenzlow, J. Phys. Chem., Vol 71, 1967, p 2733
46.
G.P. Matthews, C.J. Ridgway, and M.C. Spearing, J. Colloid Interface Sci., Vol 171, 1995, p 8
47.
G.P. Matthews, A.K. Moss, and C.J. Ridgway, Powder Technol., Vol 83, 1995, p 61
48.
H. Giesche, Mater. Res. Soc. Symp. Proc., Vol 431, 1996, p 251
49.
N.C. Wardlow and M. McKellar, Powder Technol., Vol 29, 1981, p 127
Surface Area, Density, and Porosity of Powders
Conclusions
Mercury porosimetry is a very valuable technique, especially because it covers an extremely wide pore size range (Fig.
10). It certainly has its limitations, but carefully set experimental process conditions and a sensible data analysis provide
valuable information about the sample. It is recommended that standard procedures be followed, for example, ASTM
standards D 4284 (Ref 50) and C 493 (Ref 51). A good overview on mercury porosimetry with respect to different
materials and other aspects of the technique is given in several articles in Ref 52.
It is recommended that close attention be paid to a correct and meaningful data presentation. The differential plot of the
pore size distribution can easily lead to a misinterpretation of the results if the graph is calculated with the "wrong" axis:
• A pore volume/ log (pore size) should be used to represent th
e differential distribution equivalent to
the cumulative distribution when using a logarithmic axis for pore size.
• Using pore volume/ pore size leads to an overestimation of small pores.
• Plotting the pore volume versus applied pressure on a linear pressu
re axis allows determination and
recognition of compressibility effects of the sample or the mercury.
References cited in this section
50.
"Pore Volume Distribution of Catalysts by Mercury Intrusion Porosimetry," D 4284,
Annual Book of ASTM
Standards, Vol 5.03, ASTM
51.
"Bulk Density and Porosity of Granular Refractory Materials by Mercury Intrusion Porosimetry," C 493,
Annual Book of ASTM Standards, Vol 15.01, ASTM
52.
Powder Technol., Vol 29, 1981
Surface Area, Density, and Porosity of Powders
References
1. S. Brunauer, P.H. Emmett, and E. Teller, J. Am. Chem. Soc., Vol 60, 1938, p 309
2. I. Langmuir, J. Am. Chem. Soc., Vol 38, 1916, p 2221
3. I. Langmuir, J. Am. Chem. Soc., Vol 40, 1918, p 1361
4. K.S.W. Sing and D. Swallow, Proc. Br. Ceram. Soc., Vol 39 (No. 5), 1965
5. R.T. Davis, T.W. DeWitt, and P.H. Emmett, J. Phys. Chem., Vol 51, 1947, p 1232
6. S.J. Gregg and K.S.W. Sing, Adsorption, Surface Area and Porosity, Academic Press, 1982
7. S. Lowell and J.E. Shields, Powder Surface Area and Porosity, Chapman & Hall, 1991
8. T. Allen, Particle Size Measurement, Vol 2, Surface Area and Pore Size Determination,
Chapman & Hall,
1997
9. A.W. Adamson, Physical Chemistry of Surfaces, John Wiley & Sons, 1982
10.
D.H. Everett, G.D. Parfitt, K.S.W. Sing, and R. Wilson, J. Appl. Chem. Biotechnol., Vol 24, 1974, p 199
11.
E.P. Barrett, L.G. Joyner, and P.H. Halenda, J. Am. Chem. Soc., Vol 73, 1951, p 373
12.
T. Allen, Permeametry, Particle Size Measurement, Chapman and Hall, 1968
13.
C.F. Callis and R.R. Irani, Miscellaneous Techniques,
Particle Size: Measurements, Interpretation, and
Application, John Wiley & Sons, 1963
14.
"Permaran Specific Surface Area Meter," Outokumpu Oy, Instrument Division, Tapiola, Finland, 1973
15.
H.P.G. De'Arcy, Les Fontaines Publiques de la Ville de Dijon, Victor Dalmont, 1856
16.
J.J. Kozeny, Akad. Wiss. Wein. Math. Naturwiss. K.I., Sitzungsbor, Abstr. IIA, Vol 136, 1927, p 271-306
17.
F.C. Blake, Trans. Am. Inst. Chem. Eng., Vol 14, 1922, p 415
18.
P.C. Carman, J. Soc. Chem. Ind. Lond., Vol 57, 1938, p 225-234; Trans. Inst. Chem. Eng.,
Vol 15, 1932, p
150-166
19.
J.M. Dallavalle, Chem. Met. Eng., Vol 45, 1938, p 688
20.
P.C. Carman, Symposium on New Methods for Particle Size Determination in the Sub-Sieve Range, AS
TM,
1941, p 24
21.
F.M. Lea and R.W. Nurse, J. Soc. Chem. Ind., Vol 58, 1939, p 277-
283; Symposium on Particle Size
Analysis, Trans. Inst. Chem. Eng., (suppl.), Vol 25, 1947, p 47-56
22.
E.L. Gooden and C.M. Smith, Ind. Eng. Chem. Anal. Ed., Vol 12, 1940, p 479-482
23.
K. Niesel, External Surface of Powders From Permeability Measurements A Review, Silicates Industrials,
1969, p 69-76
24.
R.L. Blaine, ASTM Bull., No. 123, 1943, p 51-55; also see ASTM Bull., No. 108, 1941, p 17-20
25.
K. Usui, J. Soc. Mater. Sci. Jpn., Vol 13, 1964, p 828
26.
M. Knudsen, Ann. Physik, Vol 28, 1909, p 75-130
27.
A. Pechukas and F.W. Gage, Ind. Chem. Eng. Anal. Ed., Vol 18, 1946, p 37
28.
P.C. Carman and P.R. Malherbe, J. Soc. Chem. Ind., Vol 69, 1950, p 134
29.
R.M. Barrer and D.M. Grove, Trans. Faraday Soc., Vol 47, 1951, p 826, 837
30.
G. Kraus, R.W. Ross, and L.A. Girifalco, J. Phys. Chem., Vol 57, 1953, p 330
31.
T. Young, Miscellaneous Works, Vol 1, Murray 1855, p 418
32.
P.S. Laplace, Mecanique Celeste, Suppl. Book 10, 1806
33.
E.W. Washburn, Proc. Nat. Acad. Sci. U.S.A., Vol 7, 1921, p 115
34.
AutoPore II 9220 Operator's Manual, Micromeritics, 1993
35.
Lowell and J.E. Shields, Powder Surface Area and Porosity, Chapman & Hall, 1991
36.
R.J. Good and R.Sh. Mikhail, Powder Technol., Vol 29, 1981, p 53
37.
F. Brashforth and J.C. Adams, An Attempt to Test the Theory of Capillary Action,
Cambridge University
Press, 1883
38.
L.I. Osipow, Surface Chemistry, Reinhold, 1964
39.
P.C. Hiemenz and R. Rajagopalan, Principles of Colloid and Surface Chemistry, Marcel Dekker, 1997
40.
H.M. Rootare, A Review of Mercury Porosimetry, Advanced Techniques in Powder Metallurgy,
Vol 5,
Perspectives in Powder Metallurgy, Plenum Press, 1970
41.
M. Svata, Powder Technol., Vol 29, 1981, p 145
42.
J. Kloubek, Powder Technolg., Vol 7, 1981, p 63, 162
43.
J. van Brakel, S. Modry, and M. Svata, Powder Technol., Vol 29, 1981, p 1
44.
B. Reich, Chem. Ing. Tech., Vol 39 (No. 22), 1967, p 1275
45.
H.M. Rootare and C.F. Prenzlow, J. Phys. Chem., Vol 71, 1967, p 2733
46.
G.P. Matthews, C.J. Ridgway, and M.C. Spearing, J. Colloid Interface Sci., Vol 171, 1995, p 8
47.
G.P. Matthews, A.K. Moss, and C.J. Ridgway, Powder Technol., Vol 83, 1995, p 61
48.
H. Giesche, Mater. Res. Soc. Symp. Proc., Vol 431, 1996, p 251
49.
N.C. Wardlow and M. McKellar, Powder Technol., Vol 29, 1981, p 127
50.
"Pore Volume Distribution of Catalysts by Mercury Intrusion Porosimetry," D 4284,
Annual Book of ASTM
Standards, Vol 5.03, ASTM
51.
"Bulk Density and Po
rosity of Granular Refractory Materials by Mercury Intrusion Porosimetry," C 493,
Annual Book of ASTM Standards, Vol 15.01, ASTM
52.
Powder Technol., Vol 29, 1981
53.
P. Webb and C. Orr, Analytical Methods in Fine Particle Technology, Norcross, 1997, p 165
Bulk Properties of Powders
John W. Carson and Brian H. Pittenger, Jenike & Johanson, Inc.
Introduction
THE P/M INDUSTRY has grown considerably in the past decade. As a result of this growth, more critical components in
the automotive, aircraft, tooling, and industrial equipment industries are being considered for manufacture using this
technology. This is placing increasingly stringent quality requirements on the final P/M part. Variations in part density,
mechanical properties including strength, wear, and fatigue life, as well as in aesthetic appearance and dimensional
accuracy are no longer tolerated. As a result, metal powder producers and P/M part manufacturers must continually
improve their capabilities to ensure the delivery of a consistent, uniform product. Research has demonstrated that these
part qualities are significantly affected by changes (variations) in the particle size distribution, particle shape, and
consequently the uniformity of powder blends (a combination of one or more particle sizes of a single powder) and mixes
(a combination of one or more types of powders) (Ref 1, 2).
References
1.
J.H. Bytnar, J.O.G. Parent, H. Henein, and J. Iyengar, Macro-
Segregation Diagram for Dry Blending
Particulate Metal-Matrix Composites, Int. J. Powder Metall., Vol 31 (No. 1), 1995
2.
Properties and Selection: Irons and Steels, Vol 1, Metals Handbook, American Society for Metals, 1978
Bulk Properties of Powders
John W. Carson and Brian H. Pittenger, Jenike & Johanson, Inc.
Powder Flow
This article reviews the general factors of powder flow, and the following properties are discussed, along with examples
of their applications in equipment selection:
• Cohesive strength
• Frictional properties
• Bulk density
• Permeability and flow rate
• Sliding at impact points
• Segregation tendency
• Angle of repose
The flow of metal powders in bins, hoppers, feeders, chutes, and conveyors is not always reliable or uniform. This often
results in the press having to operate at lower cycle times, wasted product due to composition or apparent density
variations, and operational nightmares. The powder may form a stable arch or rathole; particle segregation may occur,
resulting in unacceptable variations in the bulk density of the powder supplied to the feed shoe, or the powder may flood
uncontrollably.
Bulk Properties. One of the main reasons that powder flow problems are so prevalent is lack of knowledge about the
bulk properties of various powders. For many engineers, the name of a powder, such as atomized aluminum, is thought to
connote some useful information about its handling characteristics. While this may be true in a general sense, it is not a