Optoelectronics Devices and Applications Part 5 pot
Bạn đang xem bản rút gọn của tài liệu. Xem và tải ngay bản đầy đủ của tài liệu tại đây (2.45 MB, 40 trang )
Detection of Optical Radiation in
NOx Optoelectronic Sensors Employing Cavity Enhanced Absorption Spectroscopy
149
Absorption spectra can be defined as the set of all electron crossings from lower energy
levels to higher ones. They cause an increase in molecules energy. In case of the emission
spectra there is inverse situation. The spectra correspond to the reduction of molecules
energy as a result of electrons transitions from higher energy levels to lower ones. Scattering
spectra rely on a change in the frequency spectra diffuse radiation in relation to the
frequency of incident radiation, due to the partial change of the photon energy as a result of
impact with the molecules. However, in this case there is no effect of radiation absorption or
emission [Saleh & Teich, 2007, Sigrist 1994].
2. Principles of absorption spectroscopy
Each gas molecule has a very characteristic arrangement of electron energy levels
(vibrational and rotational). As a result of light absorption, particles go to one of the excited
states and then in various ways lose energy. Absorption spectroscopy refers to spectroscopic
techniques that measure the absorption of radiation, as a function of wavelength, due to its
interaction with a sample. The sample absorbs energy, i.e., photons, from the radiating field.
The intensity of the absorption varies as a function of wavelength and this variation is the
absorption spectrum [Sigrist, 1994]. Absorption spectroscopy is performed across the
electromagnetic spectrum. A source of radiation and very sensitive photoreceiver is used
which records radiation passing through the absorber sample. During the last several years
absorptions methods for gas detection were significantly developed. The simple setup,
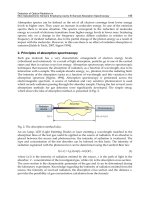
which shows the idea of absorption method, is presented in Fig. 2.
Fig. 2. The absorption method idea.
An arc lamp, LED (Light Emitting Diode) or laser emitting a wavelength matched to the
absorption lines of the test gas could be applied as the source of radiation. If an absorber is
placed between the source and photoreceiver, the intensity of radiation is weakened. The
type and concentration of the test absorber can be inferred on this basis. The intensity of
radiation registered with the photoreceiver can be determined using the Lambert-Beer law
0
(,) ()exp( ())IxI x C
, (1)
where I
0
(
) is the intensity of radiation emitted by the source, x is the path of light in the
absorber, C - concentration of the investigated gas, while σ(
) is the absorption cross section.
The cross section is the characteristic parameter of the gas and it can be determined during
the laboratory experiment. Knowledge regarding the intensity of radiation emitted from the
source, the intensity of received radiation, the absorption cross section and the distance x,
provides the possibility of gas concentration calculation from the formula
Optoelectronics – Devices and Applications
150
1
0
()
log ( )
(,)
I
Cx
Ix
. (2)
One of the most common gas detection systems is differential optical absorption
spectroscopy (DOAS). The first system was applied by Ulrich Platt in the 1970’s. Currently,
similar arrangements are applied to the monitoring of atmospheric pollutants, including the
detection of NO
x
, in terrestrial applications, in air and in the space, e.g. GOME and
SCIAMACHY satellite. Sensitivity of the method depends on the distance between the
radiation source and the photoreceiver. For systems where this distance is a few kilometres,
the sensitivity of the DOAS method is better than 1 ppb in the case of NO
2
detection [Martin
et al., 2004, Wang et al., 2005, Noel et al., 1999].
In order to lengthen the optical path and to improve the sensitivity of absorption methods,
reflective multipass cells are used, e.g. in tuneable diode laser absorption spectroscopy
(TDLAS). This method is characterized by high sensitivity. Applications cells with lengths of
a few dozen meters provide the possibility to achieve a sensitivity of 1 ppb and higher [Jean-
Franqois et al., 1999, Horii et al., 1999].
There are many differ concepts applied to gas detection and identification. However,
optoelectronic methods enable a direct and selective measurement of concentration on the
level of a single ppb.
3. Idea of the CRDS and other cavity enhanced methods
Cavity ring down spectroscopy for the first time was applied to determine the reflectivity
mirrors by J.M. Herbelin [Herbelin et al., 1980]. CRDS provides a much higher sensitivity
than conventional absorption spectroscopy. The idea of the CRDS method is shown in Fig. 3.
In this method there is applied an optical cavity with a high quality factor that is made up of
two concave mirrors with very high reflectivity R. This results in a long optical path, even
up to several kilometres [Busch & Busch, 1999].
Fig. 3. Cavity ring down spectroscopy idea.
A pulse of optical radiation is injected into the cavity through one of the mirrors. Then
inside the cavity multiple reflections occur. After each reflection, part of the radiation exiting
from the cavity is registered with the photodetector. The output signal from the
photodetector is proportional to the intensity of radiation propagated inside the optical
cavity. If the laser wavelength is matched to the absorption spectra of gas filling the cavity,
the cavity quality decreases. Thus, parameters of the signal from the photodetector are
Detection of Optical Radiation in
NOx Optoelectronic Sensors Employing Cavity Enhanced Absorption Spectroscopy
151
changed. Thanks to this, the absorption coefficient and concentration of gas can be
determined. The methods of their determination will be discussed in a subsequent section.
3.1 Characteristics of common cavity enhanced systems
Currently there are used many types of cavity enhanced systems that are characterized by
different technical constructions and properties. The literature shows that most of them use:
P-CRDS method (called Pulsed), which uses pulsed lasers [O'Keefe & Deacon, 1988],
CW-CRDS method (called Continuous Wave) applying continuous operation lasers [He
& Orr, 2000],
CEAS and ICOS (Integrated Cavity Output Spectroscopy) methods basis on off-axis
arrangement of the radiation beam and optical cavity [Kasyutich et al., 2003a],
cavity evanescent ring-down spectroscopy (EW-CRDS), which uses the evanescent
wave phenomenon [Pipino, 1999],
fibber-optic CRDS (F-CRDS) [Atherton et al., 2004],
ring-down spectral photography (RSP) – a broadband spectroscopy of optical losses
[Czyzewski et al., 2001, Stelmaszczyk et al., 2009, Scherer et al., 2001].
The greatest sensitivity of the method is characterized by P-CRDS, CW-CRDS and CEAS [Ye
et al., 1997, Berden et al., 2000]. For this reason they are often used for detecting and
measuring gas concentrations [Kasyutich et al., 2003b]. The P-CRDS method was first used
in 1988 to measure the absorption coefficient of gas [O'Keefe & Deacon, 1988]. Typical
schematic layout is shown in Fig. 4.
This method involves the use of a pulsed radiation source, characterized by a broad
spectrum of the pulse. This leads to the excitation of multiple longitudinal of the resonance
cavity, and also reduces the sensitivity. Sensitivity of the P-CRDS usually reaches values
corresponding to the absorption coefficients of the order of 10
-6
- 19
-10
cm
-1
[Busch & Busch,
1999].
Fig. 4. Diagram of the P-CRDS setup.
CW-CRDS for gas detection has been used since 1997 [Romanini et al., 1997]. A simplified
diagram of the experimental setup is shown in Fig. 5. The use of continuous operating lasers
in the CRDS technique was possible through the use of different laser beam modulators (e.g.
acusto-optic) [Berden et al., 2000]. Due to the narrow spectral lines available with these
lasers, operation in a single longitudinal mode is possible in longer optical cavities. Thanks
to this CW-CRDS has the highest sensitivity among the cavity enhanced methods. The
extreme sensitivity of this method reaches the level of absorption coefficients of up to
10
-14
cm
-1
. Due to the high spectral resolution of CW-CRDS, the method is often used in
absorption spectra measurements [Busch & Busch, 1999].
Optoelectronics – Devices and Applications
152
Fig. 5. Experimental CW-CRDS.
The main drawback of this method is the very high sensitivity of the mechanical instability.
If the laser frequency is matched to the cavity mode, there is a very efficient storage of light
(Fig. 6). However, fluctuations in the frequency of their own cavity, for example due to
a change in its length due to mechanical vibrations, cause the optical resonance
phenomenon to become impossible and it lead to high volatility of the output signal [Berden
et al., 2000].
Fig. 6. Coupling of the modes structure of the cavity and cw type laser in the CW-CRDS.
In 1998, R. Engeln proposed a new method – cavity enhanced absorption spectroscopy (also
called ICOS), whose principle of operation is very similar to CRDS. The main difference
relates to a laser and the optical cavity alignment [Engeln et al., 1998]. In this technique the
laser beam is injected at a very small angle in respect to the cavity axis (Fig. 7). As the result,
a dense structure of weak modes is obtained or the modes do not occur due to overlapping.
Sometimes, in addition to the output mirror, a piezoelectric-driven mount that modulates
the cavity length is used in order to prevent the establishment of a constant mode structure
within the cavity [Paul et al., 2001]. The weak mode structure causes that the entire system is
much less sensitive to instability in the cavity and to instability in laser frequencies.
Additionally, due to off-axis illumination of the front mirror, the source interference by the
optical feedback from the cavity is eliminated. CEAS sensors attain a detection limit of about
10
-9
cm
-1
[Berden et al., 2000, Courtillot et al., 2006]. Therefore, this method creates the best
opportunity to develop a portable optoelectronic sensor of nitrogen oxides.
Detection of Optical Radiation in
NOx Optoelectronic Sensors Employing Cavity Enhanced Absorption Spectroscopy
153
Fig. 7. The scheme of CEAS setup.
3.2 Methods for gas concentration determination used in cavity enhanced
spectroscopy
In the methods described in the previous section, several methods are used to determine the
gas concentration: by measuring the decay time of the signal, by measuring the phase shift
and by measuring the signal amplitude [Busch & Busch, 1999, Berden et al., 2000, Wojtas et
al., 2005].
If the laser pulse duration is negligibly short and only the main transverse mode of the
cavity is excited, then exponential decay of radiation intensity can be observed
0
() exp
t
It I
. (3)
If intrinsic cavity losses can be disregarded, the decay time of signal in the cavity (τ)
depends on the reflectivity of mirrors R, diffraction losses and the extinction coefficient α, i.e.
the scattering and absorption of radiation occurring in the gas filling the cavity
1
L
cRL
, (4)
where L is the length of the resonator, c - speed of light. Determination of the concentration
of the examined gas is a two-step process. First, measurement of the signal decay time (τ
0
) in
the optical cavity not containing the absorber (tested gas) is performed (Fig. 8-A), and then
measuring the signal decay time τ in the cavity filled with the tested gas is carried out
(Fig. 8-B). Knowing the absorption cross section (σ) of the examined gas, its concentration
can be calculated from the formula
0
11 1
C
c
, (5)
where
0
1
L
cR
. (6)
Optoelectronics – Devices and Applications
154
Fig. 8. Examples of signals at the output of the optical cavity without absorber (A) and at the
output of the cavity filled with absorber (B)
Based on equation (4) and (5), the lowest concentration (concentration limit) of analyzed gas
molecules (C
lmt
), which causes a measurable change of the output signal, can be determined
from the formula
0
1
1
lmt
R
C
cL
, (7)
where δ
τ
is the relative precision of the decay time measurement (uncertainty). The
relationship between uncertainty δ
τ
and τ
0
can be described as
0
0
100%
lmt
, (8)
where τ
lmt
denotes a decay time for minimal absorber concentration.
In the other hand, C
lmt
can be treated as the detection limit of the sensor. It is a function of
two variables: the decay time for the empty cavity (τ
0
) and uncertainty (δ
τ
). Furthermore, the
decay time τ
0
, according to the formula (6), depends on the length of the resonator and the
reflectivity mirrors. The longer this time, the longer effective path of absorption, the greater
the sensitivity of the sensor and the lower concentrations of the absorber can be measured.
Another way of gas concentration determination is measurements of the phase shift
between the respective harmonics of the signal (e.g. the first) at the input and output optical
cavity [Herbelin et al. 1980, Engeln et al. 1996]. In these measurements, lock-in amplifiers are
frequently used. The phase shift occurs due to cavity ability to the energy (radiation)
storage, as in the case of the charging process of the capacitor. The value of tan(φ) is
associated with the decay of radiation in the cavity dependence
4tan( ) f
, (9)
where f denotes the modulation frequency. The gas concentration can be calculated by
comparing the phase (φ) when the resonator is filled with test gas and the phase shift (φ
0
)
for the resonator without gas
0
4
11
() ( )
f
C
ctg tg
. (10)
Detection of Optical Radiation in
NOx Optoelectronic Sensors Employing Cavity Enhanced Absorption Spectroscopy
155
In techniques with an off-axis arrangement light source and optical cavity, the gas
concentration is often determined by measuring the amplitude of the signal from the
photodetector. Application of the system synchronization of laser and cavity modes is not
required. It simplifies the experimental system. Thanks to this, the intensity from individual
reflections of radiation from the output mirror can be summed [O'Keefe et al., 1999, O'Keefe,
1998]
2
(1 )
2ln( )
L
os in
L
Re
II
Re
. (11)
In the case of a single pass, the transmitted light pulse is described by
2
(1 )
L
op in
II Re
. (12)
Comparing expressions (11) and (12) it can be shown that for small absorption coefficients α
and high reflectivity mirrors (R → 1) ratio of the I
OS
/I
OP
can be expressed with the formula
11
21
2ln
os
op
I
IRL
RL
, (13)
thus
ln( )
os op
os
II
R
C
LI
. (14)
An important drawback of this method is the necessity of knowledge of the mirrors
reflectivity to determining the gas concentration. In practical realisations it is difficult to
ensure.
4. NO
x
sensors project
Basic experimental setups of the cavity enhanced methods were described in the third
section. All of them consist of pulse laser (or cw laser with modulator), beam directing and
shaping system (mirrors, diaphragms, diffraction grating), optical cavity and photoreceiver
with signal processing system (e.g. digital oscilloscope in the simplest case). First of all, the
sensor project should take into account the appropriate matching cavity parameters and the
laser emission wavelength to the test gas absorption spectrum (Fig. 9).
Fig. 9. Illustration of matching the laser emission wavelength and cavity mirrors transmission.
Optoelectronics – Devices and Applications
156
Moreover, it is necessary to apply adequate optical cavity, which provides repeatedly
reflection of the laser radiation. To ensure multiple reflections, the cavity must be stable, i.e.
the light after reflection from the mirrors must be re-focused (Fig. 10.a). In the case of an
unstable cavity, the laser beam after a few reflections leaves the cavity, and thus there are
large losses (Fig. 10.b).
Fig. 10. Schematic illustration of the reflections in stable cavity (a) and in unstable one (b).
For the cavity to be stable, the selected curvature rays of the mirrors (r
1
, r
2
) and the distance
between them (L) should be appropriate. The relation between these parameters describes
the so-called stability criterion [Busch & Bush, 1999]
12
01gg
, (15)
where the parameters g
1
and g
2
are respectively
1
1
1
L
g
r
, (16)
2
2
1
L
g
r
. (17)
The optical signal from the cavity is registered with a photoreceiver, the operating spectrum
of which should be matched to the selected absorption line of the gas. It usually is
characterized by high gain, high speed and low dark current. In addition to the
photodetector, the photoreceiver frequently includes different type of preamplifier which is
used to amplify the signal from the photodetector. The preamplifier should have a wide
dynamic range, low noises, high gain and an appropriately selected frequency band
[Rogalski & Bielecki, 2006]. Next, the signal from the preamplifier is digitized with a high
sampling rate (e.g. 100 MS/s). Data from the analogue-to-digital converter (ADC) are
transmitted to a computer, for example through a USB interface. Special computer software
provides processing of the measuring data and gas concentration determination. A scheme
of a signal processing in the cavity enhanced sensor is presented in Fig. 11.
Observation of NO
x
molecules can be done at electronic transitions which are characterized
by a broad absorption spectra providing a relatively large mean absorption cross section
within the range of several nanometres. Therefore the use of broadband multimode lasers is
possible. In the case of nitrogen dioxide, the absorption spectrum has a band in the 395 - 430
nm range with a mean cross section of about 6·10
−19
cm
2
(Fig. 12a). There are various light
sources applied, e.g. blue – violet LED’s or diode lasers or even broadband supercontinuum
sources [Wojtas et al., 2009, Holc et al., 2010, Stelmaszczyk et al., 2009].
Detection of Optical Radiation in
NOx Optoelectronic Sensors Employing Cavity Enhanced Absorption Spectroscopy
157
Fig. 11. Block diagram of NO
x
sensor.
Assuming that determination of the gas concentration basis on the temporal analysis, the
sensor sensitivity (in generally) depends on the mirrors reflectivity, cavity length and
uncertainty of decay time measurements (Fig. 12b). The sensitivities of the laboratory NO
2
sensors reach 0.1 ppb. Our approaches to the nitrogen dioxide sensor were already
described in several papers [Wojtas et al., 2006, Nowakowski et al., 2009].
Fig. 12. NO
2
absorption spectrum (a) and dependence of the concentration limit on the
cavity length and the reflectivity of mirrors R (b).
However, for many other compounds (like N
2
O and NO) the electronic transitions
correspond to the ultraviolet spectral range [HITRAN, 2008], where neither suitable laser
sources nor high reflectivity mirrors are available. For example, reflectivities of available UV
mirrors do not exceed the value of 90%. Therefore, a higher sensitivity of the NO and N
2
O
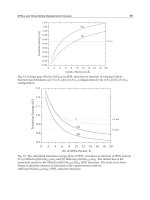
sensor can be obtained using IR absorption lines (Fig. 13).
Fig. 13. Detectable concentration limit versus cavity mirrors reflectivity in UV (a) and in IR
wavelength ranges (b).
Optoelectronics – Devices and Applications
158
The analyses show that the IR wavelength range provides the possibility to develop NO and
N
2
O sensor, the sensitivity of which could reach the ppb level (Rutecka, 2010). For instance,
at the wavelength ranges of 5.24 µm – 5.28 µm and 4.51 µm – 4.56 µm the absorption cross
section reaches the value 3.9x10
-18
cm
2
for N
2
O and 0.7 x10
-18
cm
2
for NO. Additionally, there
is no significant interference of absorption lines of other atmosphere gases (e.g. CO, H
2
O).
There could only be observed a low interference of H
2
O, which can be minimized with the
use of special particles of a filter or dryer. Both NO and N
2
O absorption spectrum are
presented in Fig. 14 and in Fig. 15 respectively.
In this spectral range, quantum cascade lasers (QCL) are the most suitable radiation sources
for experiments with cavity enhanced methods. Available QCL’s provide high power and
narrowband pulses of radiation [Namjou et al., 1998, Alpes Lasers SA]. The FWHM duration
time of their pulses reaches hundreds of microseconds pulses while the repetition rate might
be of some kHz. Moreover, their emission wavelength can be easy tuned to the maxima of
N
2
O and NO absorption cross section.
Fig. 14. NO absorption spectrum [Hitran, 2008].
Fig. 15. N
2
O absorption spectrum [Hitran, 2008].
5. Signal to noise ratio of the sensor
As we have seen, the reflectivity of the mirrors has a significant impact on the theoretical
sensitivity of the sensor. According to the equation (7), the sensor sensitivity is higher when
Detection of Optical Radiation in
NOx Optoelectronic Sensors Employing Cavity Enhanced Absorption Spectroscopy
159
the mirror reflectivity and cavity length are increased (Fig. 12 and Fig. 13). However, then a
lower level of optical signal reaches the photodetector. Therefore, the signal-to-noise ratio
(SNR) of the system is very important.
5.1 Optical cavity parameters
Usually, for the cavities, such parameters like, e.g., the finesse F, the time of a photon life τ
p
,
the transmission function T(R,λ) and signal-to-noise ratio S
cv
/N
cv
are determined [Wojtas &
Bielecki, 2008].
The finesse F characterizes the quality of the cavity and determines an effective number of a
roundtrip of optical radiation in the cavity up to its energy reaching the level of 1/e. The
finesse F can be found from the formula
1
R
F
R
. (18)
The time of a photon life is described by the equation
2
p
nLF
t
c
, (19)
where n is the refractive index. The transmission function of the optical cavity is known as
the Airy formula. It has the following form
2
22
(1 )
(,)
(1 ) 4 sin ( )
2
R
TR
RR
, (20)
where
is the radiation phase shift during one roundtrip inside the cavity
4 nL
, (21)
and λ is the optical radiation wavelength. The graphical representation of Eq. (20) is
presented in Fig. 16.
Fig. 16. Graphical representation of the transmission function of an optical cavity.
Optoelectronics – Devices and Applications
160
It shows a strong influence of the mirrors reflectivity on the selectivity of an optical cavity.
The transmission of the cavity is maximum wherever
is the integral multiple of 2π.
The optical cavity signal-to-noise ratio (S
cv
/N
cv
) is connected with its transmission function.
S
cv
/N
cv
is directly proportional to the power of radiation matched to the transmission
function of a cavity and to an absorption band of the examined gas. However, S
cv
/N
cv
is
inversely proportional to the power of undesirable radiation transmitted through a cavity
because of non-zero values of the mirrors’ transmissions. The formula describing a signal-to-
noise ratio of the cavity is
2
2
((),)
()
()
1()
cv
cv
TR
S
N
R
. (22)
Assuming that a length of optical cavity is 0.5 m and it is consists of two concave mirrors
with the reflectivity of 0.999976, then S
cv
/N
cv
=1.710
9
(F = 1.3
10
5
, τ
f
=5.2
10
–4
s).
5.2 Analysis of detection system parameters
Due to the high value of SNR of the optical cavity, the signal-to-noise ratio of an electronic
circuit is the crucial parameter of the cavity enhanced sensor. The signal from the cavities is
registered with different types of photodetectors; depending on the spectral range. In the
case of ultraviolet (UV), visible (VIS) and near infrared (NIR) region (approximately from
form 100 nm up to 1.5 µm) the most popular are photomultiplier tubes (PMT’s). They are
characterized by high gain, high speed and low dark current. Because of PMT high
resistance, transimpedance preamplifiers are usually used to amplify signal from PMT. They
are characterized by a wide dynamic range [Rogalski & Bielecki, 2006].
In the medium infrared (MIR) part of the spectrum there are two types of photodetectors:
thermal and quantum. Thermal photodetectors use infrared energy as heat, and their
responsitivity is independent of the wavelength. But they have disadvantages because their
response time is slow and detectivity is low. Therefore, quantum photodetectors are used in
the practical implementations of cavity enhanced methods. They offer higher responsitivity
and faster response speed. To achieve higher performance, i.e. a wider frequency band and
higher detectivity (D*), they are cooled. There are several cooling methods: thermoelectric
cooling (TEC), cryogenic cooling (e.g. dry ice or liquid nitrogen) and mechanical cooling
(e.g. Stirling coolers). The most popular are HgCdTe (mercury-cadmium-telluride, MCT)
photoconductive and photovoltaic detectors. There are available MCT photodetectors that
use monolithic optical immersion technology and TEC cooling. They offer high detectivity
(about 10
12
cm·√Hz/W) and high speed (up to 1GHz). To amplify the signal from the MCT
photodetector, transimpedance preamplifiers are applied as well [Hamamatsu, 2011,
Piotrowski et al., 2004, VIGO System S.A.].
5.2.1 Photoreceiver with photomultiplier tube
To determine the signal-to-noise ratio of the photoreceiver, the PMT equivalent scheme is
necessary. The scheme is presented in Fig. 17. The current source I
s
represents the current of
useful signal, R
p
and C
p
are the resistance and capacitance of the photomultiplier
respectively [Wojtas et al., 2008].
PMT noise sources are as follows: the current source I
ns
represents the shot noise from useful
signal, the current source I
nd
represents shot noise of anode dark current, I
nb
is the current
sources of noise from background radiation and I
nRL
is the thermal noise of load resistance.
Detection of Optical Radiation in
NOx Optoelectronic Sensors Employing Cavity Enhanced Absorption Spectroscopy
161
Fig. 17. PMT equivalent scheme.
In the case when all the described noise sources will be taken into consideration, PMT
signal-to-noise ratio can be determined by the formula [Wojtas & Bielecki, 2008]
2
2222
ph
s
ph
ns nd nb nRL
S
I
N
IIII
. (23)
Assuming that during cavity enhanced experiments background noise can be eliminated,
and a photoemission process is described by the Poisson model, and all stages of PMT will
have the same gain, then
2
4
2
1
ph s p p
on
ph
nppsda
L
S(PSG)
kT f
N
qf(GSPI)
R
, (24)
where
P
s
is the power of optical radiation, G
p
is the PMT gain, S
p
is the photocathode
sensitivity,
q is the electron charge, Δf
n
is the noise bandwidth, I
da
is the anode dark current,
δ is one stage of the PMT gain, k is the Boltzmann constant, and T
0
is the temperature [Flyckt
& Marmonier, 2002].
The noise bandwidth can be determined from the formula
3
1
24()
ndB
LL p
ff
RC C
, (25)
where
Δf
3dB
represents 3dB frequency bandwidth.
Because PMT can be treated as a current source the best preamplifier configuration is a
transimpedance preamplifier. Moreover, its input circuit does not affect photodetector
polarization. The scheme of a transimpedance preamplifier is presented in Fig. 18.
In the case when one photoelectron is emitted by the PMT photocathode, the output voltage
signal of the transimpedance preamplifier can be described by the formula
''
exp exp
pf
prm
i
feqi feq
qG R
tt
V
t
RC t RC
, (26)
where
C
eq
’ is PMT and a load circuit equivalent capacitance located in the feedback circuit,
and
t
i
is PMT pulse duration. The Miller theorem states that C
eq
’ is (G
OL
+ 1) times lower then
C
eq
(G
OL
is the amplifier open-loop gain). In the appropriate developed circuit, the value of
C
eq
’ is lower than 0.1 pF.
Optoelectronics – Devices and Applications
162
Fig. 18. Scheme of the transimpedance preamplifier.
Analysis showed that an increase in
R
f
caused that the output pulse duration is longer and
longer (Fig. 19). Because of this, to reach a high value of gain and to avoid signal distortion,
the next stage of amplifier should be used. Because of the low output resistance of the
transimpedance preamplifier (< 50 Ω), a voltage amplifier can be used.
Fig. 19. Example of transimpedance preamplifier output signal.
To determine the
SNR of the photoreceiver, an equivalent scheme is necessary (Fig. 20).
Fig. 20. Equivalent scheme of the first stage of the photoreceiver.
The noise of the operational amplifier is represented by the voltage source
V
nopa
and the
current source
I
nopa
. The noise source I
nph
is equivalent to the PMT noise. In this case, the total
current noise
I
nt
is described by the formula
Detection of Optical Radiation in
NOx Optoelectronic Sensors Employing Cavity Enhanced Absorption Spectroscopy
163
22
22 2
pf nRf
nt np nopa nopa
pf f
RR V
II V I
RR R
, (27)
where
V
nRf
is the thermal noise determined by the equation
2
4
nR
f
o
f
n
VkTR
f
. (28)
The output voltage noise of the transimpedance preamplifier can be defined as
n
p
rm nt
f
VIR
, (29)
and of the
SNR of the photoreceiver can be described with the formula
2
2
.
prm
s
prm
nt
pmt
S
I
N
I
(30)
Usually, the amplified signal from the preamplifier is fed to an analogue digital converter
(ADC). This circuit also adds its noise. Assuming a 12-bit ADC and the same quantization
steps
δ
adc
, its noise can be determined by the formula
2
2
12
adc
nadc
V
. (31)
The analysis showed that the
SNR of the detection system consists of PMT, preamplifier and
ADC, and can be described by the formula
2
2
22
sp p f
adc
adc
fn nadc
pmt
PS G R
S
N
Rf V
, (32)
where
2
2
4
2( )
1
pf
o
p p s da nopa nopa
pf f
RR
kT
qGSP I V I
RR R
. (33)
5.2.2 Photoreceiver with a MCT photodiode
The noise equivalent scheme of the photoreceiver using a MCT photodiode and a
transimpedance preamplifier is presented in Fig. 21. The signal current generator
I
ph
represents the detected signal. Noises in a photodiode are represented by three noise
generators:
I
nph
- the shot noise associated with photocurrent, I
nd
- the shot noise of a dark
current, while
I
nb
- the shot noise from a background current [Bielecki 2002].
In the scheme, the value of the load resistance of the photodetector depends on the feedback
resistance
R
f
and the preamplifier gain G. The resistor R
f
affects both the level of the
preamplifier output signal and its noise. The noise current generator
I
nf
is the thermal noise
current and excess noise of the feedback resistance. Since the thermal noise of
I
nf
is inversely
related to the square root of the resistance,
R
f
should be of great value. The R
sh
is the shunt
Optoelectronics – Devices and Applications
164
Fig. 21. Scheme of the photoreceiver with a photodiode.
resistance of a photodiode. The equivalent photoreceiver noise is the square root of each
component noise squares sum [Bielecki et al., 2009]. Thus, the signal-to-noise ratio can be
described with the simplified expression
2
2
2
2222
22
4
1
prm ph
prm
pht
eq
nphndnbnopa nopa
f
eq
SI
N
R
kT f
IIII V
R
, (34)
where
f
sh
eq
f
sh
RR
R
RR
and
e
q
e
qf
d
RC C
. (35)
Only the modulus of feedback loop impedance and photodetector impedance is included.
Furthermore, it could be assumed that in experiments applying cavity enhanced methods,
current
I
nb
can be ignored. Moreover, intensity of the radiation reaching the photodiode is
rather low, thus shot noise associated with the photocurrent is negligibly. In practical
realisations (low frequency and
R
sh
>>R
f
), the SNR of the system consisting in a photodiode,
preamplifier and ADC can be determined from equation
2
2
2
1/2
22
() 4
*
is
adc
adc
pht
nopa
i
no
p
anadc
ff
RP
S
N
V
RAf kTf
IV
DRR
, (36)
where
R
i
- photodiode current responsitivity, A – detector active area.
5.3 Methods of SNR improving
Analyses in the previous section showed a significant influence of preamplifier feedback
resistance (
R
f
) on the output photoreceiver signal. In an appropriately developed
photoreceiver, the preamplifier shouldn’t degrade photoreceiver performance. In Fig. 22
ADC noise, preamplifier noise and photodetector noise for different values of
R
f
were
presented.
Detection of Optical Radiation in
NOx Optoelectronic Sensors Employing Cavity Enhanced Absorption Spectroscopy
165
Fig. 22. Comparison noise sources of electronic circuit for different values of
R
f
.
In the case of
R
f
= 100 Ω, the highest influence on the total electronic system noise was
preamplifier noise at
92%. However, an increase in R
f
caused a decrease in influence
preamplifier noise on the total signal processing system noise. For R
f
= 100 kΩ, the noise
of photodetector is equal to
93% of the total signal processing system noise and
preamplifier is only
6%. ADC noise is below 8%. Furthermore, the value of R
f
also has
a strong influence on the bandwidth of the system. In Fig. 23, the dependence SNR of
the signal processing system and a preamplifier output pulse fall time on the R
f
is
presented.
Fig. 23. Dependence of electronic circuit
SNR and fall time of output pulse on resistance R
f
.
Optoelectronics – Devices and Applications
166
Fig. 24. Voltage noise (a) and current noise density (b) of the photoreceiver.
Experiments have shown that in the low frequency region the
1/f noise is dominant
(Fig. 24a). Therefore, in order to minimize the adverse impact of such noise on the
detectivity of the receiver (and
SNR as well), a high pass filter is frequently used which
limits the frequency bandwidth by several kilohertz. In the higher frequency region, there is
dominant
g-r noise by recombination of electrons and holes. Although the density of this
noise is less than
1/f (Fig. 24b), the upper limit frequency should be suitably matched to the
recorded signal bandwidth to avoid
SNR degradation.
SNR
of the cavity enhanced system can be additionally improved by the use of one of the
advanced methods of signal detection, i.e. coherent averaging [Lyons, 2010]. This technique
can be implemented in the software of the digital signal processing system. The software is
usually installed in a personal computer. Thanks to this, increase in the
SNR is directly
proportional to the root of a number of the averaging samples
n
smpl
,
1
.
cmp
adc
adc
cmp
smpl
S
N
S
N
n
(37)
Thanks to improving
SNR, uncertainty of decay time determination is likely to reach values
below 0.5% (e.g. in the case of 10 000 averaging samples). Hence, the detection limit can
achieve the value of about 2×10
–9
cm
–1
(Fig. 25).
Fig. 25. Dependence cavity enhanced sensor sensitivity on decay time precision
determination and cavity mirrors reflectivity.
Detection of Optical Radiation in
NOx Optoelectronic Sensors Employing Cavity Enhanced Absorption Spectroscopy
167
6. Conclusion
In this chapter, characterisations of absorption spectroscopy methods were shown. The
methods provide the possibility of absorption spectra investigations. This kind of spectra
can be defined as the set of all electron crossings from lower energy levels to higher ones.
They caused an increase in molecules energy. In practical implementations, a source of
radiation and very sensitive photoreceiver is used which records radiation passing through
the absorber sample. One of the most common gas detection systems is differential optical
absorption spectroscopy. Such arrangements are applied to the monitoring of atmospheric
pollutants, including the detection of NO
x
, in terrestrial applications, in air and in space, e.g.
GOME and SCIAMACHY satellite.
Cavity enhanced spectroscopy is the one of the most sensitive absorption methods. The
greatest sensitivity is provided by P-CRDS, CW-CRDS and CEAS methods. CRDS was
applied to determine the mirrors reflectivity for the first time in the early 1980’s. This
method provides a much higher sensitivity than conventional absorption spectroscopy. An
optical cavity with a high quality is applied that is made up of two concave mirrors with
very high reflectance
R. This results in a long optical path, even up to several kilometres. To
determine the gas concentration several different methods are used: by measuring the decay
time of the signal, by measuring the phase shift, and by measuring the signal amplitude. All
of them were described in detail.
Furthermore, the basic experimental setups of cavity enhanced methods were described.
Generally, they consist of pulse laser (or cw laser with modulator), beam directing and
shaping system (mirrors, diaphragms, diffraction grating), optical cavity and photoreceiver
with signal processing system (e.g. digital oscilloscope in the simplest case). First of all, the
sensor project should take into account the appropriate matching cavity parameters and the
laser emission wavelength to the test gas absorption spectrum.
Observation of NO
x
molecules can be done at electronic transitions which are characterized
by a broad absorption spectra providing a relatively large mean absorption cross section
within the range of several nanometres. Therefore, using broadband multimode lasers is
possible. However, for many other compounds (like N
2
O and NO), the electronic transitions
correspond to an ultraviolet spectral range, where neither suitable laser sources nor high
reflectivity mirrors are available. Therefore, a higher sensitivity of the NO and N
2
O sensor
can be obtained using an IR absorption line.
It was shown that reflectivity of the mirrors has a significant impact on the theoretical
sensitivity of the sensor. The sensor sensitivity is higher when the mirror reflectivity and
cavity length are increased. However, then a lower level of optical signal reaches the
photodetector. Therefore, the signal-to-noise ratio of the system is very important. Thus
analyses of the main parameters of the optical cavity, photoreceiver and the signal
processing system were performed. In the analyses the most popular photodetectors were
taken into consideration. In the UV, VIS and NIR spectral regions, the photomultiplier is
characterized with high performance. Photodetectors designed for MIR operation require an
additional cooling system. Thanks to this they can achieve a higher performance, i.e. a wider
frequency band and higher detectivity (
D*). Because of the many advantages, MCT
photodetectors are frequently used in cavity enhanced applications.
Optoelectronics – Devices and Applications
168
Analyses showed a significant influence of preamplifier feedback resistance (R
f
) on the
output photoreceiver signal. In appropriately developed photoreceiver, the preamplifier
shouldn’t degrade photoreceiver performance. The
SNR of the cavity enhanced system can
be additionally improved by the use of one of the advanced methods of signal detection, i.e.
coherent averaging.
Cavity enhanced sensors are able to measure NO
x
concentration at ppb level. Their
sensitivity is comparable with the sensitivities of instruments based on other methods, e.g.
gas chromatography or mass spectrometry. The developed sensor can be applied for
monitoring atmosphere quality. Using the sensor, the detection of vapours from some
explosive materials is also possible.
7. Acknowledgment
The researchers are supported by the Ministry of Science and High Education of Poland in
2009-2011.
8. References
Alpes Lasers SA, 1-3 Max de-Meuron, C.P. 1766, CH-2001 Neuchâtel,
Atherton, K.J., Yu, H., Stewart, G. & Culshaw, B. (2004). Gas detection with fibre amplifiers
by intra-cavity and cavity ring-down absorption,
Measurement Science and
Technology
Vol. 15, pp. 1621–1628
Berden, G., Peeters, R. & Meijer, G. (2000). Cavity ring-down spectroscopy: Experimental
schemes and applications, International Reviews In Physical Chemistry, Vol. 19,
No. 4. pp. 565-607
Bielecki, Z. (2002). Maximization of signal to noise ratio in infrared radiation receivers,
Opto-
Electron. Rev.
, 10, pp. 209-216
Bielecki, Z., Kolosowski, W., Sedek, E., Wnuk, M. & Wojtas, J. (2009). Multispectral detection
circuits in special application,
Transactions on Modelling and Simulations, WIT Press –
WIT, Vol 48, Print ISBN: 1-84564-187-0; On-line ISBN: 1-84564-364-5; Print ISSN:
1746-4064, pp. 217-228
Busch, K.W., Busch, M.A. (1999).
Cavity-Ringdown Spectroscopy, ACS Symposium series,
American Chemical Society, Washington DC
Chudzynski, S., Czyzewski, A., Skubiszak, W., Stacewicz, T., Stelmaszczyk, K., Szymanski,
A. & Ernst, K. (1999). Practical solutions for calibration of DIAL system, Optica
Applicata 29, pp. 477 – 485
Courtillot I., Morville J., Motto-Ros & Romanini D. (2006). Sub-ppb NO2 detection by optical
feedback cavity-enhanced absorption spectroscopy with a blue diode laser.
Appl.
Phys. B
, 85, pp. 407–412
Czyzewski, A., Chudzynski, S., Ernst, K., Karasinski, G., Kilianek, L., Pietruczuk, A.,
Skubiszak, W., Stacewicz, T., Stelmaszczyk, K., Koch, B. & Rairoux, P. (2001).
Cavity Ring-Down Spectrography,
Optics Commun, 191, 271 – 275
Drescher, S.R., Brown, S.D. (2006). Solid phase microextraction-gas chromatographic-mass
spectrometric determination of nitrous oxide evolution to measure denitrification
Detection of Optical Radiation in
NOx Optoelectronic Sensors Employing Cavity Enhanced Absorption Spectroscopy
169
in estuarine soils and sediments, Journal of Chromatography A, 1133(1–2), pp. 300–
304
Engeln, R., Berden, G. & Meijer, G. (1996). Phase shift cavity ring down absorption
spectroscopy,
Chemical Physic Letters, 262, pp. 105 – 109
Engeln, R., Berden, G., Peeters, R. & Meijer, G. (1998). Cavity enhanced absorption and
cavity enhanced magnetic rotation spectroscopy,
Review Of Scientific Instruments,
Vol. 69, No. 11, pp. 3763 – 3769
Flyckt, S.O., Marmonier, C. (2002).
Photomultiplier tubes, principles, and applications, Photonics,
Brive, France
Godish, T. (2004).
Air Quality, Lewis Publishers, ISBN 156670586X, 9781566705868
Grossel, A., Ze´ninari, V., Joly, L., Parvitte, B., Durry, G. & Courtois, D. (2007). Photoacoustic
detection of nitric oxide with a Helmholtz resonant quantum cascade laser sensor,
Infrared Physics & Technology, 51, pp. 95–101
Hamamatsu, Solid State Division (2011).
Technical information SD-12, Characteristics and use of
infrared detectors
, Cat. No. KIRD9001E04, Mar. 2011 DN
He, Y., Orr, B.J. (2000). Ringdown and cavity-enhanced absorption spectroscopy using a
continuous-wave tunable diode laser and a rapidly swept optical cavity,
Chemical
Physics Letters
, 319, pp. 131–137
Herbelin, J.M., McKay, J.A , Kwok, M.A., Ueunten, R.H., Urevig, D.S., Spencer, D.J. &
Benard, D.J. (1980). Sensitive measurement of photon lifetime and true reflectances
in optical cavity by a phase-shift method,
Applied Optics, Vol. 19, Issue 1, pp. 144-
147
HITRAN (2008). High-resolution transmission molecular absorption database,
Holc, K., Bielecki, Z., Wojtas, J., Perlin, P., Goss, J., Czyzewski, A., Magryta, P. & Stacewicz,
T. (2010). Blue laser diodes for trace matter detection,
Optica Applicata, Vol. XL, No.
3, 2010, pp. 641-651
Horii, C.V., Zahniser, M.S., Nelson, D.D., McManus, J.B. & Wofsy, S.C. (1999). Nitric Acid
and Nitrogen Dioxide Flux Measurements: a New Application of Tunable Diode
Laser Absorption Spectroscopy,
Proc.SPIE, v. 3758, pp. 152-161
Jean-Franqois, D., Ritz, D. & Carlier, P. (1999). Multiple-pass cell for very-long-path infrared
spectrometry, Applied Optics, Vol. 38, No. 19, pp. 4145-4151
Kasyutich, V.L., Bale, C.S.E., Canosa-Mas, C.E., Pfrang, C., Vaughan , S. & Wayne, R.P.
(2003a). Off-axis continuous-wave cavity-enhanced absorption spectroscopy of
narrow-band and broadband absorbers using red diode lasers,
Applied Physics B,
Vol. 75, pp. 755-761
Kasyutich, V.L., Bale, C.S.E., Canosa-Mas, C.E., Pfrang, C., Vaughan, S. & Wayne, R.P.
(2003b). Cavity-enhanced absorption: detection of nitrogen dioxide and iodine
monoxide using a violet laser diode,
Applied Physics B, Vol. 76, No. 6, pp. 691-
698
Karasinski, G., Kardas, A.E., Markowicz, K., Malinowski, S.P., Stacewicz, T., Stelmaszczyk,
K., Chudzynski, S., Skubiszak, W., Posyniak, M., Jagodnicka, A.K., Hochhertz, C. &
L. Woeste (2007). LIDAR investigation of properties of atmospheric aerosol,
The
European Physical Journal Special Topics
, 144, pp. 129−138
Optoelectronics – Devices and Applications
170
Lagalante, A.F. (1999). Atomic Absorption Spectroscopy: A Tutorial Review, Applied
Spectroscopy Reviews
, Vol. 34(3), pp.173–189
Li, P., Shi, K. & Liu, Z. (2005). Optical scattering spectroscopy by using tightly focused
supercontinuum,
Optics Express, Vol. 13, No. 22, pp. 9039-9044
Lyons, R.G. (2010).
Understanding Digital Signal Processing, Addison Wesley Pub Co Inc., 3rd
Edition, ISBN-13: 978-0-13-702741-5, ISBN-10: 0-13-702741-9
Martin, R.V., Parrish, D.D., Ryerson, T.B., Nicks Jr., D.K., Chance, K., Kurosu, T.P., Jacob,
D.J., Sturges, E.D., Fried, A. & Wert, B.P. (2004). Evaluation of GOME satellite
measurements of tropospheric NO
2
and HCHO using regional data from aircraft
campaigns in the southeastern United States,
Journal of Gophysical Research, Vol. 109,
11 pp.
Mierczyk, Z., Zygmunt, M., Gawlikowski, A., Gietka, A., Kaszczuk, M., Knysak, P.,
Mlodzianko, A., Muzal, M., Piotrowski, W. & Wojtanowski, J. (2008). Two-
wavelength backscattering lidar for stand off detection of aerosols, Lidar
Technologies, Techniques, and Measurements for Atmospheric Remote Sensing IV.
Edited by Singh, Upendra N.; Pappalardo, Gelsomina.
Proceedings of the SPIE,
Volume 7111, pp. 71110R-71110R-9
Moore, D.S. (2007). Recent Advances in Trace Explosives Detection Instrumentation,
Sens
Imaging
, 8, pp. 9–38
Namjou, K., Cai, S., Whittaker, E.A., Faist, J., Gmachl, C., Capasso, F., Sivco, D.L. & Cho,
A.Y. (1998) .Sensitive absorption spectroscopy with a room-temperature
distributed-feedback quantum-cascade laser,
Optics Letters, V23, 3, pp. 219 –
221
Noel, S., Bovensmann, H., Burrows, J.P., Frerick, Chance’, J., K.V. & Goede, A.H.P. (1999).
Global Atmospheric Monitoring with SCIAMACHY,
Physal. Chemical. Earth, Vol.
24, No. 5, pp. 427-434
Nowakowski M., Wojtas J., Bielecki Z., & Mikolajczyk J. (2009). Cavity enhanced absorption
spectroscopy sensor, Acta Phys. Pol. A, 116, 363–367
O'Keefe, A. (1998). Integrated cavity output analysis of ultra-weak absorption,
Chemical
Physics Letters
, 293 (5-6), pp. 331-336
O'Keefe, A., Deacon, D.A.G. (1988). Cavity ring-down optical spectrometer for absorption
measurements using pulsed laser sources,
Review of Scientific Instruments, No. 59,
pp. 2544-2554
O'Keefe, A., Scherer, J.J. & Paul, J.B. (1999). CW integrated cavity output spectroscopy,
Chemical Physic Letters, 307 (5-6), pp. 343-349
Owsik J., Janucki J. (2004). Laser-induced breakdown spectrometer for non-destructive
diagnostics”,
Proc. SPIE, 4962, pp. 135–142
Paul, J.B., Lapson, L. & Anderson, J.G. (2001). Ultrasensitive absorption spectroscopy with a
high-finesse optical cavity and off-axis alignment, Applied Optics, Vol. 40, No. 27,
pp. 4904-4910
Piotrowski A., Madejczyk P., Gawron W., Klos K., Romanis M., Grudzien M., Rogalski A. &
Piotrowski J. (2004). MOCVD growth of Hg1xCdxTe heterostructures for uncooled
infrared photodetectors. Opto-Electron. Rev., 12, pp. 453–458
Detection of Optical Radiation in
NOx Optoelectronic Sensors Employing Cavity Enhanced Absorption Spectroscopy
171
Pipino, A.C.R. (1999). Ultrasensitive surface spectroscopy with a miniature optical resonator,
Physical Rewiew Letters, Vol. 83, No. 15, pp. 3093-3096.
Rogalski, A., Bielecki, Z. (2006). Detection of optical radiation (chapter A1.4),
Handbook of
optoelectronics
, Taylor & Francis, New York, London pp. 73-117
Romanini, D., Kachanov, A. A., Sadeghi, N. & Stoeckel, F. (1997). Diode laser cavity ring
down spectroscopy, Chemical Physics Letters, No 270, pp. 538-545
Rutecka, B., Wojtas, J., Bielecki, Z., Mikołajczyk, J. & M. Nowakowski. (2010). Application of
an optical parametric generator to cavity enhanced experiment.
Proc. of SPIE, vol.
7745, pp. 77450I-1- 77450I-8
Saleh B.E.A., Teich M.C. (2007).
Fundamentals of Photonics, John Wiley & Sons, 2nd Edition
ISBN: 978-0-471-35832-9
Scherer, J.J., Paul, J.B., Jiao, H. & O’Keefe, A. (2001). Broadband ringdown spectral
photography,
Applied Optics, Vol. 40, No. 36, pp. 6725-6732
Shimadzu Scientific Instruments, 7102 Riverwood Drive, Columbia, MD 21046, Available
from:
Sigrist, M.W. (1994).
Air monitoring by spectroscopic techniques, John Wiley & Sons, ISBN-10: 0-
471-55875-3. ISBN-13: 978-0-471-55875-0
Stelmaszczyk, K., Fechner, M., Rohwetter, P., Queißer, M., Czyzewski, A., Stacewicz, T. & L.
Wöste, (2009). Towards Supercontinuum Cavity Ringdown Spectroscopy,
Appl.
Phys. B
, 94, pp. 396–373
Stelmaszczyk, K., Rohwetter, P., Fechner, M., Queißer, M., Czyzewski, A., Stacewicz, T. &
Wöste, L. (2009). Cavity Ring-Down Absorption Spectrography Based
on Filament-Generated Supercontinuum Light,
Optics Express, 17(5), 3673 –
3678
VIGO System S.A.,
glowna
Wang, P., Richter, A., Bruns, M., Burrows, J.P., Junkermann, W., Heue, K.P., Wagner, T.,
Platt, U. & Pundt, I. (2005). Airborne multi-axis DOAS measurements of
tropospheric SO2 plumes in the Po-valley, Italy,
Atmosphric. Chemical. Physics
Discussion
, No 5, pp. 2017–2045
Wojtas, J., Bielecki, Z. (2008). Signal processing system in the cavity enhanced spectroscopy.
Opto-Electron. Rev., 16(4), pp. 44-51
Wojtas, J., Bielecki, Z., Mikołajczyk, J. & Nowakowski, M. (2008). Signal processing system
in portable NO
2
optoelectronic sensor, Sensor+Test 2008 Proceedings, Nurnberg,
Germany pp. 105-108
Wojtas, J., Bielecki, Z., Stecewicz, T., Czyżewski, A., Mikołajczyk, J., Nowakowski, M. &
Rutecka, B. (2009). Ultrasensitive NOx optoelectronic sensor.
Photonics Letters of
Poland
, Vol. 1 (2), pp.85-87
Wojtas, J., Czyzewski, A., Stacewicz, T. & Bielecki, Z. (2006). Sensitive detection of NO
2
with
Cavity Enhanced Spectroscopy,
Optica Applicata, Vol. 36, No. 4, pp. 461-
467
Optoelectronics – Devices and Applications
172
Wojtas, J., Czyżewski, A., Stacewicz, T., Bielecki, Z. & Mikolajczyk J. (2005). Cavity
enhanced spectroscopy for NO2 detection, Proc. SPIE Vol. 5954, pp. 174-
178
Ye, J., Ma, L.S. & Hall, J.L. (1997). Ultrasensitive high resolution laser spectroscopy and its
application to optical frequency standards,
28th Annual Precise Time and Time
Interval (PTTI) Applications and Planning meeting, Proceedings
, L. A. Breakiron, Ed.,
US Naval Observatory, Washington D.C., p. 289
9
Use of Optoelectronics to Measure Biosignals
Concurrently During Functional Magnetic
Resonance Imaging of the Brain
Bradley J MacIntosh
1,2
, Fred Tam
1
and Simon J Graham
1,2
1
Sunnybrook Research Institute, Sunnybrook Health
Sciences Centre, Toronto, Ontario
2
Department of Medical Biophysics, University of Toronto,
Toronto, Ontario
Canada
1. Introduction
In the rapidly advancing world of biomedical imaging and engineering, magnetic resonance
imaging (MRI) has become an indispensable technique to visualize normal and diseased
anatomy non-invasively in the human body. The 2003 Nobel prize in Physiology and
Medicine to biophysicists Lauterbur and Mansfield is a testament to the significant health
care advances that have followed from the early development of MRI technology. In the
past three decades, MRI technology has not only matured, but has continued to diversify to
encompass new applications in science and medicine. The focus of this chapter is one such
application, that involves use of optoelectronic devices to measure electrical biosignals
during concurrent mapping of brain activity with a technique called functional MRI (fMRI).
Since the development of early MRI systems, there has been an ongoing need to develop
ancillary devices adjacent to or within the magnet bore. For example, clinical MRI systems
are now equipped with sensors to measure heart rate, respiratory rate, and
electrocardiograph signals that provide essential summaries of the physiological status of
the patient during scanning. These and other devices (e.g. wheelchairs, incubators, power
injectors to deliver drugs and contrast agents, and interventional devices such as catheters)
cover a wide range of functions and electromechanical complexity. However, they are all
carefully designed with common consideration of several critical factors. The MRI system
uses three electromagnetic fields to produce an image. First, radio-frequency (RF) coils are
used to transmit and receive RF fields to and from the patient, at a frequency of
approximately 100 MHz. Second, a very strong, static, homogeneous main magnetic field is
required primarily for signal-to-noise ratio (SNR) considerations. This field typically has a
strength of 1.5 or 3.0 Tesla, or approximately 50 000 – 100 000 times the strength of the
Earth’s magnetic field, with spatial uniformity to approximately less than 1 part per million
over a 20 cm diameter spherical volume. Third, time-varying magnetic gradient fields are
produced along orthogonal directions by gradient coils to encode MRI signals spatially,
with amplitudes of approximately 10 mT/m and slew rates of approximately 100 T/m/s.