Volume 08 - Mechanical Testing and Evaluation Part 2 docx
Bạn đang xem bản rút gọn của tài liệu. Xem và tải ngay bản đầy đủ của tài liệu tại đây (4.81 MB, 150 trang )
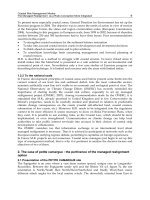
Fig. 25 Finite element model of a strip under tension and containing a hole. Source: Ref 24
Along the vertical line of symmetry, each nodal point is permitted to move vertically but not laterally. Along
the horizontal line of symmetry, each node is permitted to move laterally but not vertically. These constitute the
constraints on the problem.
At each of the nodal points along the upper surface, equal loads are applied that add up to the total applied load.
Alternatively, uniform small displacements in the vertical direction can be applied to each node along the upper
surface. This constitutes the loading for the problem. The material behavior is represented by elastic modulus,
E, and Poisson ratio, ν, in the constitutive equations, Eq 23a, 23b, and 23c.
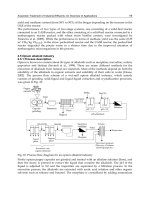
Results of solution of the simultaneous equations for all elements are shown in Fig. 26. Note that the axial
stress, σ
y
, along the horizontal plane through the hole has a peak value at the edge of the hole. Also, a small
lateral stress distribution, σ
x
, occurs along the horizontal plane of symmetry. Note that, along the vertical
centerline, the axial stress is zero at the hole and then increases to the applied stress, while the lateral stress is
compressive.
Fig. 26 Stress distributions calculated for the model shown in Fig. 25. Source: Ref 24
To evaluate failure by yielding, the stresses in each element of the model can be substituted into Eq 24. The
resulting stress magnitude is called the von Mises stress and can be compared to the material yield strength, σ
o
,
to determine if yielding will occur. For example, Fig. 27 shows a contour plot of the von Mises stress for the
problem shown in Fig. 25. Note that yielding would occur first at the inside of the hole and propagate along a
45° plane, illustrated by the band of high von Mises stress.
Fig. 27 Contour plot of von Mises stress for the model in Fig. 25. Source: Ref 24
As another example, a finite element analysis of the contact bearing load, described previously in Fig. 22, is
shown in Fig. 28 (Ref 24). A contour plot of the calculated von Mises stress (Fig. 29) shows a potential
subsurface failure point, as described previously by classical stress analysis (Fig. 22).
Fig. 28 Finite element model for contact stresses between a roller and flat plate, as in Fig. 22. Source: Ref
24
Fig. 29 Contour plot of von Mises stress beneath the zone of contact
These examples illustrate that finite element analysis tools provide deep insight into the mechanical behavior of
materials for product design, but physical validity of the analytical results is a prime concern for designers who
make decisions based on these results. Valid results depend on proper definition of the problem in terms of the
meshing (element shape and size), loading (boundary conditions and constraints), and material characteristics
(constitutive relations). Setting up a valid problem and evaluating the results are greatly enhanced by
knowledge of the stress, strain, and mechanical behavior of materials under the basic loading conditions
presented in the previous paragraphs. Often, the cost and time for finite element analysis can be precluded by
learned application of the knowledge of the basic modes of loading. This is the basis for the Cambridge
Engineering Selector (Ref 1). On the other hand, some problems are so complex that only finite element
analysis can provide the necessary information for design decisions. Analysts' and designers' skill and
experience are the bases for judgment on the level of sophistication required for a given design problem.
Additional information on finite element methods is provided in the article, “Finite Element Analysis” in
Materials Selection and Design Volume 20 of ASM Handbook.
Material Testing for Complex Stresses. In all of the cases given above for complex stresses, the tensile yield
strength and the elastic properties, E and ν, are the key material parameters required for accurate design
analyses. The yield criterion, using the tensile yield strength, σ
o
, is used to predict failure by yielding. All of
these material parameters can be determined by tension testing.
The prediction of failure by yielding is also useful for prediction of the sites for fracture since localized yielding
usually precedes fracture. Final failure by fracture, however, cannot be related to any single criterion or simple
test. The following paragraphs describe approaches to material evaluation for various forms of failure by
fracture.
References cited in this section
1. Cambridge Engineering Selector, Granta Design Ltd., Cambridge, UK, 1998
15. G.E. Dieter, Mechanical Metallurgy, 2nd ed., McGraw Hill, 1976, p 49–50, 79–80, 379, 381, 385
16. J.H. Faupel and F.E. Fisher, Engineering Design, John Wiley & Sons, 1981, p 102, 113, 230–235, 802
19. R.W. Hertzberg, Deformation and Fracture Mechanics of Engineering Materials, 2nd ed., John Wiley
& Sons, 1983, p 240, 287, 288, 436–477
20. W.C. Young, Formulas for Stress and Strain, 5th ed., McGraw-Hill, 1975
21. S.P. Timoshenko and J. Goodier, Theory of Elasticity, 3rd ed., McGraw Hill, 1970, p 418–419
22. O.C. Zienkiewicz, The Finite Element Method in Engineering Science, 4th ed., McGraw Hill, 1987
23. K.H. Heubner, et al., The Finite Element Method for Engineers, 3rd ed., John Wiley & Sons, 1995
24. ABAQUS/Standard, Example Problems Manual, Vol 1, Version 5.7, 1997
Overview of Mechanical Properties and Testing for Design
Howard A. Kuhn, Concurrent Technologies Corporation
Fracture
The design approaches given in preceding sections of this article were based on prevention of failure by
yielding or excessive elastic deflection. While the yield strength for ductile materials is below their tensile
strength, it is well known that failure by fracture can occur even when the applied global stresses are less than
the yield strength. Fractures initiate at localized inhomogenieties, or defects, in the material, such as inclusions,
microcracks, and voids. Previously it was shown that geometric inhomogenieties in a part lead to
concentrations of stress (Fig. 18 and Eq 28). Material defects, generally having a sharp geometry (a much
greater than b) lead to very high localized stresses.
Considering such defects in design against fracture requires looking beyond stress and elastic deformation to
the combination of stress and strain, or energy per unit volume. Defects are commonplace in the
microstructures of real materials and are generated both by materials processing and by service loads and
environments. Under certain conditions, these defects can grow, unsteadily, leading to rapid and catastrophic
fracture. This condition was first described by Griffith (Ref 25), who noted that a defect would grow when the
elastic energy released by the growth of the defect exceeded the energy required to form the crack surfaces. The
excess energy in the system, then, continuously feeds the fracture phenomenon, leading to unstable
propagation. The driving energy from defect growth is a function of the applied stresses (loading, part, and
defect size geometry), and the energy for crack surface formation is a function of the material microstructure.
Details of the development can be found in Ref 19 and 27 and the Section “Impact Toughness Testing and
Fracture Mechanics” in this Volume.
Design Approach. For design and materials selection to avoid fast fracture, the net result of these considerations
is the basic design equation for stable crack growth (Ref 19):
K = Yσ < K
c
(Eq 36)
where K is the stress intensity factor, Y is a factor depending on the geometry of the crack relative to the
geometry of the part, σ is the applied stress, a is the defect size or crack length, and K
c
is a critical value of
stress intensity. K must be less than K
c
for stable crack growth.
The stress intensity K represents the effect of the stress field ahead of the crack tip and is related to the energy
released as the crack grows. For example, Fig. 30 shows the results of finite element analysis of the stresses in
the vicinity of a crack growing from a hole. The high level and distribution of stresses ahead of the crack tip all
contribute to the stress intensity factor. When the stress intensity exceeds a critical value, K
c
, the energy
released exceeds the ability of the material to absorb that energy in forming new fracture surfaces, and crack
growth becomes unstable. This critical value of the stress intensity is known as the fracture toughness of the
material.
Fig. 30 Finite element calculation of stresses in the vicinity of a crack at the edge of a hole in a strip
under axial tension
Equation 36 can be viewed in the same way as Eq 2 for tensile loading and Eq 12 and 13 for bending and
torsion. The stress intensity factor, K, in Eq 36 is equivalent to stress, σ in Eq 2, 12, or 13. While the stress is
defined for each case by the applied load and geometry of the part, stress intensity is defined by the applied
stress (load and part geometry) and the geometry of the crack relative to the geometry of the part, which is
expressed by the factor Y. The important difference is that more information is given in the stress intensity
factor since it involves the defect or crack size, which becomes an additional design parameter. Values of Y can
be found in Ref 19 and 26, among others, for some common part geometries and crack configurations.
Alternatively, finite element analysis can be used to determine K. The fracture toughness of the material, K
c
, on
the right side of Eq 36 is equivalent from a design perspective to the material strength, σ
f
, in Eq 2, 12, and 13.
In applying Eq 36, if the material is specified and the stress is known from the loading requirements, then the
maximum flaw size that can be tolerated is a
max
= K
c
2
/σ
2
πf
2
(or a
max
= Y
2
K
c
2
/σ
2
π). This gives a clear objective
for nondestructive inspection of flaws in the product. Alternatively, if the material is specified and a maximum
flaw size is specified that can be easily seen by visual inspection, then the maximum stress that can be applied
is σ
max
= YK
c
/ . On the other hand, if the stress and maximum flaw size are known, Eq 36 defines the value
of K
c
required to prevent fracture and is used for material selection from tables of fracture toughness.
One application of the fracture criterion in Eq 36 is the design of pressure vessels, using a leak-before-break
philosophy. If the pressure vessel contains a flaw that grows to extend through the pressure vessel wall without
causing unstable fracture, then the internal pressurized fluid will leak out. On the other hand, if the flaw size in
the pressure vessel is above the critical flaw size yet less than the wall thickness of the vessel, fracture will
occur catastrophically. In Fig. 31, a flaw is shown having grown through the pressure vessel wall (Ref 19). If
the critical flaw size is taken as the thickness of the pressure vessel wall, then Eq 36 gives σ
max
= YK
c
/ ,
where t is the thickness of the wall. Equations 29, 30a, and 30b can be used to define the applied stress in the
pressure vessel wall and its relation to the internal pressure. Then, for a given material and its fracture
toughness, K
c
, the maximum stress and internal pressure is determined. Conversely, for a given pressure (and
stress in the wall), the required value of fracture toughness is given by K
c
= σ /Y.
Fig. 31 Flaw in a pressure vessel wall. Source: Ref 19
Mechanical Testing. The crack opening mode described in this example is known as mode I, or crack opening
perpendicular to a tensile stress (Fig. 32), which is the most common mode of fracture. Mode I cracking occurs,
for example, in the tensile loading of the tie bar shown in Fig. 1, in the stress concentration around the eye in
the end connector (Fig. 16) and in bending (Fig. 7 and 9). In this case, the critical stress intensity of the
material, or fracture toughness, is designated K
Ic
. However, two other crack opening modes are possible, as
shown in Fig. 32. Mode II occurs in linear shear, as depicted in Fig. 14 and 15, while mode III occurs in
torsional shear (Fig. 6 and 8). The critical stress intensity for these modes are denoted by K
IIc
and K
IIIc
. The
mode of potential fracture prescribes the test and approach used for measurement of the respective fracture
toughness values.
Fig. 32 Three crack opening modes
The material property to be determined for design against fracture is the fracture toughness, K
c
, to be used in Eq
36. The critical stress intensity, K
Ic
, or fracture toughness in mode I, for example, can be measured by a
compact tension test as well as other standardized test specimens and procedures, as described in the Section
“Impact Toughness Testing and Fracture Mechanics” in this Volume. In addition, fracture toughness values can
be correlated with Charpy test measurements of toughness for certain steel alloys (Ref 27).
References cited in this section
19. R.W. Hertzberg, Deformation and Fracture Mechanics of Engineering Materials, 2nd ed., John Wiley
& Sons, 1983, p 240, 287, 288, 436–477
25. A.A. Griffith, Trans. ASM, Vol 61, 1968, p 871
26. A.F. Liu, Structural Life Assessment Methods, ASM International, 1998
27. J.M. Barsom, Engineering Fracture Mechanics, Vol 7, 1975, p 605
Overview of Mechanical Properties and Testing for Design
Howard A. Kuhn, Concurrent Technologies Corporation
Fatigue
In the previous discussion, the various loads and the resulting stress distributions are defined for static
conditions. In most design applications, however, parts and components are subjected to cyclic loads. In this
case, the peak amplitude of a load cycle (σ
max
in Fig. 33) is the maximum value of applied stress, which can be
analyzed by the equations for static stress distributions (for example, from Eq 1, 12, 13, 21, and 27a 27b).
However, materials under cyclic stress also undergo progressive damage, which lowers their resistance to
fracture (even at stresses below the yield strength).
Fig. 33 Cyclic stress that may lead to fatigue failure
The occurrence of fatigue (paraphrasing from Ref 28) can be generally defined as the progressive, localized,
and permanent structural change that occurs in a material subjected to repeated or fluctuating strains at nominal
stresses that have maximum values less than (and often much less than) the static yield strength of the material.
Fatigue damage is caused by the simultaneous action of cyclic stress, tensile stress, and plastic strain. If any one
of these three is not present, a fatigue crack will not initiate and propagate. The plastic strain resulting from
cyclic stress initiates the crack; the tensile stress promotes crack growth (propagation). Compressive stresses
(typically) will not cause fatigue, although compressive loads may result in local tensile stresses.
During fatigue failure in a metal free of cracklike flaws, microcracks form, coalesce, or grow to macrocracks
that propagate until the fracture toughness of the material is exceeded and final fracture occurs. Under usual
loading conditions, fatigue cracks initiate near or at singularities that lie on or just below the surface, such as
scratches, sharp changes in cross section, pits, inclusions, or embrittled grain boundaries (Ref 32).
The three major approaches of fatigue analysis and testing in current use are the stress-based (S-N curve)
approach, the strain-based approach, and the fracture mechanics approach. Both the stress-based and strain-
based approaches are based on cyclic loading of test coupons at a progressively larger number of cycles until
the test piece fractures. In stress-based fatigue testing, steels and some other alloys may exhibit a fatigue
endurance limit, which is the lower stress limit of the S-N curve for which fatigue fracture is not observed at
testing above ~10
7
cycles (Fig. 34). The observation of a fatigue endurance limit does not occur for all alloys
(e.g., aluminum alloy 7075 in Fig. 34), and the endurance limit can be reduced or eliminated by a number of
environmental and material factors that introduce sites for initiation of fatigue cracks. For example, Fig. 35
shows the effect of different surface conditions on the fatigue endurance limit of steels, which in this case is
approximately one-half of the tensile strength. Under these conditions, when the designs of components
subjected to cyclic loading are expected to perform under ~10
7
cycles, design equations such as Eq 2 and 13
would be applicable where the fatigue limit, σ
e
, of the material represents the failure stress, σ
f
. For alloys
without a fatigue endurance limit (such as aluminum alloy 7075 in Fig. 34), design stresses must be specified in
terms of the specific number of cycles expected in the lifetime of the part.
Fig. 34 Fatigue curves for ferrous and nonferrous alloys
Fig. 35 Correlation between fatigue endurance limit and tensile strength for specimens tested under
various environments
Strain-based fatigue is similar to stress-based fatigue, except that cycles to failure are measured and plotted
versus strain instead of applied stress. This type of testing and analysis is extremely useful in determining
conditions for initiation fatigue. Strain-based fatigue is used in many design cases when a major portion of total
life is exhausted in the crack initiation phase of fatigue. Fundamental design methods for this type of fatigue
analysis are described in more detail in Ref 29. Design aspects for variable amplitude and multiaxial conditions
are also described in Ref 30 and 31. Testing methods for stress-based and strain-based fatigue are described in
more detail in the article “Fatigue, Creep Fatigue, and Thermomechanical Fatigue Life Testing” in this Volume.
Although design and analysis methods based on fatigue crack initiation are important, most parts have material
flaws or geometric features that serve as sites for crack initiation. Therefore, fatigue crack growth is an integral
part of fatigue life prediction analysis. This method is based on the concepts of fracture mechanics, where
fatigue crack growth rates are measured under conditions of a cyclic stress intensity (ΔK) at subcritical levels
(K < K
c
). Fatigue failures start at points of stress concentration and can be considered as flaws in the material.
As these flaws grow during the fatigue process, they can reach the critical size and lead to catastrophic failure
by rapid fracture. For this purpose, fatigue crack growth testing and analysis are used to determine the number
of cycles to reach the critical flaw size for a given material (with a fracture toughness, K
c
). These tests are
described in more detail in the article “Fatigue Crack Growth Testing” in this Volume.
References cited in this section
28. M.E. Fine and Y W. Chung, Fatigue Failure in Metals, Fatigue and Fracture, Vol 19, ASM Handbook,
ASM International, 1996, p 63
29. M.R. Mitchell, Fundamentals of Modern Fatigue Analysis for Design, Fatigue and Fracture, Vol 19,
ASM Handbook, ASM International, 1996, p 227–249
30. N.E. Dowling, Estimating Fatigue Life, Fatigue and Fracture, Vol 19, ASM Handbook, ASM
International, 1996, p 250–262
31. D.L. McDowell, Multiaxial Fatigue Strength, Fatigue and Fracture, Vol 19, ASM Handbook, ASM
International, 1996, p 263–273
32. D. Woodford, Design for High-Temperature Applications, Materials Selection and Design, Vol 20,
ASM Handbook, ASM International, 1998, p 580
Overview of Mechanical Properties and Testing for Design
Howard A. Kuhn, Concurrent Technologies Corporation
Creep
Many design applications involve materials and components that are subjected for extended periods of time to
high-temperature environments. For example, the tie bar shown in Fig. 1 could be part of a hanger supporting
steel parts in a furnace for heat treatment. Other examples include turbine blades in jet engines and pressure
vessels in high-temperature refinery operations. In these cases, failure of the material occurs by complex
diffusion-controlled phenomena leading to cavitation, creep elongation, and eventual rupture of the material.
Testing of materials in its simplest forms involves subjecting a tensile specimen to constant load or constant
stress within a high-temperature environment and measuring the elongation with time. A typical curve of creep
elongation versus time is shown in Fig. 36. After initial rapid growth in creep strain, the rate of creep strain
reaches a steady state, followed again by rapid growth to rupture. Increasing stress on temperature increases the
rate of creep strain and decreases the time to creep rupture. Figure 37(a) shows the influence of temperature and
stress on the time to rupture. Figure 37(b) shows the temperature dependence of yield strength, tensile strength,
and stress for creep rupture at 1,000 h and 100,000 h. Typically, the stresses for creep rupture are less than the
yield strength of the material, even for relatively short rupture times.
Fig. 36 Typical result for creep strain as a function of time
Fig. 37(a)
Fig. 37(b)
Typical data used for designs where materials are exposed to high temperatures for extended periods. (a)
Creep stress versus time to rupture for Astroloy. (b) Temperature dependence of yield strength, tensile
strength, and creep rupture strength at two different times for a nickel-based superalloy
In design applications to avoid creep rupture, the stresses on the material can be calculated as in the case of
static loads such as Eq 2, 12, and 13. The failure stress, σ
f
, used in these equations, however, would be the
rupture strength of the material determined from curves such as Fig. 37(a) at the operating temperature of the
components in the design application. Depending on the expected life of the part, then, the operating
temperature will determine the maximum stress that can be applied. Alternatively, for a given operating stress
and expected lifetime, the maximum operating temperature can be determined from data such as Fig. 37(a) (Ref
32).
In design applications where creep occurs, elongation of the material often becomes the limiting failure
parameter rather than creep rupture strength. A major example is the elongation of turbine blades during turbine
engine operation. If the blades elongate too much, they contact the internal parts of the engine leading to
catastrophic failure. In this case, elongation would be described by the creep strain profile in Fig. 36, for
example, rather than the elastic deflection calculated in Eq 4. Thus, for a given operating temperature and load,
the lifetime for successful operation of a component would be obtained from data such as that provided in Fig.
36 for the specified limit on elongation.
Because of the importance of creep failure in many applications, refined test procedures have been developed
for accurate measurement of creep behavior under complex thermal and stress histories, as well as various
corrosive environments as described in the Section “Creep and Stress-Relaxation Testing” in this Volume.
Reference cited in this section
32. D. Woodford, Design for High-Temperature Applications, Materials Selection and Design, Vol 20,
ASM Handbook, ASM International, 1998, p 580
Overview of Mechanical Properties and Testing for Design
Howard A. Kuhn, Concurrent Technologies Corporation
Environmental Effects on Mechanical Properties
The mechanical properties of metals can be adversely affected when the metal is exposed to a corrosive
environment while being simultaneously stressed. Even in only mildly corrosive environments, the
consequences can be unexpected and serious. These mechanisms that cause adverse affects are collectively
known as environmentally assisted cracking and include some of the more common mechanisms by which
metals actually fail in service. The most important of the phenomena are stress corrosion, hydrogen
embrittlement, and corrosion fatigue.
Stress-corrosion cracking (SCC) of metals occurs in certain environments when cracks initiate and propagate
under conditions where neither the stress nor the environment acting alone would have caused cracking. The
propagation of SCC may eventually lead to structural failure or at least to ineffective performance of a
component (due to problems such as leaks and distortion). Stress-corrosion cracks initiate only at a surface—
and only at a surface that is exposed to the damaging environment. Once initiated, they propagate laterally into
the section thickness, by either transgranular cracking (across grains, Fig. 38) or intergranular cracking (along
grain boundaries, Fig. 39 ). Most of the surface of a stress-cracked metal is essentially unattacked. Stress
cracking may occur at relatively low stress levels compared with stress needed for failure (tensile strength) and
at relatively low concentrations of chemicals (such as Cl
-
for austenitic stainless steels).
Fig. 38 Transgranular stress-corrosion cracking (SCC) in annealed 310 stainless steel after prolonged
exposure in a chloride-containing environment. Electrolytic: 10% chromic acid etch. 150×
Fig. 39 Branched intergranular SCC in a lightly drawn tube of 12200 copper after exposure to an amine
boiler-treatment compound. Potassium dichromate etch. (a) 100×. (b) 500×
Although the mechanism of stress corrosion is not completely understood, SCC appears to develop only when
the stress (applied or residual) is tensile in nature and when its magnitude exceeds a threshold value (Fig. 40), a
value that is near the yield strength of the metal. The rate of crack propagation thereafter increases rapidly with
increasing stress. Once initiated, stress-corrosion cracks extend laterally and grow into the underlying section in
a plane that is normal to the principal tensile stress. They tend to branch extensively in the process (Fig. 38 and
39 ), but there are occasional exceptions to this. Only a limited number of separate cracks are likely to initiate
and then tend to be confined to a limited area of a component. This is in contrast to the more widespread and
random nature of intercrystalline corrosion.
Fig. 40 Stress corrosion cracking threshold examples. (a) Stainless steels in boiling 42% magnesium
chloride solution. (b) Comparison of K
ISCC
of AISI 4340 steel (tensile yield strength, 1515 MPa, or 220
ksi) in methanol and salt water at room temperature
The environments that induce SCC are specific to particular metals, and only a limited range of environments
can cause cracking in any one metal. Some examples of cracking environments are listed in Table 7, most of
them being at worst only mildly corrosive in a general sense. The presence of oxygen is important in most of
them. Many of these environments are also likely to be encountered in everyday usage, and some are virtually
impossible to avoid. Moisture containing chlorides that will cause cracking of aluminum alloys is a case in
point, because moisture and traces of chlorides are ubiquitous. Traces of ammonia that can cause cracking of
brasses are also frequently present in the atmosphere due to the decomposition of organic matter and the
presence of animal waste products (Ref 33).
Table 7 Alloy/environment systems exhibiting stress-corrosion cracking
Alloy
Environment
Carbon steel
Hot nitrate, hydroxide, anhydrous ammonia, and carbonate/bicarbonate solutions
High-strength steels
Aqueous electrolytes, particularly when containing H
2
S
Austenitic stainless
Hot, concentrated chloride solutions; caustics, saline solution, and chloride-
steels
contaminated steam
High-nickel alloys
High-purity steam, hot caustics
Aluminum alloys
Aqueous Cl
-
, Br
-
, and I
-
solutions, including contaminated water vapor
Titanium alloys
Aqueous Cl
-
, Br
-
, and I
-
solutions; methanol organic liquids; N
2
O
4
; hydrochloric
acid
Magnesium alloys
Aqueous Cl
-
solutions
Zirconium alloys
Aqueous Cl
-
solutions; organic liquids; I
2
at 350 °C (660 °F)
Copper alloys
Ammonia and amines for high-zinc brasses; ammoniacal solutions for α brass;
range of solutions for other specific alloys
Gold alloys
(a)
Chlorides, particularly ferric chloride; ammonium hydroxide; nitric acid
(a) Alloys containing less than 67% gold
Prevention of SCC. Stress cracking may be reduced or prevented by the following practices:
• Decreasing the stress level by annealing, design, and so forth
• Avoiding the environment that leads to stress cracking
• Changing the metal if the environment cannot be changed
• Adding inhibitors or applying cathodic protection to reduce the rate of corrosion
In principal, the easiest way to prevent SCC is to specify the load and geometry for a given measured or
assumed initial flaw size such that K < K
ISCC
(where K
ISCC
is the critical stress intensity for stress-corrosion
cracking). For some alloys, however, the value of K
ISCC
may be so low that impossible initial flaw sizes or
impractically low stresses must be specified. Alternatively, attention may be focused on the use of coatings,
alternate materials, or other means of corrosion protection. It is also important to understand the nature of crack
growth and avoid the conditions leading to fast fracture; that is, the stress intensity factor due to flaws
developed by corrosion must be kept below K
c
, the fracture toughness of the material, by limiting the stress or
time of exposure so that cracks do not grow to the critical size.
Measuring and testing of SCC behavior is a complex subject, but one approach is to subject a material
specimen containing a prescribed defect to stress in the chemical environment (Fig. 41) (Ref 19). The increase
in K (usually resulting from increase in crack length a) is then measured as a function of time. As a increases,
the applied stress, σ, may change, and the factor Y in Eq 37 may also change. Their combined effects contribute
to the increase in K. Figure 42 shows a typical result (Ref 19). For each initial stress intensity value, K
i
, the
stress intensity increases until it reaches K
I
, and fast fracture occurs. Below a certain value of K
i
, crack growth
does not occur; this level of K
i
is denoted K
ISCC
, or the critical stress intensity for stress corrosion cracking in
the environment under which the test was conducted. For example, in saltwater, K
ISCC
for heat treated 2000 and
7000 series aluminum alloys are approximately 80% of their K
I
values. For heat treated 4340 and 300M steels,
K
ISCC
is about one-third of the K
I
values, and for titanium alloys, K
ISCC
varies widely from 25 to 40% of their K
I
values (Ref 19).
Fig. 41 Modified compact tension specimen for environmentally assisted cracking measurement.
Fig. 42 Stress intensity growth with time in a corrosive environment
Hydrogen Embrittlement and Cracking. Hydrogen embrittlement is another form of environmentally assisted
crack growth. Only a comparatively few metals are susceptible to this phenomenon, but prominent among them
are the high-strength steels, that is, steels having tensile strengths above about 1000 MPa (145 ksi). In some
aspects, hydrogen embrittlement is similar to stress-corrosion cracking. Hydrogen-induced cracking (HIC) has
been proposed as the SCC mechanism for carbon and high-strength ferritic steels, nickel-base alloys, titanium
alloys, and aluminum alloys (Ref 34).
Cracking resistance of steels is a major concern in refining and petrochemical industries where aqueous H
2
S is
present. The generally accepted theory of the mechanism for hydrogen damage in wet H
2
S environments is that
monatomic hydrogen is charged into steel as a result of sulfide corrosion reactions that take place on the
material surface. The primary source of atomic hydrogen available at internal surfaces of pipeline and vessel
steels is generally the oxygen-accelerated dissociation of the H
2
S gas molecule in the presence of water. The
basic reaction is:
The FeS formed on the surface of the steel is readily permeated by atomic hydrogen, which diffuses further into
the steel.
This diffusion of atomic hydrogen into steel is associated with three distinct forms of cracking:
• Hydrogen-induced cracking
• Stress-oriented hydrogen-induced cracking
• Hydrogen stress cracking (also known as sulfide stress cracking and sulfide stress-corrosion cracking)
Hydrogen-induced cracking (HIC) and stress oriented hydrogen-induced cracking (SOHIC) are both caused by
the formation of hydrogen gas (H
2
) blisters in steel. Hydrogen-induced cracking, also called stepwise cracking
or blister cracking, is primarily found in lower-strength steels, typically with tensile strengths less than about
550 MPa (80 ksi). It is primarily found in line pipe steels.
In contrast, hydrogen stress cracking does not involve blister formation, but it does involve cracking from the
simultaneous presence of high stress and hydrogen embrittlement of the steel. Hydrogen stress cracking occurs
in higher-strength steels or at localized hard spots associated with welds or steel treatment. As a general rule of
thumb, hydrogen stress cracking can be expected to occur in process streams containing in excess of 50 ppm
H
2
S (although cracking has been found to occur at lower concentrations).
The basic factors of these cracking modes include temperature, pH, pressure, chemical species and their
concentration, steel composition and condition, and welding or the condition of the weld heat-affect zone.
These types of cracking and important variables for failure control are described in more detail in Ref 35 and
36.
Corrosion Fatigue. As previously noted and shown in Fig. 35, fatigue is affected seriously in the presence of a
corrosive environment. Another consequence is that even those alloys that have definite fatigue endurance
limits no longer do so. The presence of a particular environment is not required for the deterioration in
properties, as it is for SCC. The sole requirement is that the environment be sufficiently corrosive, although
there is not necessarily a direct correlation between general corrosiveness and effect on corrosion fatigue.
For steels, the corrosion endurance limit ranges from about 50 to 10% of the limit in air. The corrosion
endurance limit also is independent of metallurgical structure and thus shows little correlation with strength.
Therefore, the endurance limit of steels, even under mildly corrosive conditions, is much less than that in air
and does not increase with an increase in the tensile strength of the steel (Ref 33). The combination of corrosion
with a cycling stress eliminates the benefits of all efforts made to improve the strength of steels as assessed by
static mechanical tests.
References cited in this section
19. R.W. Hertzberg, Deformation and Fracture Mechanics of Engineering Materials, 2nd ed., John Wiley
& Sons, 1983, p 240, 287, 288, 436–477
33. L. Samuels, Metals Engineering: A Technical Guide, ASM International, 1988, p 161, 168
34. G. Koch, Stress-Corrosion Cracking and Hydrogen Embrittlement, Fatigue and Fracture, Vol 19, ASM
Handbook, 1996, p 486
35. P. Timmins, Failure Control in Process Operations, Fatigue and Fracture, Vol 19, ASM Handbook,
1996, p 479
36. P. Timmins, Solutions to Hydrogen Attack in Steels, ASM International, 1997
Overview of Mechanical Properties and Testing for Design
Howard A. Kuhn, Concurrent Technologies Corporation
Shock Loading
Another nonstatic loading condition often found in machine parts involves shock, or impact forces. This
condition occurs if the time duration of the load is less than the natural period of vibration of the part or
structure. Failure of a part under shock loading, as with other types of loading, depends on material parameters
and geometric factors.
To illustrate this condition, consider the tie bar (Fig. 1) under impact tensile loading. If the bar is used to stop
the motion of another part, then the kinetic energy of the moving part is absorbed by elongation of the tie bar
and converted into elastic strain energy in the bar. Then, the maximum stress in the bar will be:
σ = V
(Eq 37)
where V is the velocity of the mass, m, when it impacts the bar; A and L are the cross-sectional area and length
of the bar, respectively; and E is the elastic modulus of the bar material.
To prevent failure under a shock load, the stress in Eq 37 must be less than the strength of the material, σ
f
.
Then, the parameters in Eq 37 can be regrouped into:
V < (σ
f
/ )( )
(Eq 38)
which shows that the combination of impact velocity and mass that can be tolerated depends not only on the
material strength but also on its elastic modulus. In other words, selecting a material that maximizes the
parameter /E will maximize the impact energy that can be absorbed. Equation 38 also shows that increasing
the volume of material in the bar, AL, increases its shock resistance. For example, increasing the length of the
bar does not affect its ability to carry static axial load but does increase its ability to resist an impact load.
The description of shock resistance of a tie bar can be extended to other forms of loading, such as bending. For
example, for a beam subjected to a lateral impact load (Fig. 6), the kinetic energy of a mass that is stopped by
the beam is converted into strain energy in the beam. Then, the maximum stress that is in the beam is given by:
σ = V H
(Eq 39)
where V is the velocity of mass m when it impacts the beam; L and H are the beam length and height,
respectively; I is the moment of inertia of the beam cross section; and E is the elastic modulus of the beam
material. Again, σ must be less than the strength of the material, σ
f
, and Eq 39 can be rearranged to:
V < (σ
f
/ )( )
(Eq 40)
As with the bar under axial impact loading, the material parameter that maximizes shock resistance is /E, but
the geometry parameter is now LI/H
2
. In the case of rectangular beam, from Eq 18, I = bH
3
/12. Then, the
geometry parameter becomes LbH/12. Since bH is the cross-sectional area of the beam, the geometry parameter
becomes AL/12, so the impact resistance of the beam is increased by increasing the beam volume, similar to the
case of the bar under tensile impact. A longer beam, for example, will not carry as much static load as a shorter
beam, but the longer beam will be more resistant to failure by impact loading.
More complicated geometries can be analyzed through finite element models, which give the distribution of
stresses due to impact loads throughout the part. In these cases the same general effects of the material
parameter ( /E) and geometry parameter (volume) on shock resistance apply.
Overview of Mechanical Properties and Testing for Design
Howard A. Kuhn, Concurrent Technologies Corporation
Acknowledgments
Portions of the section “Environmental Effects on Mechanical Properties” were adapted from L.E. Samuels,
Metals Engineering: A Technical Guide, ASM International, 1988.
Overview of Mechanical Properties and Testing for Design
Howard A. Kuhn, Concurrent Technologies Corporation
References
1. Cambridge Engineering Selector, Granta Design Ltd., Cambridge, UK, 1998
2. G.E. Dieter, Engineering Design: A Materials and Processing Approach, McGraw Hill, 1991, p 1–51, p
231–271
3. Metals Handbook, American Society for Metals, 1948
4. F.B. Seely, Resistance of Materials, John Wiley & Sons, 1947
5. Properties and Selection of Metals, Vol 1, Metals Handbook, 8th ed., American Society for Metals,
1961, p 503
6. Modern Plastics Encyclopedia, McGraw Hill, 2000
7. M.F. Ashby, Materials Selection for Mechanical Design, 2nd ed., Butterworth-Heinemann, 1999
8. H. Davis, G. Troxell, and G. Hauck, The Testing of Engineering Materials, 4th ed., McGraw Hill, 1982,
p 314
9. G. Carter, Principles of Physical and Chemical Metallurgy, American Society for Metals, 1979, p 87
10. M.A. Meyers and K.K. Chawla, Mechanical Metallurgy, Prentice-Hall, Edgewood Cliffs, NJ, 1984, p
626–627
11. W.J. Taylor, The Hardness Test as a Means of Estimating the Tensile Strength of Metals, J.R. Aeronaut.
Soc., Vol 46 (No. 380), 1942, p 198–202
12. George Vander Voort, Metallography: Principles and Practices, ASM International, 1999, p 383–385
and 391–393
13. R.T. Shield, On the Plastic Flow of Metals under Conditions of Axial Symmetry, Proc. R. Soc., Vol
A233, 1955, p 267
14. H. Chandler, Ed., Hardness Testing, 2nd ed., ASM International, 1999
15. G.E. Dieter, Mechanical Metallurgy, 2nd ed., McGraw Hill, 1976, p 49–50, 79–80, 379, 381, 385
16. J.H. Faupel and F.E. Fisher, Engineering Design, John Wiley & Sons, 1981, p 102, 113, 230–235, 802
17. D.J. Wulpi, Understanding How Components Fail, ASM International, 1966, p 27
18. T. Baumeistes, Ed., Marks' Mechanical Engineers' Handbook, 6th ed., McGraw-Hill, 1958, p 5–106
19. R.W. Hertzberg, Deformation and Fracture Mechanics of Engineering Materials, 2nd ed., John Wiley
& Sons, 1983, p 240, 287, 288, 436–477
20. W.C. Young, Formulas for Stress and Strain, 5th ed., McGraw-Hill, 1975
21. S.P. Timoshenko and J. Goodier, Theory of Elasticity, 3rd ed., McGraw Hill, 1970, p 418–419
22. O.C. Zienkiewicz, The Finite Element Method in Engineering Science, 4th ed., McGraw Hill, 1987
23. K.H. Heubner, et al., The Finite Element Method for Engineers, 3rd ed., John Wiley & Sons, 1995
24. ABAQUS/Standard, Example Problems Manual, Vol 1, Version 5.7, 1997
25. A.A. Griffith, Trans. ASM, Vol 61, 1968, p 871
26. A.F. Liu, Structural Life Assessment Methods, ASM International, 1998
27. J.M. Barsom, Engineering Fracture Mechanics, Vol 7, 1975, p 605
28. M.E. Fine and Y W. Chung, Fatigue Failure in Metals, Fatigue and Fracture, Vol 19, ASM Handbook,
ASM International, 1996, p 63
29. M.R. Mitchell, Fundamentals of Modern Fatigue Analysis for Design, Fatigue and Fracture, Vol 19,
ASM Handbook, ASM International, 1996, p 227–249
30. N.E. Dowling, Estimating Fatigue Life, Fatigue and Fracture, Vol 19, ASM Handbook, ASM
International, 1996, p 250–262
31. D.L. McDowell, Multiaxial Fatigue Strength, Fatigue and Fracture, Vol 19, ASM Handbook, ASM
International, 1996, p 263–273
32. D. Woodford, Design for High-Temperature Applications, Materials Selection and Design, Vol 20,
ASM Handbook, ASM International, 1998, p 580
33. L. Samuels, Metals Engineering: A Technical Guide, ASM International, 1988, p 161, 168
34. G. Koch, Stress-Corrosion Cracking and Hydrogen Embrittlement, Fatigue and Fracture, Vol 19, ASM
Handbook, 1996, p 486
35. P. Timmins, Failure Control in Process Operations, Fatigue and Fracture, Vol 19, ASM Handbook,
1996, p 479
36. P. Timmins, Solutions to Hydrogen Attack in Steels, ASM International, 1997
Overview of Mechanical Properties and Testing for Design
Howard A. Kuhn, Concurrent Technologies Corporation
Selected References
• M. Ashby, Materials Selection for Mechanical Design, 2nd ed., Butterworth-Heineman, 1999
• N. Dowling, Mechanical Behavior of Materials: Engineering Methods for Deformation, Fracture, and
Fatigue, Prentice Hall, 1999
• R.C. Juvinall and K.M. Marshek, Fundamentals of Machine Component Design, 2nd ed., John Wiley &
Sons, 1991
• J.E. Shigley and L.D. Mitchell, Mechanical Engineering Design, 4th ed., McGraw-Hill, 1983
Mechanical Testing for Metalworking Processes
Serope Kalpakjian, Illinois Institute of Technology
Introduction
AN IMPORTANT ACTIVITY in metalworking facilities is the testing of incoming raw materials for
characteristics that ensure the integrity and quality of the products made. Several traditional as well as
specialized tests are now available to assess the quality of materials, in bulk or sheet form, in order to predict
their behavior in metalworking operations.
Because of the generally complex nature of the processes involved, the identification and quantification of
appropriate parameters to predict performance and failure during processing continue to be challenging tasks.
The metalworking industry has, by and large, depended on cumulative and long practical experience rather than
on the continuous reporting of research findings in the technical literature. A notable exception is the
automotive industry, particularly in sheet metal forming.
While such practical experience has been indispensable to the successful production of quality products, major
efforts and investigations continue to be made to arrive at a comprehensive understanding of the underlying
principles of the behavior of metals in deformation processing. The necessity for such an approach is self-
evident, even though it is clear that there are, as yet, no simple criteria fully responsive to all metals and alloys,
operations, and processing conditions.
This article generally reviews the state of knowledge in this subject. A more detailed discussion of various
aspects related to specific topics and processes are given in ASM Handbook, Volume 14, Forming and Forging,
and the other references cited in this article.
Mechanical Testing for Metalworking Processes
Serope Kalpakjian, Illinois Institute of Technology
Workability and Formability
A simple definition of workability is “the maximum amount of deformation a metal can withstand in a
particular process without failure” (Ref 1). The term is generally applied to bulk deformation processes, such as
forging, rolling, extrusion, and drawing, in which the forces applied are predominantly compressive in nature.
In contrast, formability is usually applied to sheet-metal forming processes, in which the forces applied are
primarily tensile. These definitions can also include undesirable conditions such as poor surface finish, sheet
wrinkling, or lack of die fill in forging.
Although some definitions include the relative ease with which a metal can be shaped, the general definition of
workability does not include forces or energies involved in processing. The reason is that forces and energies
are related primarily to the strength of the workpiece material, tribological factors (friction, lubrication, and
wear), and the size and capacity of the metalworking equipment.
The maximum amount of deformation has a different meaning depending on the particular metalworking
process. For example, in bending, it is the minimum bend radius; in deep drawing, it is the maximum ratio of
blank-to-punch diameters. In power spinning of tubular or curvilinear shapes, maximum deformation is the
reduction in thickness per pass.
It is generally recognized that there are two basic types of failure in metalworking processes:
• Local or total separation of the metal: Surface cracking in upsetting or open-die forging, internal
cracking in extrusion or drawing, and necking and subsequent tearing of sheet metals during forming
• Buckling: Upsetting of slender workpieces and wrinkling in sheet-metal forming operations
As a general guide to workability, some suppliers of metals have prepared tables or charts showing the relative
workability or formability ratings (using letters, numbers, or terms such as excellent, good, fair, and poor).
While such ratings are based on cumulative and proven experience on the plant floor and can indeed be useful,
their application is somewhat limited due to the fact that ratings generally do not apply to specific processes and
conditions and are not quantitative.
The behavior of a metal in an actual forming operation may be predicted from mechanical test results. Test
specimens are cut from the same blank and, as much as possible, subjected to the same conditions (such as state
of stress, temperature, and strain rate) as in the particular metalworking operation. Few metalworking processes
can be simulated by such simple testing, however. Consequently, much effort has been expended toward the
design of new test methods to simulate actual processing conditions. The alternative is, of course, to perform
the actual process itself at a smaller scale, in a laboratory environment.
Reference cited in this section
1. G.E. Dieter, Ed., Workability Testing Techniques, ASM International, 1984, p 16, 33, 49, 61, 63, 163,
202, 206
Mechanical Testing for Metalworking Processes
Serope Kalpakjian, Illinois Institute of Technology
Mechanical Behavior of Metals Influencing Workability
This section presents a brief review of the common material parameters that can have a direct or indirect
influence on workability and product quality. The parameters described in this section are most commonly
obtained in tension tests (Ref 2, 3, 4). All discussions pertain to metals and their alloys.
Strength. The strength of a metal is defined in terms of quantities such as yield stress, ultimate tensile strength,
and breaking stress. Although easily determined from normal stress-normal strain curves (including shear
stress-shear strain curves) or obtained from published literature and handbooks, these quantities basically
influence the stresses, forces, energies, and temperature rise during processing.
Although strength is not directly relevant to workability, it can indirectly indicate some measure of workability.
For ductile metals, for example, observing the difference between the yield and tensile strengths can indirectly
indicate a measure of workability. The closer the magnitude of these two stresses, the more work hardened the
metal is, and, hence, the lower its ductility, that is, the narrower the stress-strain curve. The dependence of
strength on orientation in a bulk workpiece or sheet metal can, of course, also influence material behavior (as
discussed in subsequent sections). A common example is the formation of ears in deep-drawn cups due to the
planar anisotropy of the sheet.
Ductility. Two traditional and common measures of ductility have been the tensile elongation and the tensile
reduction of area, quantities that are readily available in handbooks and from material suppliers. However, these
quantities depend on gage length and cross-sectional area of the specimen. Total elongation and tensile
reduction of area both increase with increasing cross-sectional area of the specimen. Also, because necking is a
local phenomenon, total percent elongation depends on gage length; as expected, percent elongation decreases
with increasing gage length.
Relationships between specimen length and cross section have been established and standardized in different
countries. In the United States and according to ASTM standards, for example, the gage length-to-diameter
ratio is 4.0 for round and 4.5 for sheet specimens.
Hardness can be defined as resistance to permanent indentation. The influence of hardness may be summarized
as follows:
• It can be related to the strength of the metal and, thus, indirectly, to its ductility (i.e., the higher the
hardness, the stronger the metal is and, generally, the lower its ductility is).
• The type of indentation profile is a measure of strain hardening, (i.e., the sharper the profile and its
raised ridge around the indentation, the more strain hardened the metal is). Hardness is, thus, an indirect
measure of the capacity of the metal for plastic deformation in metalworking.
• It affects the frictional and wear characteristics in forming operations.
The strain-hardening exponent, also called the work-hardening exponent, is a measure of how rapidly the metal
becomes stronger and harder as it is strained (worked). This exponent is typically obtained from the true stress-
true strain curve of the metal (often derived from engineering stress-engineering strain curves) and is expressed
as a power law:
σ = Kε
n
(Eq 1)
where σ is the true stress, K is the strength coefficient, ε is the true strain, and n is the strain-hardening
exponent.
At room temperature, for magnitude of K typically ranges from about 200 MPa for soft aluminum to about
2000 MPa for superalloys; it decreases as the temperature increases. Depending on the metal and its condition,
the values of n typically range from 0.05 to 0.5 (Table 1).
Table 1 Typical values for strength coefficient, K, and strain-hardening exponent, n, (Eq 1) at room
temperature
K Material
MPa
ksi
n
Aluminum
1100-O
180 26
0.20
2024-T4 690 100
0.16
5052-O 210 30
0.13
6061-O 205 30
0.20
6061-T6 410 59
0.05
7075-O 400 58
0.17
Brass
60-39-1 Pb, annealed
800 116
0.33
70-30, annealed 895 130
0.49
85-15, cold rolled 580 84
0.34
Bronze (phosphor), annealed 720 104
0.46
Cobalt-base alloy, heat treated
2070
300
0.50
Copper, annealed 315 46
0.54
Molybdenum, annealed 725 105
0.13
Steel
Low-carbon annealed
530 77
0.26
1045, hot rolled 965 140
0.14
1112, annealed 760 110
0.19
1112, cold rolled 760 110
0.08
4135, annealed 1015
147
0.17
4135, cold rolled 1100
160
0.14
4340, annealed 640 93
0.15