Fourier Transform Properties
Bạn đang xem bản rút gọn của tài liệu. Xem và tải ngay bản đầy đủ của tài liệu tại đây (672.98 KB, 24 trang )
185
CHAPTER
10
Fourier Transform Properties
The time and frequency domains are alternative ways of representing signals. The Fourier
transform is the mathematical relationship between these two representations. If a signal is
modified in one domain, it will also be changed in the other domain, although usually not in the
same way. For example, it was shown in the last chapter that convolving time domain signals
results in their frequency spectra being multiplied. Other mathematical operations, such as
addition, scaling and shifting, also have a matching operation in the opposite domain. These
relationships are called properties of the Fourier Transform, how a mathematical change in one
domain results in a mathematical change in the other domain.
Linearity of the Fourier Transform
The Fourier Transform is linear, that is, it possesses the properties of
homogeneity and additivity. This is true for all four members of the Fourier
transform family (Fourier transform, Fourier Series, DFT, and DTFT).
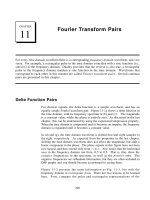
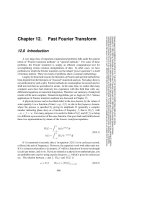
Figure 10-1 provides an example of how homogeneity is a property of the
Fourier transform. Figure (a) shows an arbitrary time domain signal, with the
corresponding frequency spectrum shown in (b). We will call these two
signals: and , respectively. Homogeneity means that a change inx[ ] X[ ]
amplitude in one domain produces an identical change in amplitude in the other
domain. This should make intuitive sense: when the amplitude of a time
domain waveform is changed, the amplitude of the sine and cosine waves
making up that waveform must also change by an equal amount.
In mathematical form, if and are a Fourier Transform pair, then x[ ] X[ ] kx[ ]
and are also a Fourier Transform pair, for any constant k. If thekX[ ]
frequency domain is represented in rectangular notation, means that bothkX[ ]
the real part and the imaginary part are multiplied by k. If the frequency
domain is represented in polar notation, means that the magnitude iskX[ ]
multiplied by k, while the phase remains unchanged.
The Scientist and Engineer's Guide to Digital Signal Processing186
Sample number
0 64 128 192 256
-3
-2
-1
0
1
2
3
255
c. k x[ ]
Sample number
0 64 128 192 256
-3
-2
-1
0
1
2
3
255
a. x[ ]
Frequency
0 0.1 0.2 0.3 0.4 0.5
0
10
20
30
40
50
b. X[ ]
Frequency
0 0.1 0.2 0.3 0.4 0.5
0
10
20
30
40
50
d. k X[ ]
Amplitude Amplitude
AmplitudeAmplitude
Frequency DomainTime Domain
FIGURE 10-1
Homogeneity of the Fourier transform. If the amplitude is changed in one domain, it is changed by
the same amount in the other domain. In other words, scaling in one domain corresponds to scaling
in the other domain.
F.T.
F.T.
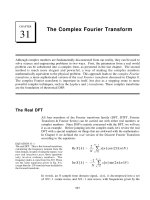
Additivity of the Fourier transform means that addition in one domain
corresponds to addition in the other domain. An example of this is shown
in Fig. 10-2. In this illustration, (a) and (b) are signals in the time domain
called and , respectively. Adding these signals produces a thirdx
1
[ ] x
2
[ ]
time domain signal called , shown in (c). Each of these three signalsx
3
[ ]
has a frequency spectrum consisting of a real and an imaginary part, shown
in (d) through (i). Since the two time domain signals add to produce the
third time domain signal, the two corresponding spectra add to produce the
third spectrum. Frequency spectra are added in rectangular notation by
adding the real parts to the real parts and the imaginary parts to the
imaginary parts. If: , then: x
1
[n] % x
2
[n] ' x
3
[n] ReX
1
[f ] % ReX
2
[f ] ' ReX
3
[f ]
and . Think of this in terms of cosine and sineImX
1
[f ] % ImX
2
[f ] ' ImX
3
[f ]
waves. All the cosine waves add (the real parts) and all the sine waves add
(the imaginary parts) with no interaction between the two.
Frequency spectra in polar form cannot be directly added; they must be
converted into rectangular notation, added, and then reconverted back to
Chapter 10- Fourier Transform Properties 187
Sample number
0 64 128 192 256
-3
-2
-1
0
1
2
3
255
b. x
2
[ ]
Sample number
0 64 128 192 256
-4
-2
0
2
4
255
a. x
1
[ ]
Frequency
0 0.1 0.2 0.3 0.4 0.5
-200
-100
0
100
200
e. Re X
2
[ ]
Frequency
0 0.1 0.2 0.3 0.4 0.5
-200
-100
0
100
200
h. Im X
2
[ ]
Frequency
0 0.1 0.2 0.3 0.4 0.5
-200
-100
0
100
200
f. Re X
3
[ ]
Frequency
0 0.1 0.2 0.3 0.4 0.5
-200
-100
0
100
200
i. Im X
3
[ ]
Sample number
0 64 128 192 256
-4
-2
0
2
4
255
c. x
3
[ ]
Frequency
0 0.1 0.2 0.3 0.4 0.5
-200
-100
0
100
200
d. Re X
1
[ ]
Frequency
0 0.1 0.2 0.3 0.4 0.5
-200
-100
0
100
200
g. Im X
1
[ ]
Amplitude
Amplitude
Amplitude
Amplitude
Amplitude
Amplitude
Amplitude
Amplitude
Amplitude
FIGURE 10-2
Additivity of the Fourier transform. Adding two or more signals in one domain results in the
corresponding signals being added in the other domain. In this illustration, the time domain signals
in (a) and (b) are added to produce the signal in (c). This results in the corresponding real and
imaginary parts of the frequency spectra being added.
Frequency DomainTime Domain
F.T.
F.T.
F.T.
+ ++
= ==
polar form. This can also be understood in terms of how sinusoids behave.
Imagine adding two sinusoids having the same frequency, but with different
amplitudes ( and ) and phases ( and ). If the two phases happen toA
1
A
2
N
1
N
2
be same ( ), the amplitudes will add ( ) when the sinusoids areN
1
' N
2
A
1
%A
2
added. However, if the two phases happen to be exactly opposite ( ),N
1
' &N
2
the amplitudes will subtract ( ) when the sinusoids are added. The pointA
1
&A
2
is, when sinusoids (or spectra) are in polar form, they cannot be added by
simply adding the magnitudes and phases.
The Scientist and Engineer's Guide to Digital Signal Processing188
In spite of being linear, the Fourier transform is not shift invariant. In other
words, a shift in the time domain does not correspond to a shift in the
frequency domain. This is the topic of the next section.
Characteristics of the Phase
In mathematical form: if & , then a shift in thex[n] : Mag X[f ] Phase X[f ]
time domain results in: & , (where x[n%s] : Mag X[f ] Phase X[f ] % 2Bsf f
is expressed as a fraction of the sampling rate, running between 0 and 0.5). In
words, a shift of s samples in the time domain leaves the magnitude unchanged,
but adds a linear term to the phase, . Let's look at an example of how2Bsf
this works.
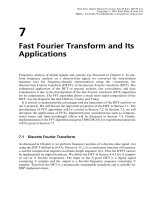
Figure 10-3 shows how the phase is affected when the time domain waveform
is shifted to the left or right. The magnitude has not been included in this
illustration because it isn't interesting; it is not changed by the time domain
shift. In Figs. (a) through (d), the waveform is gradually shifted from having
the peak centered on sample 128, to having it centered on sample 0. This
sequence of graphs takes into account that the DFT views the time domain as
circular; when portions of the waveform exit to the right, they reappear on the
left.
The time domain waveform in Fig. 10-3 is symmetrical around a vertical
axis, that is, the left and right sides are mirror images of each other. As
mentioned in Chapter 7, signals with this type of symmetry are called linear
phase, because the phase of their frequency spectrum is a straight line.
Likewise, signals that don't have this left-right symmetry are called
nonlinear phase, and have phases that are something other than a straight
line. Figures (e) through (h) show the phase of the signals in (a) through
(d). As described in Chapter 7, these phase signals are unwrapped,
allowing them to appear without the discontinuities associated with keeping
the value between B and -B.
When the time domain waveform is shifted to the right, the phase remains a
straight line, but experiences a decrease in slope. When the time domain is
shifted to the left, there is an increase in the slope. This is the main property
you need to remember from this section; a shift in the time domain corresponds
to changing the slope of the phase.
Figures (b) and (f) display a unique case where the phase is entirely zero. This
occurs when the time domain signal is symmetrical around sample zero. At first
glance, this symmetry may not be obvious in (b); it may appear that the signal
is symmetrical around sample 256 (i.e., N/2) instead. Remember that the DFT
views the time domain as circular, with sample zero inherently connected to
sample N-1. Any signal that is symmetrical around sample zero will also be
symmetrical around sample N/2, and vice versa. When using members of the
Fourier Transform family that do not view the time domain as periodic (such
as the DTFT), the symmetry must be around sample zero to produces a zero
phase.
Chapter 10- Fourier Transform Properties 189
Sample number
0 64 128 192 256 320 384 448 512
-1
0
1
2
511
a.
Sample number
0 64 128 192 256 320 384 448 512
-1
0
1
2
511
b.
Sample number
0 64 128 192 256 320 384 448 512
-1
0
1
2
511
c.
Frequency
0 0.1 0.2 0.3 0.4 0.5
-900
-600
-300
0
300
600
900
g.
Frequency
0 0.1 0.2 0.3 0.4 0.5
-900
-600
-300
0
300
600
900
h.
2
3
1
Sample number
0 64 128 192 256 320 384 448 512
-1
0
1
2
511
d.
Frequency
0 0.1 0.2 0.3 0.4 0.5
-900
-600
-300
0
300
600
900
e.
Frequency
0 0.1 0.2 0.3 0.4 0.5
-900
-600
-300
0
300
600
900
f.
Phase (radians)Phase (radians) Phase (radians)
FIGURE 10-3
Phase changes resulting from a time domain shift.
Time Domain Frequency Domain
AmplitudeAmplitudeAmplitude Amplitude
Phase (radians)
The Scientist and Engineer's Guide to Digital Signal Processing190
Sample number
0 8 16 24 32
-2
-1
0
1
2
a. A low frequency
1 sample shift
= 1/32 cycle
Sample number
0 8 16 24 32
-2
-1
0
1
2
b. 1/2 of sampling frequency
1 sample shift
= 1/2 cycle
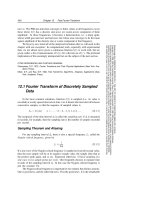
FIGURE 10-4
The relationship between samples and phase. Figures (a) and (b) show low and high frequency sinusoids,
respectively. In (a), a one sample shift is equal to 1/32 of a cycle. In (b), a one sample shift is equal to 1/2 of a
cycle. This is why a shift in the waveform changes the phase more at high frequencies than at low frequencies.
Amplitude
Amplitude
Figures (d) and (h) shows something of a riddle. First imagine that (d) was
formed by shifting the waveform in (c) slightly more to the right. This means
that the phase in (h) would have a slightly more negative slope than in (g).
This phase is shown as line 1. Next, imagine that (d) was formed by starting
with (a) and shifting it to the left. In this case, the phase should have a
slightly more positive slope than (e), as is illustrated by line 2. Lastly, notice
that (d) is symmetrical around sample N/2, and should therefore have a zero
phase, as illustrated by line 3. Which of these three phases is correct? They
all are, depending on how the B and 2B phase ambiguities (discussed in Chapter
8) are arranged. For instance, every sample in line 2 differs from the
corresponding sample in line 1 by an integer multiple of 2B, making them
equal. To relate line 3 to lines 1 and 2, the B ambiguities must also be taken
into account.
To understand why the phase behaves as it does, imagine shifting a waveform
by one sample to the right. This means that all of the sinusoids that compose
the waveform must also be shifted by one sample to the right. Figure 10-4
shows two sinusoids that might be a part of the waveform. In (a), the sine
wave has a very low frequency, and a one sample shift is only a small fraction
of a full cycle. In (b), the sinusoid has a frequency of one-half of the sampling
rate, the highest frequency that can exist in sampled data. A one sample shift
at this frequency is equal to an entire 1/2 cycle, or B radians. That is, when a
shift is expressed in terms of a phase change, it becomes proportional to the
frequency of the sinusoid being shifted.
For example, consider a waveform that is symmetrical around sample zero,
and therefore has a zero phase. Figure 10-5a shows how the phase of this
signal changes when it is shifted left or right. At the highest frequency,
one-half of the sampling rate, the phase increases by B for each one sample
shift to the left, and decreases by B for each one sample shift to the right.
At zero frequency there is no phase shift, and all of the frequencies between
follow in a straight line.
Chapter 10- Fourier Transform Properties 191
Frequency
0 0.1 0.2 0.3 0.4 0.5
-50
0
50
100
150
-14
-7
0
15B
10B
5B
0
-5B
b.
number of samples
shifted in time domain
FIGURE 10-5
Phases resulting from time domain shifting. For each sample that a time domain signal is shifted in the positive
direction (i.e., to the right), the phase at frequency 0.5 will decrease by B radians. For each sample shifted in the
negative direction (i.e., to the left), the phase at frequency 0.5 will increase by B radians. Figure (a) shows this for
a linear phase (a straight line), while (b) is an example using a nonlinear phase.
Frequency
0 0.1 0.2 0.3 0.4 0.5
-30
-20
-10
0
10
20
30
-3
-2
-1
1
2
3
number of samples
shifted in time domain
3B
2B
B
0
-B
-2B
-3B
a.
0
Phase (radians)
Phase (radians)
All of the examples we have used so far are linear phase. Figure 10-5b shows
that nonlinear phase signals react to shifting in the same way. In this example
the nonlinear phase is a straight line with two rectangular pulses. When the
time domain is shifted, these nonlinear features are simply superimposed on the
changing slope.
What happens in the real and imaginary parts when the time domain
waveform is shifted? Recall that frequency domain signals in rectangular
notation are nearly impossible for humans to understand. The real and
imaginary parts typically look like random oscillations with no apparent
pattern. When the time domain signal is shifted, the wiggly patterns of the
real and imaginary parts become even more oscillatory and difficult to
interpret. Don't waste your time trying to understand these signals, or how
they are changed by time domain shifting.
Figure 10-6 is an interesting demonstration of what information is contained in
the phase, and what information is contained in the magnitude. The waveform
in (a) has two very distinct features: a rising edge at sample number 55, and
a falling edge at sample number 110. Edges are very important when
information is encoded in the shape of a waveform. An edge indicates when
something happens, dividing whatever is on the left from whatever is on the
right. It is time domain encoded information in its purest form. To begin the
demonstration, the DFT is taken of the signal in (a), and the frequency
spectrum converted into polar notation. To find the signal in (b), the phase is
replaced with random numbers between -B and B, and the inverse DFT used to
reconstruct the time domain waveform. In other words, (b) is based only on the
information contained in the magnitude. In a similar manner, (c) is found by
replacing the magnitude with small random numbers before using the inverse
DFT. This makes the reconstruction of (c) based solely on the information
contained in the phase.
The Scientist and Engineer's Guide to Digital Signal Processing192
Sample number
0 64 128 192 256
-2
-1
0
1
2
3
255
a. Original signal
Sample number
0 64 128 192 256
-2
-1
0
1
2
3
255
b. Reconstructed from the magnitude
Sample number
0 64 128 192 256
-2
-1
0
1
2
3
255
c. Reconstructed from the phase
Amplitude Amplitude
Amplitude
FIGURE 10-6
Information contained in the phase. Figure (a)
shows a pulse-like waveform. The signal in (b)
is created by taking the DFT of (a), replacing the
phase with random numbers, and taking the
Inverse DFT. The signal in (c) is found by
taking the DFT of (a), replacing the magnitude
with random numbers, and taking the Inverse
DFT. The location of the edges is retained in
(c), but not in (b). This shows that the phase
contains information on the location of events in
the time domain signal.
The result? The locations of the edges are clearly present in (c), but totally
absent in (b). This is because an edge is formed when many sinusoids rise at
the same location, possible only when their phases are coordinated. In short,
much of the information about the shape of the time domain waveform is
contained in the phase, rather than the magnitude. This can be contrasted with
signals that have their information encoded in the frequency domain, such as
audio signals. The magnitude is most important for these signals, with the
phase playing only a minor role. In later chapters we will see that this type
of understanding provides strategies for designing filters and other methods of
processing signals. Understanding how information is represented in signals
is always the first step in successful DSP.
Why does left-right symmetry correspond to a zero (or linear) phase? Figure
10-7 provides the answer. Such a signal can be decomposed into a left half
and a right half, as shown in (a), (b) and (c). The sample at the center of
symmetry (zero in this case) is divided equally between the left and right
halves, allowing the two sides to be perfect mirror images of each other. The
magnitudes of these two halves will be identical, as shown in (e) and (f), while
the phases will be opposite in sign, as in (h) and (i). Two important concepts
fall out of this. First, every signal that is symmetrical between the left and
right will have a linear phase because the nonlinear phase of the left half
exactly cancels the nonlinear phase of the right half.
Chapter 10- Fourier Transform Properties 193
Sample number
-64 -32 0 32 64
-1
0
1
2
b. x
1
[ ]
63
Sample number
-64 -32 0 32 64
-1
0
1
2
a. x[ ]
63
Frequency
0 0.1 0.2 0.3 0.4 0.5
0
5
10
15
20
e. Mag X
1
[ ]
Frequency
0 0.1 0.2 0.3 0.4 0.5
-4
-3
-2
-1
0
1
2
3
4
h. Phase X
1
[ ]
Frequency
0 0.1 0.2 0.3 0.4 0.5
0
5
10
15
20
f. Mag X
2
[ ]
Frequency
0 0.1 0.2 0.3 0.4 0.5
-4
-3
-2
-1
0
1
2
3
4
i. Phase X
2
[ ]
Frequency
0 0.1 0.2 0.3 0.4 0.5
0
5
10
15
20
d. Mag X[ ]
Frequency
0 0.1 0.2 0.3 0.4 0.5
-4
-3
-2
-1
0
1
2
3
4
g. Phase X[ ]
Sample number
-64 -32 0 32 64
-1
0
1
2
c. x
2
[ ]
63
Frequency DomainTime Domain
Decompose
Amplitude
Amplitude
Amplitude
Amplitude
Amplitude
Amplitude
Amplitude
Amplitude
Amplitude
FIGURE 10-7
Phase characteristics of left-right symmetry. A signal with left-right symmetry, shown in (a), can be
decomposed into a right half, (b), and a left half, (c). The magnitudes of the two halves are identical, (e) and
(f), while the phases are the negative of each other, (h) and (i).
Second, imagine flipping (b) such that it becomes (c). This left-right flip in the
time domain does nothing to the magnitude, but changes the sign of every point
in the phase. Likewise, changing the sign of the phase flips the time domain
signal left-for-right. If the signals are continuous, the flip is around zero. If
the signals are discrete, the flip is around sample zero and sample N/2,
simultaneously.
Changing the sign of the phase is a common enough operation that it is given
its own name and symbol. The name is complex conjugation, and it is