Volume 18 - Friction, Lubrication, and Wear Technology Part 9 doc
Bạn đang xem bản rút gọn của tài liệu. Xem và tải ngay bản đầy đủ của tài liệu tại đây (2.12 MB, 80 trang )
Stylus Load and Surface Deformation. The logical parameters that determine whether surface damage will be
caused by stylus load are the surface hardness, the stylus force, the stylus tip width, and, to a lesser extent, the stylus
speed. A stylus tip width of 1 m (40 in.) should not produce detectable damage on metal surfaces as soft as gold as
long as the stylus force is smaller than about 0.03 mN.
Many types of stylus instruments use stylus forces of 0.5 mN and higher, but these are normally used with stylus tip sizes
on the order of 10 m (400 in.). Because the pressure is inversely proportional to the area of contact, the pressure on the
surface caused by stylus loading is smaller for a 10 m (400 in.) stylus with a 0.5 mN force than it is for a 1 m (40
in.) stylus with a 0.03 mN force. Even if the stylus leaves a visible track, the resulting profile is likely to be accurate,
because the variation in the depth of the track over the surface should be significantly smaller than the depth itself.
However, if a skid is used for stylus profiling, the measured surface can be seriously damaged by the skid, whose loading
is hundreds of times larger than the stylus loading.
The above discussion pertains only to plastic or irreversible deformation of the surface by stylus loading. Characterizing
the elastic or reversible deformation (Ref 6) is much more difficult, but the elastic deformation is expected to be very
small (Ref 42).
In a study of plastic damage, Song and Vorburger (Ref 39) measured a 2160 lines/mm gold grating with a 0.5 m (20
in.) stylus tip width. When the stylus loading increased from 0.6 to 100 N, the grating profile in the same position was
attenuated (Fig. 14a-d). When the stylus loading was reduced again to 0.6 N (Fig. 14e), most of the periodic structure of
the profile in Fig. 14(a) had been plastically eliminated by the previous loading conditions and did not reappear. However,
a few of the fine peaks did reappear, and the difference between the profiles in Fig. 14(d) and 14(e) suggests that some
features were only elastically deformed by the increased stylus loading.
Fig. 14
Effect of stylus loading on the surface of a gold grating with 2160 lines/mm. Nominal stylus radius of
0.5 m (20 in.). Stylus loading: (a) 0.6 N. (b) 25 N. (c) 50 N. (d) 100 m. (e) 0.6 N. (f) 0.6
N,
different position
Other Distortions. Stylus flight (Ref 43, 44, 45) and profile digitization are two other sources of profile distortion.
Stylus flight can occur when the stylus encounters a sharp change in the surface topography, such as a steeply rising
surface step. The logical parameters that affect this phenomenon are the stylus speed, the stylus force on the surface, the
stylus tip size, the damping constant in the vertical direction, and the rate of change of the surface slope. A key tradeoff
occurs between stylus force and speed. A magnetic phonograph cartridge with a force of 20 mN can have a record disk
traverse beneath it at a tangential speed of 500 mm/s (20 in./s) without losing contact, but a stylus with a force of 0.5 mN
must travel much more slowly, about 1 mm/s (0.04 in./s), to maintain contact. The usual symptom of stylus flight is a
peak in the measured profile with a sharp rise and slower tail occurring after the stylus encounters a sharp peak on the
surface. The accuracy of such features can be verified by remeasuring the same profile at a slower speed.
Stylus profiles are routinely digitized for the purposes of computer processing and mass storage. In order to obtain an
accurate digital representation of the profile, the peak-to-valley height of the profile should consist of many vertical
quantization levels, and the widths of the surface features to be studied should consist of many lateral sampling intervals.
In addition, if a distribution of surface peaks and valleys is being characterized, there should be enough points in the
profile to give an adequate statistical sampling of the variability of these structures. A system at NIST used 4096 vertical
quantization levels and 4000 digitized points. These values seem to provide adequate resolution for many applications.
Finally, a ubiquitous source of confusion is simply the difference between the horizontal and vertical magnification of
surface profile records. The ratio of vertical to horizontal magnification can be 100:1 or higher in some applications. This
effect is not a source of error, but leads to misperceptions of the true appearance of surface texture because the resulting
profile records have highly sloped and sharply peaked structures. Figure 15, taken from Reason (Ref 33), shows a
comparison between a profile measured with a 1:1 ratio and one with a 25:1 ratio. The qualitative impressions derived
from the two pictures are quite different. In reality, surfaces are much less jagged than they appear from conventional
profile records.
Fig. 15
Stylus profiles obtained with two different aspect ratios. (a) Undistorted 1:1 representation. (b) Plot in
which the horizontal scale has been compressed by a factor of 25 with respect to the vertical scale. Source:
Ref
33
Examples of Roughness Measurement Results. Of all the surface profiling concepts discussed in this article thus
far, the most widely used output parameter is a roughness average, R
a
, and perhaps the most important instrument
parameter is the long-wavelength cutoff. A few measurement results for R
a
from typical metal finishing processes will
now be discussed, with the instrument cutoffs noted as well.
The surfaces of metal components can be finished by any of a number of different processes. Typical ranges for the
roughness average achieved by a large number of processes are given in Ref 4. The ranges of measurements made by the
authors for a few of these processes are shown in Table 1, along with the long-wavelength cutoffs used. These results
represent the highest and lowest values that were obtained on roughness comparison surface replicas for each type of
finishing process. Nearly all the replicas are commercially available.
Table 1 Extremes of arithmetic average surface roughness, R
a
, as a function of selected metal
working
finishing processes
Measured values of surface roughness
(a)
Minimum Maximum
R
a
Cutoff R
a
Cutoff
Finishing process
m in.
mm
in.
m
in.
mm
in.
Ground
0.024
0.96
0.8 0.03
3.0 120 0.8 0.03
End milled
1.4 56 0.8 0.03
11 440 No cutoff
Side milled
1.2 48 2.5 0.10
14 560 No cutoff
Shaped or turned
0.6 24 0.8 0.03
18 720 2.5 0.10
Electrical discharge machined (EDM)
0.4 16 0.8 0.03
7.5 300 0.8 0.03
Cast
0.9 36 0.8 0.03
72 2900
16 640
(a)
For various finishing processes as measured and recorded by J.F. Song and T.V. Vorburger between
1976 and 1991. These values do
not necessarily represent the entire range of values obtainable by these
processes.
The cutoffs were chosen either to be several times longer than the typical spacing produced by the surface finishing
process or to be 0.8 mm (0.03 in.) as a minimum. In general, the spacing of the machining marks increases with
roughness; therefore, for the same finishing process, rougher surfaces require longer instrument cutoffs.
Ceramic materials are being increasingly used in industrial machinery. Although surface finishing processes are more
expensive for ceramics than for metals, the ranges of roughness values achievable for both materials are generally similar.
However, many types of ceramic surfaces are porous, and thus the finished surface is characterized by fairly smooth
plateaus and deep holes. Therefore, values of skewness tend to be negative, and the values of peak-to-valley parameters
tend to be larger relative to R
a
for ceramic surfaces than for metal surfaces.
Instrument Calibration
Tribologists often make comparisons of surface texture to determine the existence, extent, and causes of surface wear.
These comparisons can be confused by differences in surface measurements taken under different conditions. Are these
differences caused by the measuring instruments, the measured surface, or the variation of measuring conditions? How
can surface measurements be made accurate and when can they be compared? These questions involve both instrument
calibration, correct measuring procedures, and the use of various calibration and check specimens.
General Calibration Issues. The measurement conditions that should be defined, calibrated, or checked for a stylus
instrument are (Ref 31, 41, 46):
• Magnification, both in the vertical and horizontal directions
• Stylus tip
• Stylus loading
• Type of skid or reference datum
• Type of filter, reference line, and cutoff length
• Profile digitization
• Algorithms for calculating parameters
• Number and distribution of profiles on the surface
Four types of calibration specimens can be used for this purpose according to ISO standard 5436 (Ref 41): step-height
specimens for calibrating the vertical magnification, specimens with fine grooves for checking stylus condition,
specimens with periodic profiles for checking vertical and horizontal magnification as well as the character of an
electronic filter, and specimens with random profiles for checking the overall response of an instrument (Ref 31, 41).
The vertical magnification of a typical commercial stylus instrument is generally accurate to 10% or better, depending on
the fineness of the application. For accurate dimensional measurement of surface structures, the instrument must be
calibrated. This is often done by measuring the recorded displacement produced by traversing a step whose height has
been calibrated by interferometric measurement. Calibration in the vertical direction becomes difficult at very high
magnifications where the desired resolution may be at the nanometer or subnanometer level, somewhat beyond the
resolution capabilities of conventional interferometric techniques. In that case, interferometric techniques that incorporate
electronic phase measurement (Ref 47) constitute one approach to providing calibrated measurements of small step
heights. The sources of uncertainty in surface height calibration and estimates of their magnitudes are discussed elsewhere
(Ref 31, 46, Ref 48).
In the lateral direction, the relative displacement of the stylus over the surface can be measured directly by a laser
interferometer (Ref 37). Alternatively, calibrated grids or other types of periodic surface specimens (Ref 26) can be used
as secondary displacement standards.
Comparison of Roughness Parameters. In order to make surface measurements results comparable, the
measurement conditions mentioned above should be precisely defined and specified, especially the stylus size and cutoff
length, which limit the bandwidth of the measured profile. The accuracy of surface measurements of manufactured parts
is aided further by a well-established measurement procedure, such as the following (Ref 31):
1.
Calibrate the vertical magnification of the instrument using a step specimen whose calibrated step height
covers the range of surface heights of the engineering surfaces to be measured
2. Verify that the c
alibration was correct by measuring either the calibrated step height again or a
roughness specimen with calibrated R
a
, such as a sinusoidal specimen (Ref 27)
3. Measure the engineering surfaces of interest
4.
Check the measurement by measuring a check specimen with a waveform identical or similar to that of
the measured surface. The R
a
or other roughness parameter value of t
he check specimen should have
been calibrated under the same measuring conditions with the same instrument characteristics as the
measurement in step 3
In addition, the instrumental parameters, such as filter setting, stylus loading, and straightness of the mechanical motion,
should be checked periodically.
Existing roughness calibration specimens can be used as check specimens for a wide range of engineering surface
measurements. For example, when the measured engineering surfaces have highly periodic profiles, such as those
obtained by turning, planning, or side-milling processes, periodic roughness specimens with triangular, cusped-peak, or
sinusoidal profiles can be used as check standards. When the measured engineering surfaces have random profiles, as
obtained by grinding, lapping, polishing, and honing processes, the random roughness specimens originating from the
Physikalisch Technische Bundesanstalt in Germany (Ref 49) or the Chang Cheng Institute of Metrology and
Measurement in China (Ref 40, 50) can be used. These sets combined would cover the range of R
a
values from 1.5 to
0.012 m (59 to 0.5 in.). If the checking measurement shows that the difference between the measured result for the
check specimen and its certified value under reference conditions was within a given tolerance, the measurement of the
engineering surface is considered to be under good quality control (Ref 31).
In tribology experiments, if surfaces measured under identical conditions are being compared, the instrument is needed
only as a comparator and its absolute calibration is of secondary importance. In such case, only a pilot specimen may be
needed for surface measurement quality control. The pilot specimen could be selected from the measured engineering
parts or could be an engineering surface with the same surface texture pattern and a similar roughness parameter value as
the test surfaces, produced by the same manufacturing process. It should also have good surface texture uniformity. The
stylus instrument should be checked for measurement repeatability by measuring the same trace approximately 15 to 20
times. After that, several measurements should be made daily at positions evenly distributed in a small measuring area
designated on the surface of the pilot specimen. The user should then be able to detect a significant change in the
characteristics of the instrument.
Comparison of the surface profiles often yields more useful information in tribology experiments that the simple
comparison of roughness parameters. However, profile comparison requires that the tested surface be relocated in the
exact same place from one measurement run to the next. Discrete, recognizable surface features, either natural or
artificial, could be used for relocation. In Fig. 14, for example, a deep valley on the measured gold grating surface (see
arrows) provided a means of orienting these profile graphs from run to run.
Applications
Metalworking. Measurements of surface roughness for metalworking components likely form the bulk of surface
roughness measurements throughout the world. The automotive industry is one example where the manufactured surfaces
are carefully specified. Table 2, now about 16 years old (Ref 13), shows roughness specifications in terms of the
roughness average, R
a
, for a number of automobile components. It is likely that these specifications were drawn up
empirically and were probably similar to specifications elsewhere in the automotive industry. However, there is no real
collective body of knowledge that describes these types of specifications and the reasons for them. As far as can be told,
the information is scattered throughout the literature or is proprietary.
Table 2 Typical surface roughness specifications of 1976 model year automotive engine components
Car No. 1 Car No. 2 Components Manufacturing
process
m in. m in.
Cylinder block
Cylinder bore
Honing 0.41-0.51
16-20
0.51-0.64 20-25
Tappet bore
Reaming 1.5-1.9 60-75
2.0-3.0 80-120
Main bearing bore
Boring 1.5-2.0 60-80
3.3-3.8 130-150
Head surface
Milling 1.0-1.3 40-50
4.8-5.3 190-210
Piston
Skirt
Grinding-polishing
1.1-1.4 45-55
1.0-1.3
(a)
40-50
(a)
Pin bore
Grinding/polishing
0.76-0.97
30-38
0.28-0.33
(a)
11-13
(a)
Piston pin
Grinding-lapping 0.23-0.30
9-12 0.08-0.13 3-5
Crankshaft
Main bearing journal
Grinding-polishing
0.10-0.15
4-6 0.15-0.23 6-9
Connecting rod journal
Grinding-polishing
0.10-0.15
4-6 0.15-0.23 6-9
Camshaft
Journal
Grinding-polishing
0.10-0.15
4-6 0.36-0.46 14-18
Cam
Grinding-polishing
0.38-0.51
15-20
0.56-0.66
(a)
22-26
(a)
Rocker arm
Shaft
Grinding 0.36-0.51
14-20
0.51-0.56 20-22
Bore
Honing-polishing 0.74-0.81
29-32
0.76-1.0 30-40
Valves
Stem:
Intake
Grinding 0.86-0.97
34-38
0.41-0.56 16-22
Exhaust
Grinding 0.46-0.51
18-20
0.36-0.51 14-20
Seat:
Intake
Grinding 0.64-1.0 25-40
0.76-1.0 30-40
Exhaust
Grinding 0.86-1.1 34-45
0.76-0.89 30-35
Tappet
Face
Grinding 0.10-0.13
4-5 . . .
Outside diameter
Grinding 0.36-0.46
14-18
. . .
Hydraulic lifter
Face
Grinding-polishing
0.56-0.64
22-25
0.38-0.51
(a)
15-20
(a)
Outside diameter
Grinding-polishing
0.36-0.41
14-16
0.33-0.36
(a)
13-14
(a)
Source: Ref 13
(a)
Grinding only; no polishing.
Griffiths (Ref 51) attempted to systematize some of the knowledge on surface function. Table 3, taken from his paper,
lists the correlations between surface physical properties and various causes of component failure. The circles are taken
from previous work of Tonshoff and Brinksmeier (Ref 52) and the squares from Griffiths' additional research. The surface
texture influences failure occurring by plastic deformation, fatigue, and corrosion. Griffiths also listed the influence of
surface parameters on component performance (Table 4). This table discusses not only roughness and waviness, but also
the metallurgy and chemistry of the surfaces and other qualities as well. Roughness is particularly important for sealing,
dimensional accuracy, preserving the cleanliness of the component, optical reflectivity, and several other functions.
Table 3 Effect of surface properties on component failure causes
Surface physical properties
(a)
Cause of failure
Yield
stress
Hardness
Strength
Fatigue
strength
Residual
stress
Texture
Microcracks
Plastic deformation
• •
Scuffing/adhesion
•
Fracture/crack
• [ocir]
Fatigue
• [ocir] [ocir] •
Cavitation
[ocir] [ocir]
Wear
•
[ocir]
Diffusion
Corrosion
[ocir]
•
Source: Ref 51
(a)
From original 1980 survey: •, strong in
fluence; [ocir], traceable influence;
, supposed influence. Later survey: , Traceable influence.
Table 4 Effect of surface parameters on component performance
Surface parameter
(a)
Performance
parameter
Roughness
Waviness
Form
Lay
Laps
and
tears
Chemistry
Metallurgy
Stress
and
hardness
Sealing
•
•
Accuracy
•
•
Cleanliness
•
•
Reflectivity
•
Tool life
•
• • •
Load carrying
•
Creep
•
•
Magnetism
• • •
Electrical resistance
•
Assembly
•
Fluid flow
•
Joints
•
•
(a)
•, strong influence; , supposed influence.
Tribology and Wear. An important research direction in tribology is to determine the relationship between surface
texture and wear properties, and the variation of surface texture during the water process. Many investigators use standard
test geometries for wear and friction tests, such as pin-on-disk or four-ball tests (Ref 53, 54, 55, 56). The amount and
structure of damage to these compounds is of great interest in such tests. Key measurable parameters are the volume of
material removed by wear and the surface area of the water scar.
As discussed by Whitenton and Blau (Ref 55), both two-dimensional analysis of profiles and three-dimensional analysis
of surface topography maps can be used to assess wear damage. In the two-dimensional approach, a profile of the wear
scar is obtained and the area lost or gained in the wear region is estimated. By projection, the volume can be estimated as
well. The profile can be obtained by stylus measurements or by image analysis of the scar.
In the three-dimensional approach, the measurement system generates a matrix of X, Y, and Z values that describe the
topography of the surface after the test. Parameters such as surface area can be determined from this matrix. In addition,
the volume removed by wear can be obtained by comparing the surface map with that for the unworn surface. An
important advantage of this method is its accuracy; it produces the most direct measurement of the wear volume. One
disadvantage is that it is more time consuming than the two-dimensional method.
Figure 16 shows the surface topography that resulted from measuring a bottom ball in a four-ball test (Ref 56) that used
6.35 mm (0.25 in.) radius -alumina balls. These three-dimensional data of the wear scar surface were carefully filtered
to remove extraneous instrumental errors.
Fig. 16 Bottom-ball topographic data for a four-ball test showing a round wear scar. Source: Ref 56
Figure 17 shows the relationship between the wear volume of the top ball scars and the bottom ball scars in the four-ball
test. Five sets of balls were tested at room temperature while immersed in paraffin oil. Because there are three bottom
balls which were simultaneously, three times the wear volume for one ball is plotted along the x-axis. The scar volume of
the top ball is plotted along the y-axis. Under the five different sets of experimental conditions, the total wear volume lost
for the bottom ball scars as calculated from surface profiling appears to be about equal to the wear volume lost for the top
ball scar.
Fig. 17 Relation of the wear volumes of the top-ball wear scars to the bottom-
ball wear scars. Because there
are three bottom balls, three times the wear volume for one ball is plotted along the x-axis. The top-
ball scar
volume is plotted along the y-axis. A 1:1 45° li
ne is also drawn. The numbered data points correspond to the
test numbers. Source: Ref 56
Another application of surface texture measurements in tribology is the examination of used components to gain
information on the wear mechanism (Ref 57). For example, the mechanism of scuffing involves the destruction of
surfaces by the welding and fracture of asperity contacts. Such surfaces are easily distinguished from those produced by
controlled running-in wear. Many engines use specially formulated "first-fill" lubricants designed to assist the running-in
of the surfaces. This running-in is crucial for obtaining satisfactory service life.
Bovington (Ref 57) has observed how a properly run-in surface can be distinguished from a scuffed surface. Generally,
the run-in surface contains a number of flat plateaus, the peak-valley roughness is about half that of the new surface, and
the skewness, R
sk
, is negative. Running-in proceeds in a controlled manner, that is, with the truncation of surface peaks
but without abrasive or adhesive wear processes. The truncations or plateaus result in a reduction of the contacts
pressures, and their presence is a good indication of long service life. Scuffing, on the other hand, generates new surfaces.
Therefore, the peak-valley roughness does not decrease, and the R
sk
parameter does not become progressively more
negative.
Bovington (Ref 57) has also observed that modern engine design and lubrication technology are so advanced that the old
methods of evaluation of wear, such as weight loss, are becoming irrelevant. The lubricant industry needs to begin
defining wear in terms of changes in surface texture.
Davis et al. (Ref 58) measured the three-dimensional topography of various places in a honed engine cylinder bore and
related the topography to component wear. Based on detailed results, they developed a chart showing oil volume in cubic
millimeters versus the amount of the surface that would be truncated by the wearing process. The oil volume is related to
the volume of the surface valleys, calculated from their three-dimensional topographic measurements. Their mathematical
truncation process was a simulation of a wear process that cuts off the surface peaks. For an engine cylinder bore, oil
volume is of crucial importance. Figure 18 shows data taken from the analyses of one of their three-dimensional
topographic maps. As the truncation proceeds, the oil volume in the valleys decreases. Based on their information and
measurement results, Davis et al. (Ref 58) predicted that the component would begin to fail at a truncation level between
60 to 70%, because the oil volume would decrease to unacceptable levels.
Fig. 18 Oil volume for cylinder bores estimated by mathematic
al truncation of a surface topography map.
Source: Ref 58
Magnetic Storage. Tribology is especially important to the functioning of tapes and disks in the magnetic recording
industry (Ref 59), including the hydrodynamic properties of flying read heads, the lubrication of tapes and disk, and the
sliding contact between a disk and a read head upon startup. Surface roughness is also important. Figure 19 shows results
from Bhushan et al. (Ref 59, 60) for the measured coefficient of friction of six CrO
2
magnetic tapes sliding against a glass
head as a function of the rms roughness measured with an optical profiler. The tapes all had the same composition; the
variation in rms roughness was achieved by using different calendering pressures during the finishing process. The
coefficient of friction decreased rapidly up to an rms roughness of about 40 nm,then seemed to remain fairly level.
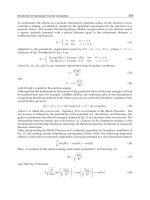
However, when the friction results were plotted versus the real area of contact (normalized to the applied load), an
excellent linear correlation was obtained (Fig. 19b). The quantity plotted along the abscissa is based on Greenwood and
Williamson's formula (Ref 15) for the real area of contact, A
r
, in the elastic regime:
(Eq 10)
where A
a
is the apparent area of contact, p
a
is the apparent pressure,
p
is the standard deviation of the composite peak-
height distribution of the contacting surfaces, R
p
is the composite peak curvature of the contacting surfaces, and E
*
is a
composite modulus that is a function of the Young's modulus and Poisson's ratio of the contacting material. The linear
relationship obtained by Bhushan et al. (Ref 59, 60) was duplicated by Miyoshi et al. (Ref 61) for the same six magnetic
tapes sliding on a nickel-zinc ferrite pin in a pin-on-flat experiment.
Fig. 19 Coefficient of friction for six CrO
2
magnetic tapes as a function of two parameters. (a) Coefficient of
friction versus rms roughness, R
q
. (b) Coefficient of friction versus the real area of contact, A
r
(normalized to
contact load). Source: Ref 59, 60
Lip Seals. Thomas et al. (Ref 62, 63) used pattern recognition techniques to correlate surface texture and lip sealing
performance. They measured surface profiles of a set of rubber lip seals, some good and some leaky, and calculated a
number of surface parameters from the profiles, such as R
a
, R
sk
, and peak curvature. The groups of parameters for the
good and bad seals were then separated by pattern recognition techniques. From these results, they constructed model
profiles for successful and leaky sealing surfaces (Fig. 20). Although this approach is highly empirical, it can lead to a
sound understanding of surface function by enabling the engineer to focus on the most probable parameters affecting
performance.
Fig. 20 Reconstructions
from pattern recognition analysis of profiles of the contacting surface of lip seals. (a)
Ideally good seal. (b) Ideally bad seal. Source: Ref 63
Wherever possible, engineering surfaces should be assessed by evaluating those surface parameters that strongly correlate
with the component function. The type and control values of these functional parameters can be determined by controlled
experiments. This example of lip seals again highlights the importance of surface texture design (Ref 31). The functional
performance of engineering surfaces can be optimized in a comprehensive way by proper design of their surface texture,
specification of the material and manufacturing process, and development of quality control procedures.
References
1.
Elements of this article have been presented in T.V. Vorburger and G.G. Hembree, "Characterization of
Surface Topography," Navy Metrology R&D Program Conference Report, U.S. Department of the Navy
(Corona, CA), April 1989, and in Ref 2
2. T.V. Vorburger and J. Raja, "Surface Finish Metrology Tutorial," NISTIR 89-
4088, National Institute of
Standards and Technology, 1990
3. T.R. Thomas, Ed., Rough Surfaces, Longman, London, 1982, p 189
4. "Surface Texture (Surface Roughness, Waviness, and Lay)," ANSI/ASME B46.1-
1985, American Society
of Mechanical Engineers, 1985
5. "Instruments for the Measurement of Surface Roughness by the Profile Method
Vocabulary," ISO
1879/1981, International Organization for Standardization, 1981
6. D.J. Whitehouse, Characterization of Solid Surfaces,
P.E. Kane and G.R. Larrabee, Ed., Plenum Press,
1975, p 49-73
7.
J.M. Bennett and J.H. Dancy, Stylus Profiling Instrument for Measuring Statistical Properties of Smooth
Optical Surfaces, Appl. Opt., Vol 20, 1981, p 1785
8. B. Scheffer and C. Thurel, Données de base de la Realisation d'un Calculateur R et W, Méc. Matér. Electr.,
Vol 286, 1973, p 19
9. J. Bielle, Functional Needs, Machining Conditions, and Economics of Surface Finishing, Prec. Eng.,
Vol 7,
1985, p 31
10.
D.J. Whitehouse, The Parameter Rash Is There a Cure?, Wear, Vol 83, 1982, p 75
11.
J.M. Bennett and L. Mattsson, Introduction to Surface Roughness and Scattering,
Optical Society of
America, 1989
12.
P.K. Hansma, V.B. Elings, O. Marti, and C.E. Bracker, Scanning T
unneling Microscopy and Atomic Force
Microscopy: Application to Biology and Technology, Science, Vol 242, 1988, p 209
13.
R.D. Young, "The National Measurement System for Surface Finish," NBSIR 75-
927, National Bureau of
Standards, 1976
14.
"Surface Roughness Terminology Part 1: Surface and Its Parameters."
ISO 4287/1, International
Organization for Standardization, 1984
15.
J.A. Greenwood and J.B.P. Williamson, Contact of Nominally Flat Surfaces, Proc. R. Soc. (London) A,
Vol
A295, 1966, p 300
16.
A.W. Bush and R.D. Gibson, A Theoretical Investigation of Thermal Contact Conductance, Appl. Energy,
Vol 5, 1979, p 11
17.
P.R. Nayak, Random Process Model of Rough Surfaces, J. Lubr. Technol. (Trans. ASME),
Vol 93, 1971, p
398
18.
J.S. Bendat and A.G. Piersol, Random Data: Analysis and Measurement Procedures, Wiley-
Interscience,
1971
19.
M.S. Longuet-Higgins, The Statistical Analysis of a Random, Moving Surface, Trans. R. Soc. (London) A,
Vol 249A, 1957, p 321
20.
R.B. Blackman and J.W. Tukey, The Measurement of Power Spectra, Dover, 1959
21.
R.S. Sayles, Rough Surfaces, T.R. Thomas, Ed., Longman, London, 1982, chap 5
22.
J.B.P. Williamson, Rough Surfaces, T.R. Thomas, Ed., Longman, London, 1982, chap 1
23.
J.M. Elson and J.M. Bennett, Relation Between
the Angular Dependence of Scattering and the Statistical
Properties of Optical Surfaces, J. Opt. Soc. Am., Vol 69, 1979, p 31
24.
E.O. Brigham, The Fast Fourier Transform, Prentice-Hall, 1974, chap 10
25.
T.V. Vorburger, "FASTMENU: A Set of FORTRAN Programs for Analyzing Surface Texture," NBSIR 83-
2703, National Bureau of Standards, 1983, chap 11
26.
R.L. McKenzie, Ed., "NIST Standard Reference Materials Catalog 1990-
1991," National Institute of
Standards and Technology, 1990, p 124
27.
E.C. Teague, F.E. Scire, and T.V. Vorburger, Sinusoidal Profile Precision Roughness Specimens, Wear,
Vol 83, 1982, p 61
28.
E.L. Church, T.V. Vorburger, and J.C. Wyant, Direct Comparison of Mechanical and Optical
Measurements of the Finish of Precision Machined Optical Surfaces, Opt. Eng., Vol 24, 1985, p 388
29.
K.J. Stout and E.J. Davis, Surface Topography of Cylinder Bores
Relationship Between Manufacture,
Characterization, and Function, Wear, Vol 95, 1984, p 111
30.
"Measurement of Surface Roughness, Parameter R
k
, R
pk
, R
vk
, M
r1
, M
r2
for the Description of the Material
Portion (Profile Bearing Length Ratio) in the Roughness Profile," DIN 4776-
1985, Deutsches Institut für
Normung, 1985
31.
J.F. Song and T.V. Vorburger, Standard Reference Specimens in Quality Control
of Engineering Surfaces,
J. Res. Natl. Inst. Stand. Technol., Vol 96, 1991, p 271
32.
D.W. Blakely and G.A. Somorjai, The Dehydrogenation and Hydrogenolysis of Cyclohexane and
Cyclohexene on Stepped (High Miller Index) Platinum Surfaces, J. Catal., Vol 42, 1976, p 181
33.
R.E. Reason, Modern Workshop Technology, Vol 2, Processes,
3rd ed., H.W. Baker, Ed., Macmillan, 1970,
chap 23
34.
J.D. Garratt, New Stylus Instrument With a Wide Dynamic Range for Use in Surface Metrology,
Prec.
Eng., Vol 4, 1982, p 145
35.
R.E. Reason, Surface Finish and Its Measurement, J. Inst. Prod. Eng., Vol 23, 1944, p 347
36.
J.B. Bryan, The Abbé Principle Revisited An Updated Interpretation, Prec. Eng., Vol 1, 1979, p 129
37.
E.C. Teague, R.D. Young, F.E. Scire, and D. Gilsinn, Para-Flex Stage for Microtopographic Mapping,
Rev.
Sci. Instrum., Vol 59, 1988, p 67
38.
T.V. Vorburger, E.C. Teague, F.E. Scire, and F.W. Rosberry, Measurements of Stylus Radii, Wear,
Vol 57,
1979, p 39
39.
J.F. Song and T.V. Vorburger, Stylus Profiling at High Resolution and Low Force, Appl. Opt.,
Vol 30,
1991, p 42
40.
J.F. Song, Random Profile Precision Roughness Calibration Specimens, Surf. Topog., Vol 1, 1988, p 303
41.
Calibration Specimens Stylus Instruments Types, Calibration and Use of Specimens, ISO 5436-
1985,
International Organization for Standardization, 1985
42.
T.R. Thomas, Ed., Rough Surfaces, Longman, London, 1982, p 24-25
43.
M.N.H. Damir, Error in Measurement Due to Stylus Kinematics, Wear, Vol 26, 1973, p 219
44.
S. Ajioka, The Dynamic Response of Stylus, Bull. Jpn. Soc. Prec. Eng., Vol 1, 1966, p 228
45.
J.I. McCool, Assessing the Effect of Stylus Tip Radius and Flight on Surface Topography Measurements,
J.
Tribology (Trans. ASME), Vol 202, 1984
46.
E.C. Teague, "Evaluatio
n, Revision, and Application of the NBS Stylus/Computer System for the
Measurement of Surface Roughness," Tech. Note 902, National Bureau of Standards, 1976
47.
J.C. Wyant, C.L. Koliopoulos, B. Bhushan, and O.E. George, An Optical Profilometer for Surface
Characterization of Magnetic Media, ASLE Trans.,
Vol 27, 1984, p 101; and B. Bhushan, J.C. Wyant, and
C.L. Koliopoulos, Measurement of Surface Topography of Magnetic Tapes by Mirau Interferometry,
Appl.
Opt., Vol 24, 1985, p 1489
48.
T.V. Vorburger, "App
endix A: Measurement Conditions and Sources of Uncertainty for NIST Roughness
and Step Height Calibration Reports," unpublished
49.
J. Hasing, Herstellung und Eigenschaften von Referenznormalen für das Einstellen von
Oberflachenmessgeraten, Werkstattstechnik, Vol 55, 1965, p 380
50.
J.F. Song, T.V. Vorburger, and P. Rubert, Comparison Between Precision Roughness Master Specimens
and Their Electroformed Replicas, Prec. Eng., Vol 14, 1992, p 84
51.
B.J. Griffiths, Manufacturing Surface Design and Monitoring for Performance, Surf. Topog.,
Vol 1, 1988, p
61
52.
H.K. Tonshoff and E. Brinksmeier, Determination of the Mechanical and Thermal Influences on Machined
Surfaces by Microhardness and Residual Stress Analysis, CIRP Ann., Vol 29 (No. 2), 1980, p 519
53.
P.A. Willermet and S.K. Kandah, Wear Asymmetry
A Comparison of the Wear Volumes of the Rotating
and Stationary Balls in the Four-Ball Machine, ASLE Trans., Vol 26, 1982, p 173
54.
I.M. Feng, A New Approach in Interpreting the Four-Ball Wear Results, Wear, Vol 5, 1962, p 275
55.
E.P. Whitenton and P.J. Blau, A Comparison of Methods for Determining Wear Volumes and Surface
Parameters of Spherically Tipped Sliders, Wear, Vol 124, 1988, p 291
56.
E.P. Whitenton and D.E. Deckman, Measuring Matching Wear Scars on Balls and Flats, Surf. Topog.,
Vol
2, 1989, p 205
57.
C.H. Bovington, Surface Finish and Engine Testing of Lubricants: An Industrialist View, Surf. Topog.,
Vol
1, 1988, p 483
58.
E.J. Davis, P.J. Sullivan, and K.J. Stout, The Application of 3-D Topography to Engine Bore Surfaces,
Surf.
Topog., Vol 1, 1988, p 63; K.J. Stout, E.J. Davis, and P.J. Sullivan, Atlas of Machined Surfaces,
Chapman
and Hall, London, 1990
59.
B. Bhushan, Tribology and Mechanics of Magnetic Storage Devices, Springer-Verlag, 1990
60.
B. Bhushan, R.L. Bradshaw, and B.S. Sharma, Friction in Magnetic Tapes II: Role of Physical Properties,
ASLE Trans., Vol 27, 1984, p 89
61.
K. Miyoshi, D.H. Buckley, and B. Bhushan, "Friction and Morphology of Magnetic Tapes in Sliding
Contact With Nickel-
Zinc Ferrite," Technical Paper 2267, National Aeronautics and Space Administration,
1984
62.
T.R. Thomas, C.F. Holmes, H.T. McAdams, and J.C. Bernard, Surface Microgeometry of Lip Seals Related
to Their Performance, Paper J2, Proc. 7th Int. Conf. on Fluid Sealing,
BHRA Fluid Engineering, Cranfield
UK, 1975
63.
T.R. Thomas and R.S. Sayles, Rough Surfaces, T.R. Thomas, Ed., Longman, London, 1982, p 231-233
Surface Topography and Image
Analysis (Area)
Eric P. Whitenton, National Institute of Standards and Technology
Introduction
SEVERAL CONCEPTS and methods involved in the topography and image analysis of engineered and worn surfaces are
described in this article, in terms of the past, present, and future of this characterization technique. Although linear
profilometry has long been used in materials research to study both machined and worn surfaces (Ref 1), there is typically
more information about a surface in a scanned area profile (Ref 2). The fact that both computers and machines that can
perform scanned topographical profile measurements over an entire area are becoming more powerful and less costly,
combined with the scanned area profile advantage, represent two of several reasons why the techniques for analyzing
profile information are becoming similar to techniques used for analyzing optical and scanning electron microscope
(SEM) images in materials research.
Image analysis of optical and SEM photomicrographs have been used for many years for various purposes related to
materials science (Ref 3, 4, 5). Both optical and SEM images are essentially two-dimensional x,y arrays of numerical
values. Each value represents the intensity of the image at that x,y location. Generally, area profiling machines also
produce an x,y array, but each value represents a z height at that location. If intensity and z height are allowed to be
interchangeable, where one can be substituted for the other, then the same equipment, techniques, and computer software
can be used to analyze both. This simplifies the data analysis tasks of the researcher by unifying many of the techniques
that must be learned. One machine that applies this approach uses much of the same hardware and software to
interchangeably perform laser scanning tomography, infrared (IR) transmission photomicroscopy, and noncontact optical
profilometry (Ref 6).
Historically, the topographical analysis of machined surfaces has predominantly consisted of compiling statistics of
geometrical properties, such as average slope or the root mean square (rms) of the z heights. The theory behind this is
described in detail in the literature (Ref 1). Techniques like this have been of limited use in the characterization of worn
surfaces, particularly those that are severely worn, but can be efficiently performed in an image analysis environment.
Examples are given in this article.
Image analysis is also becoming increasingly useful to pick out, characterize, manipulate, and classify the features on a
surface individually, as well as in groups. It seems unlikely that purely statistical techniques will ever reach this level of
sophistication. Investigators may soon see surfaces described in terms of the organizational structure of features, instead
of rms. This article discusses a few of the potential pitfalls, capabilities, and opportunities of this evolving tool.
A novel example of how image analysis and profiling are interrelated is in the measurement of pigment agglomeration in
rubber (Ref 7). The standard procedure is to microtome the frozen rubber and examine it under an optical microscope.
Using image analysis techniques, the darker-colored agglomerates are differentiated from the lighter-colored rubber, and
the dispersion is computed. The researchers noticed that a stylus profile tracing of the rubber, sliced with a knife blade at
room temperature, essentially yields a flat plane that has distinct holes and bumps. This is because the soft rubber "cuts"
in a flat plane, whereas the harder agglomerates are not cut and protrude through the cutting plane. The number of peaks
per unit area, a method long used in both image and profile analysis, is used to compute the dispersion. This method was
judged to be very accurate and fast.
Definitions and Conventions. Where possible, cited reference works were selected because they present techniques
in "cookbook" form. It is hoped that this encourages readers to try such techniques on their own systems.
A topographic image refers to an image where each x,y location represents a z height. This image is generally acquired by
a scanning profiling machine. An intensity image refers to an image where each x,y location represents an intensity, and is
normally obtained by SEM or video camera. A binary image is derived from either a topographic or an intensity image.
Each x,y location has a value of either "0" or "1," indicating which locations in the original image have some property,
such as z height above a threshold value or the edge of a feature as determined by local slopes. Some of the techniques
discussed in this article are performed on binary images, which are described more fully in the section "Computing
Differences Between Two Traces or Surfaces" and portrayed in Fig. 5. The word image, by itself, is intended to be very
generic. It can refer to a topographic image, an intensity image, and, in certain circumstances, individual traces. A single
trace is, in fact, the special case of an image with only one row of data. Note that what makes a topographic image
different from an intensity image is simply the meaning of the value at each x and y, and not how it is displayed, or
rendered. If an isometric line drawing of an intensity image is displayed, the image is still an intensity image, even though
it "looks" as though it were a topographic surface. It should be remembered that all images are single-valued functions,
which is to say that for any given x and y value, there is one and only one z value. The ramifications of this are discussed
throughout this article.
Motifswere the first profile analysis technique developed especially for use on computers (Ref 8). Using a set of four
simple and easily understood rules, a complex trace can be reduced to a simpler one. This technique has been used in the
French automotive industry for many years, and numerous practical uses have been found (Ref 8, 9, 10, 11). Currently,
these rules only apply to a two-dimensional trace. If appropriate rules were discovered, this technique could also be
performed on three-dimensional images.
Surfaces are sometimes referred to as either deterministic, nondeterministic, or partially deterministic. A deterministic
surface is a surface in which the z heights can be predicted if position on the surface is known. Sinusoidal (Ref 12) and
step-height calibration blocks are examples. A nondeterministic surface has random z heights, such as a sand-blasted
surface. Some surfaces have both a deterministic and a nondeterministic character. A ground surface often has a distinct,
somewhat predictable, lay pattern with a random fine roughness superimposed on it. Such a surface is often termed
partially deterministic.
Leveling refers to the process of defining z = 0 for an image. For example, a single-profile trace is taken across a flat
specimen. If one side of the specimen were higher than the other side, then the trace could be leveled by subtracting a line
from that trace. For an engineered surface, the line would typically be determined by performing the least-squares fit of a
line to all of the data in the trace. For a worn surface, where part of the trace includes the worn area and part includes the
unworn area, only some of the data in the trace would be used to determine the least squares line. The data in the unworn
area only would be used to determine the least-squares line when the worn volume, or wear scar depth, was to be
determined.
Implementation on Personal Computers and Data Bases. Both software (Ref 13, 14) and books (Ref 15, 16,
17, 18) have become readily available to perform image analysis on personal computers. At least one source (Ref 18) not
only describes many of the techniques, but also includes software. If a profiling or other image-producing machine, such
as a microscope, were under heavy use, then users could take a floppy disk containing the stored images to another work
station and free the measuring equipment for others to use. Some data base programs allow images to be stored along with
other textual and numeric information (Ref 19). It is also possible to have the images themselves as part of the querying
process, where a user "enters" an image and the computer finds similar images (Ref 20). Thus, both the topography, or
topographic image, and visual appearance, or intensity image, of a surface can be an integral part of a data base.
Point Spacing and Image Compression
The issue of how many x,y points to acquire in an image generally involves a compromise. If too few points are used, then
valuable information can be lost. It has been shown, for example, that a surface with an exponential correlation function
appears as a Gaussian correlation, unless there are at least ten data values per correlation length (Ref 21). The
determination of even a simple parameter, such as rms roughness, is also affected (Ref 22, 23). When too many points are
used, more mass storage and computing time per image are required than necessary. Also, the determination of noise-
sensitive parameters can be adversely affected (Ref 24). This is because extremely fine point spacings may enhance the
ability of the computer to record the noise in the profiling system, along with the topographic information.
One solution is to acquire as many points as possible and later discard the redundant or unimportant values. There are a
variety of image data-compression techniques that remove redundant or unimportant information when the image is
stored in memory or disk. The best compression technique depends on which aspects of the image are redundant or not
important to image quality. Several data-compression techniques have been proposed for surfaces of materials. One
technique uses Fourier transforms (Ref 25, 26). By storing only the "important" frequencies, the amount of data can be
reduced. The selection of which frequencies are not stored implies that features of that lateral size range can either be
extremely small in vertical height, compared to other features, or are unimportant. Other procedures attempt to determine
the "optimum" point spacing using autocorrelation functions (Ref 27), bandwidths (Ref 24), or information content (Ref
28). If variable point spacings are allowed, then motifs provide another technique (Ref 8). Many of the possible data-
compression techniques do not appear to have been tried on images of surfaces of materials.
Walsh or Hadamard transforms, where a surface is modeled as a series of rectangular waves, can be used in place of
Fourier transforms. This often results in less noise in the reconstructed image, although Fourier transforms may better
reproduce the original peak shape (Ref 26). Although there do not appear to be any references in the literature on usage as
a data-compression technique specifically for the surfaces of materials, the coefficients have been used to characterize
these surfaces (Ref 29, 30). Many other data-compression techniques are also available.
Potential Pitfalls
Many of the potential pitfalls in intensity image processing are potential pitfalls in topographic image processing as well.
For example, when determining the roundness of an object, the number computed is dependent on the magnification used
(Ref 31). A computed area or length also depends on the scale used, this being one of the basic concepts behind fractals,
which are discussed in detail in the section "Fractals, Trees, and Future Investigations" in this article.
Another pitfall is the fact that the surface is being modeled as a single-valued function in x and y, when it may in fact not
be. One example is a case where a "chip" of material is curled over the side of a machined groove. There are at least three
z heights: the top side of the curled chip, the underside of the curled chip, and the top surface of the bulk material below
that chip. A profiling machine would report only the top side of the curled chip as the z height at that x,y location. Any
estimate of volume would obviously be larger than the actual volume of material. Thus, an image of a surface is actually
made up of only the highest points on the surface. A top view is the only truly accurate rendering of the image; other
renderings, such as isometric or side views, are only approximations. This is because these other renderings give the
appearance of "knowing" what is below those highest points.
An analogous situation in intensity images is the "automatic tilt correction" on some SEMs (Ref 31). Suppose an intensity
image of a sphere on a steeply sloped plane is acquired and that slope is removed in software so as to make the plane
appear horizontal. A side view of this situation is shown in Fig. 1. When the software attempts to "level" the image, the
radius of the sphere will be elongated in the direction of the tilt and remain constant in the orthogonal direction. The
sphere will then appear as an ellipsoid, and not as a sphere.
Fig. 1 Side view of a sphere on a sloped plane
Estimation and Combination of Intensity and Topographic Images
Simply displaying a topographic image as though it were an intensity image (which can be a very powerful tool) does not
show the user how the surface would actually appear under a microscope. The heights are known, but the color,
reflectivity, and translucency of the surface are not. Conversely, a microscope image gives clues as to the surface heights,
but does not do so quantitatively. It may be obvious that a surface is pitted, for example, but the depth of those pits are not
known. Three issues are therefore addressed: (1) The manipulation of an optical or SEM image to yield topographic
information; (2) The rendering of topographic information that actually looks like the surface; (3) The combination of
optical and topographic information together onto one rendering.
Transforming an intensity image to a topographic image can be approached in several ways. All approaches
involve a "nicely behaved" characteristic of the surface. One approach matches stereo pairs. Each feature in a left-eye
image is matched to the same feature in a right-eye image. When the two images are compared, the amount of lateral
displacement of each feature is related to its z height. Thus, a z height image can be created. The features must be distinct
and well defined for this approach to work well. An example of this in use is in the measuring of integrated circuit
patterns (Ref 32).
Another approach assumes that the optical properties of the surface are relatively constant. If the original surface does not
have this property, then a replica can be made and examined, instead. When properly lighted, each gray level in the
intensity image is proportional to the slope of the surface at that location (Ref 33). The topographic image can therefore
be found by integrating the intensity image.
An example of a third approach is a wear scar on a ball. The volumes of such scars are often determined by measuring the
scar width in an intensity image and assuming that the scar is relatively flat or of a fixed radius in z (Ref 34). However,
the scars may be of unknown or varying radii. More accurate volume estimates can be obtained by outlining the edge of
the worn scar and assuming the outlines are connected by lines or curves across that scar (Ref 35). This is shown in Fig.
2, where the surface has, in effect, been estimated from its intensity image and the known geometries in that image.
Fig. 2 Example of estimating a topographic image from an intensity image using known geometries
A nonrotating ball was slid repeatedly against abrasive paper in the y direction, forming a scar on the ball. An optical
photomicrograph that looks down onto the scar was taken, digitized, and the intensity image was shown on the computer
screen. The user then traced the outline of the scar using a pointing device. This is shown as the near-elliptical shape in
Fig. 2(a). The software then assumed that the x,y location of the center of the scar coincided with the x,y coordinate of the
center of the ball. Knowing the radius of the ball, the software then computed the z heights of all the x,y points on the
outline of the scar, because they must lie on the sphere. To estimate the z values inside the scar outline, the values of the
outline were connected by straight lines in the y direction, as shown in Fig. 2(b).
Rendering and Combining Images. Actually transforming a topographic image to an intensity image is rarely done
for surfaces of materials. The appearance of a surface under a microscope is typically approximated by simply rendering
the topographic image as an isometric view. Isometric views can be generated by most image analysis software. The
simplest isometric view is a stick-figure type of drawing, where no attempt is made to show how a light source would
interact with the surface (Ref 18). These views may or may not have hidden lines removed. The next level of
sophistication assumes that the optical properties are constant across the entire surface. One or more light sources are
assigned locations in space, and the view is "shaded," giving a more realistic appearance. Some software takes into
account the shadows that one feature casts onto another, whereas others do not. Often, however, the optical properties of
real surfaces are not constant across the entire surface.
Given optical properties maps of reflectivity, for example, some software can create very realistic renderings (Ref 36). An
intensity image of a properly lighted surface can be used as a reflectivity map. Therefore, such software can be used to
combine an intensity image and a topographic image of the same area to produce a rendering that exhibits both optical
and topographic qualities of the surface.
Relating Two- and Three-Dimensional Parameters
Situations in which researchers have preferred the more traditional two-dimensional parameters have occurred. One
example is the case where a large body of two-dimensional data has already been collected and there is a need to compare
newly acquired data with previously obtained values. Even in these cases, the ability to select which two-dimensional
trace to use for analysis from a three-dimensional topographic image is sometimes necessary (Ref 37). Additionally, the
repetitive application of the analysis for a large number of traces can provide statistical information as to the repeatability
of the results obtained for a given specimen (Ref 38, 39, 40, 41, 42). When applied to worn surfaces, a two-dimensional
parameter can often be plotted as a function of sliding distance, giving clues as to the mechanisms involved (Ref 43). It is
possible to estimate three-dimensional parameters from two orthogonal traces. This has been applied to mold surface
finish (Ref 44) and has been used in the comparison of the fractal dimension (discussed later in this article) both with and
across the lay of engineered surfaces (Ref 45).
However, better results are often obtained from full images (Ref 46). Many of the customary two-dimensional parameters
are easily extendable to three dimensions. Perhaps the best-studied parameters in both two and three dimensions are
roughness parameters, such as rms values. Generally, two-dimensional roughness parameters have smaller values than
their three-dimensional counterparts for nondeterministic surfaces, and have about equal values for deterministic surfaces.
This result is derived from both theoretical work (Ref 1) and actual data (Ref 38).
There are two explanations for this result. One is that single traces have a high probability of missing the highest peaks on
a surface, whereas an area profile has a much better chance of taking these into account (Ref 1). Another explanation
involves the fact that nondeterministic surfaces have waviness in both the x and y directions (Ref 47). Waviness in the x
direction is generally removed by filtering for both the two- and three-dimensional roughness calculations. The two-
dimensional calculation always removes waviness in the y direction, because each trace is leveled individually. The three-
dimensional calculation, where the same plane is subtracted from all of the trees, does not do so unless a filter is
specifically applied to the image in the y direction. Thus, the three-dimensional roughness parameter may or may not
include the waviness in the y direction, depending on how the parameter is computed.
When analyzing worn surfaces, some area profiling machines use the unworn part of a surface as a reference. This is done
by fitting the unworn part of each trace to a line, and subtracting the line from that trace (Ref 41, 43). An example of this
is shown in Fig. 3. Typically, this is performed because of drift problems while the traces are being acquired and to make
the worn volume measurements more accurate. The effect is to filter the waviness in the y direction. One might therefore
expect that a three-dimensional roughness parameter computed from this image would be more nearly equal to the two-
dimensional equivalent than the same parameter applied to an image acquired by a machine that only uses its own
reference plane. However, this does not appear to have been rigorously demonstrated.
Fig. 3 An x, ,z coordinate image of the doughnut-shaped scar on the top ball in a four-ball test
Figure 3(a) shows the "as traced" data. Note the vertical undulation of the surface. This is due primarily to mechanical
errors in the motor stage used to hold the ball during image acquisition. For each trace, the unworn area can be fit to a
line, and that line used to make the trace level with respect to the other traces. This is shown in Fig. 3(b).
The relationships between the two- and three-dimensional values for other parameters are not as well documented as
roughness. Other statistical parameters, such as skewness and kurtosis (which help characterize the distribution of z
heights), have been computed for both engineered (Ref 42, 46) and worn (Ref 48) surfaces. Aspect ratio parameters have
been proposed for circular wear scars (Ref 40) and for the features in worn areas (Ref 43). Fractal dimensions can also be
determined in three dimensions (Ref 49, 50). It should be remembered that the values obtained for many two-dimensional
parameters are often quite different, depending on the direction of the trace. Rms roughness (Ref 51), autocorrelation (Ref
52), and fractal dimension (Ref 45) are examples of this.
Lessons from Two-Dimensional Analysis
Example 1: Understanding How a Parameter Behaves.
In the late 1970s, it was discovered that there is nearly the same linear relationship between the log of the wavelength and
the log of the normalized power spectral density for a very large variety of surfaces (Ref 53). These surfaces span almost
nine orders of magnitude in size. Values for motorways, concrete, grass runways, lava-flows, ship hulls, honed raceways,
ground disks, ring-lapped balls, and other surfaces were used. An amazingly universal characteristic of real surfaces was
discovered. Today, it is known that this occurs because these surfaces are fractal in nature (Ref 45). Imagine that a
researcher does not know of this universality, but notices that this relationship exists for a particular set of surfaces. It
might be tempting to assume that something was unique about these particular surfaces, when, in actuality, certain
parameters behave in certain ways regardless of the type of surface.
Example 2: Determining a Reference Line or Parameter Value on a Pitted or
Grooved Surface.
Certain features on the surfaces of some materials do not affect performance and should be ignored when leveling, fitting,
or determining roughness parameters. An application where a small roughness is required on a surface, except for
periodic deep scratches to contain lubricant, is one example. The porosity in many ceramics is another.
One approach to evaluating these types of surfaces is to be able to selectively ignore certain z values, based on an
appropriate criterion. One example of this is to ignore z values that are several standard deviations away from the average
(Ref 54). Wide scratches can be detected and ignored by looking for clusterings of these outliers.
It should be noted that a single trace cannot distinguish between a scratch and a pit. In some applications, such as the
characterization of corrosive pitting, that information may be desirable. Image analysis can determine such differences in
several ways, such as by computing aspect ratio parameters and by pattern matching.
Example 3: Designing Parameters.
When two-dimensional parameters became commonly used in materials research, a proliferation of many similar, but not
identical, parameters appeared in the literature. One study used correlation analysis to examine 30 parameters applied to
various engineered surfaces (Ref 55). Many of these parameters were found to be highly correlated, and several were
selected as being the least redundant. It was suggested that all or some subset of these few should be used to study
engineered surfaces, because they each revealed a different characteristic of these surfaces.
Other researchers have performed similar studies using correlation (Ref 56) and cluster analysis (Ref 57). The
popularization of three-dimensional parameters may, in some ways, worsen the proliferation of parameters. However,
image analysis can be thought of as either a language or tool box of techniques for optimizing parameters to suit
particular needs. Evaluation procedures can be custom built from combinations of relatively standard image operations.
The idea of designing a parameter for an application has found its way into two-dimensional parameters. Examples
include the German standard DIN 4776 (R
k
) (Ref 11, 58), functional filtering (Ref 1, 10), and the French standard NF05-
015 (motifs) (Ref 8, 9, 10). Invariably, some combinations will prove useful in a wide range of applications, whereas
others will fall into obscurity.
Selecting an Appropriate Coordinate System
Figure 4 shows a few of the worn specimen/coordinate system combinations possible. Figure 4(a) shows an x,y,z
coordinate system used for the wear track on a flat in a pin-on-flat test. The left side of Fig. 4(b) shows an x, ,z
coordinate system used for the wear track on a fixed cylinder in a rotating cylinder on a fixed-cylinder wear test. The right
side of Fig. 4(b) shows an x, z coordinate system used for the wear scar on a top ball in a four-ball test. Figure 4(c)
shows a
1
,
2
,z coordinate system used to characterize an entire ball surface after having been used in a ball-bearing
assembly.
Fig. 4 Possible worn specimen/coordinate systems
The geometry of the area of interest generally determines which coordinate system is the most efficient to use. Take the
example of a ball. The typical x,y,z coordinates can be used if the feature of interest were the wear scar on a ball in a test
where the ball slides on a flat without rotating. However, an x, z system may be more efficient if it were the scar on the
top ball in a four-ball test (Ref 40). A
1
,
2
,z system can be used if the entire ball surface is of interest, as in the case of
ball bearings in head/disk assemblies (Ref 59) or in the evaluation of sphericity (Ref 60). Combinations of coordinate
systems can be used on the same ball (Ref 61). A
1
,
2
,z system can be used to get an overall view of the ball, and an
x,y,z system can be used to "zoom in" on specific features. Sometimes,
1 2
,z coordinate systems are scaled as though
they were x,y,z coordinates (Ref 41). This can easily be done if the diameter of the ball is known. Bores and holes (Ref
62), as well as valve seats (Ref 63, 64), have been characterized in x, ,z coordinate systems.
The x, ,z coordinate system is sometimes referred to as a cylindrical coordinate system. However, as Fig. 4 shows, both
cylinders and spherical balls can require the use of this system. The x,
1
,
2
coordinate system is sometimes referred to as
a spherical coordinate system. As noted above, a spherical ball can be profiled using x,y,z or x, ,z coordinates, as well.
Thus, these names should be used carefully. When reading the literature, for example, it is occasionally easy to confuse a
cylindrical specimen with a cylindrical coordinate system.
The type of analysis to be performed can also affect the coordinate system chosen for use. For example, a planar
machined surface can be traced using an x, ,z coordinate system, where the traces radiate from some central location.
When used in conjunction with autocorrelation functions, these can be used to graphically characterize the lay of a surface
(Ref 52). When used in conjunction with cross-correlation functions, these can also be used to quantify the isotropy of a
surface (Ref 65, 66).
Specialized hardware is generally required for the acquisition of images using alternate coordinate systems. The analysis
software may need to be modified, as well. The calculation of worn volume, for example, may require a different equation
for x,y,z and x, ,z coordinate systems (Ref 40).
Computing Differences Between Two Traces or Surfaces
Perhaps the most commonly performed manipulation of topographic data, whether in the form of linear traces or images
over an area, is computing the difference between two traces or images. This fact is important, because although it is one
of the simplest manipulations, it is also prone to potentially large errors if not done carefully. Examples that illustrate this
point and techniques for avoiding these errors are discussed below. It is important to remember, particularly in this
section of the article, that the word "image" is used for both single tracings from a standard two-dimensional profiling
machine and true images.
Example 4: Determining a Reference.
Often, a second image is computed from an original image and the difference between the two is derived. When leveling,
for example, a reference line or plane is often fit to some or all of the image, and that line or plane is subtracted from the
image. Different types of fits can be performed, and different reference lines or planes will result. Research has been
conducted to compare various types of fits (Ref 67). It was found that the least-squares fit is acceptable for nearly level
surfaces; orthogonal least-squares fit is better for steeply sloped surfaces; and geometric mean is preferred when the data
values in the image have a log-normal distribution. The problem of ignoring outliers in the determination of a reference
has been discussed above.
Example 5: Roughness, Waviness, and Error of Form.
Another example of computing a second image and deriving the difference is in the separation of an image of a machined
surface into roughness, waviness, and error of form (Ref 68). Roughness consists of the finer irregularities. Waviness is
the more widely spaced component of surface texture. The two components together are referred to as surface texture.
Error of form is the deviation from the nominal surface not included in surface texture. These components generally result
from different aspects of the machining process. An example is a ground surface. The roughness can result from the
grinding wheel-workpiece interaction, the waviness from machine vibration, and error of form from errors in the guides
that control the movement of the grinding wheel over the workpiece.
Roughness is often modeled as the high-frequency component, waviness as a mid-frequency component, and error of
form as the lowest-frequency component of a surface. In theory, if an image of a surface was divided into these separate
components, and these components were recombined, the result would be to recreate the original image. In practice,
however, significant distortions often result.
Perhaps the best-known example of this is the acquisition of a roughness trace from a standard profiling device (Ref 69).
Electronic filters allow the higher frequencies in the z height signal to pass through while blocking the lower frequencies.
Thus, an image of the roughness component of the original image is obtained. The difference between the roughness
image and the original image gives an indication of the waviness and error of form components of the surface. However,
the roughness image is distorted, because of time lags in the electronic filters. The difference image of the other surface
components is therefore also distorted. This effect can be minimized using modern digital filtering techniques, which do
not introduce time-lag errors. Standards are currently being developed for these (Ref 70).
Example 6: Error Correction.
The differences between two images are also used to correct for errors in the z reference plane. Most profiling devices
have some form of a precisely flat surface, which defines z = 0. Errors in this reference plane are often reproducible and
can be measured. An error image can thus be created and stored for later use. When the device is used to measure
surfaces, this error image can be recalled and subtracted from the acquired topographic images to increase their accuracy
(Ref 71). A similar technique can be used for intensity images to compensate for uneven illumination.
Example 7: Comparing Mated Surfaces.
Wear studies that examine the difference between two mated surfaces have been made. In one study, the differences in the
roughness images of two surfaces that had been in sliding contact with each other were used to characterize the
conformity between them (Ref 72). Errors associated with using a roughness image have been discussed above. Ignoring
waviness when modeling the way that two surfaces interact can adversely affect the results in some situations and
therefore must be done with care (Ref 73). Another issue is that of the elastic deformation of the surfaces while they were
mated. The topographies of the two surfaces while they were pressed together under load is undoubtedly different from
their topographies while traced. Various researchers have attempted to model this (Ref 74, 75, 76, 77, 78, 79, 80, 81, 82,
83, 84).
Example 8: Determining Worn Volumes.
Described below are four areas of concern.
The Difference Image. The worn volumes of wear scars are often computed by first subtracting the image of an
idealized unworn surface from the image of a worn surface. Either lines or planes can be used for a flat specimen, and
circles for a ball or cylinder (Ref 40). Figures 3, 5, and 6 exemplify this. Figure 3(b) shows an image with x, ,z
coordinates of the doughnut-shaped wear scar of the top ball in a four-ball wear test. For each trace in the image, a least-
squares circle is determined from unworn areas on either side of the scar, and that entire trace is then subtracted from this
circle.
Fig. 5 (a) Difference image derived from image in Fig. 3(b). (b) Binary image
Fig. 6 (a) Worn area of image in Fig. 3(b). (b) Worn area of difference image shown in Fig. 5(a)
This new image is referred to as a difference image, and is shown in Fig. 5(a). It represents the difference between an
unworn and worn ball. Where there has been a net loss of material, the difference image will have a positive value. Where
there has been a net gain of material, the difference image will have a negative value. Where there has been no net change
of material, the difference image will have a value close to zero. Values significantly different from zero can then be used
to determine which areas of the image are worn and which are unworn.
A binary image is shown in Fig. 5(b). For each x,y location, the binary image has a value of 1 if that location is to be
considered a part of the wear scar, and a value of 0, otherwise. This binary image can then be used to "eliminate" parts of
the original image and difference image that are not part of the wear scar, and should therefore not be considered in any
statistics computed.
Figure 6(a) shows just the worn area of the image in Fig. 3(b). Curvature, surface area, or roughness, for example, can be
computed from this image. Figure 6(b) shows just the worn area of the difference image shown in Fig. 5(a). Worn volume
can be computed from this image.
Alignment. The image of the unworn surface need not be idealized, but may actually have been measured before the
wear test. Examples of this include the wear of copper (Ref 85), teeth (Ref 86), valve seats (Ref 63), and chemically
active scuffed bearing surfaces (Ref 87, 88). The electroplating process can also be studied by comparing the topography
of a surface during the various stages of plating (Ref 89). One source of error is the problem of aligning the "before" and