Obstructive Sleep Apnea Diagnosis and Treatment - part 2 pps
Bạn đang xem bản rút gọn của tài liệu. Xem và tải ngay bản đầy đủ của tài liệu tại đây (1.23 MB, 47 trang )
Screening and Case Finding 33
53. Issa FG, Morrison D, Hadjuk E, et al. Digital monitoring of sleep disordered breathing
using snoring sound and arterial oxygen saturation. Am Rev Respir Dis 1993;
148:1023–1029.
54. Vazquez J, Tsai W, Flemons W, et al. Automated analysis of digital oximetry in the diag-
nosis of obstructive sleep apnoea. Thorax 2000; 55:302–307.
55. West P, George CFP, Kryger MH. Dynamic in vivo response characteristics of three
oximeters: Hewlettpackard 47201A, Biox III, and Nellcor N-100. Sleep 1987; 10:263–271.
56. Severinghaus JW, Naifeh KH, Koh SO. Errors in 14 pulse oximeters during profound
hypoxia. J Clin Monit 1989; 5:72–81.
57. Vegfors M, Lindberg L G, Lennmarken C. The influence of changes in blood flow on
the accuracy of pulse oximetry in humans. Acta Anaesthesiol Scand 1992; 36:346–349.
58. Kirk VG, Bohn SG, Flemons WW, et al. Comparison of home oximetry monitoring with
laboratory polysomnography. Chest 2003; 124:1702–1708.
59. Stoohs R, Guilleminault C. MESAM 4: an ambulatory device for the detection of patients
at risk for obstructive sleep apnea syndrome (OSAS). Chest 1992; 101:1221–1227.
60. Koziej M, Cieslicki J, Gorzelak K, et al. Hand-scoring of MESAM 4 recordings is more
accurate than automatic analysis in screening for obstructive sleep apnoea. Eur Respir
J 1994; 7:1771–1775.
61. Esnaola S, Duran J, Infante-Rivard C, et al. Diagnostic accuracy of a portable recording
device (MESAM IV) in suspected obstructive sleep apnea. Eur Respir J 1996;
9:2597–2605.
62. Cirignotta F, Mondini S, Gerardi R, et al. Unreliability of automatic scoring of MESAM 4
in assessing patients with complicated obstructive sleep apnea syndrome. Chest 2001;
119:1387–1392.
63. Fietze I, Dingli K, Diefenbach K, et al. Night-to-night variation of the oxygen desaturation
index in sleep apnoea syndrome. Eur Respir J 2004; 24:987–993.
64. Westbrook PR, Levendowski DJ, Cvetinovic M, et al. Description and validation of the
apnea risk evaluation system: a novel method to diagnose sleep apnea-hypopnea in the
home. Chest 2005; 128:2166–2175.
65. Pillar G, Bar A, Shlitner A, et al. Autonomic arousal index: an automated detection based
on peripheral arterial tonometry. Sleep 2002; 25:543–549.
66. Ayas NT, Pittman S, MacDonald M, et al. Assessment of a wrist-worn device in the detection
of OSA. Sleep Med 2003; 4(5):435–442.
67. Schnall RP, Shlitner A, Sheffy J, et al. Periodic, profound peripheral vasoconstriction: a
new marker of obstructive sleep apnea. Sleep 1999; 22:939–946.
68. Bar A, Pillar G, Dvir I, et al. Evaluation of a portable device based on peripheral arterial
tone for unattended home sleep studies. Chest 2003; 123:695–703.
69. Pittman S, Tal N, Pillar G, et al. Automatic detection of obstructive sleep-disordered
breathing events using peripheral arterial tonometry and oximetry. J Sleep Res 2000;
9(suppl):309.
70. Zou D, Grote L, Peker Y, et al. Validation a portable monitoring device for sleep apnea
diagnosis in a population based cohort using synchronized home polysomnography.
Sleep 2006; 29(3):367–374.
71. Øverland B, Bruskeland G, Akre H, et al. Evaluation of a portable recording device
(Reggie) with actimeter and nasopharyngeal/esophagus catheter incorporated.
Respiration 2005; 72:600–605.
72. Ficker JH, Wiest GH, Wilpert J, et al. Evaluation of a portable recording device
(Somnocheck) for use in patients with suspected obstructive sleep apnoea. Respiration
2001; 68:307–312.
73. Meslier N, Simon I, Kouatchet A, et al. Validation of a suprasternal pressure transducer
for apnea classification during sleep. Sleep 2002; 25:753–757.
74. Nakano H, Hayashi M, Ohshima E, et al. Validation of a new system of tracheal sound
analysis for the diagnosis of sleep apnea-hypopnea syndrome. Sleep 2004; 27:951–957.
75. Sadeh A, Hauri PJ, Kripke DF, et al. The role of actigraphy in the evaluation of sleep
disorders. Sleep 1995; 18:288–302.
76. Hedner J, Pillar G, Pittman SD, et al. A novel adaptive wrist actigraphy algorithm for
Sleep-Wake assessment in sleep apnea patients. Sleep 2004; 27:1560–1566.
34 George
77. Middelkoop HA, Knuistingh Neven A, van Hilten. Wrist actigraphic assessment of sleep
in 116 community based subjects suspected of obstructive sleep apnoea syndrome.
Thorax 1995; 50:284–289.
78. Guilleminault C, Connoly S, Winkle R, et al. Cyclical variation of the heart rate in sleep
apnea syndrome. Mechanisms and usefulness of 24h electrocardiography as screening
technique. Lancet 1984; 1:126–131.
79. Pitson DJ, Sandell A, van der Hout R, et al. Use of pulse transit time as a measure of inspi-
ratory effort in patients with obstructive sleep apnoea. Eur Respir J 1995; 8:1669–1674.
80. Argod J, Pepin JL, Smith RP, et al. Comparison of esophageal pressure with pulse transit
time as a measure of respiratory effort for scoring obstructive. Nonapneic respiratory
events. Am J Respir Crit Care Med 2000; 162:87–93.
81. Schwartz DL. The pulse transit time arousal index in obstructive sleep apnea before and
after CPAP. Sleep Med 2005; 6:199–203.
82. Guyatt G, Tugwell P, Feeny D, et al. The framework for clinical evaluation of diagnostic
technologies. CMAJ 1986; 134:587–594.
35
Polysomnography and Cardiorespiratory
Monitoring
Michael R. Littner
VA Greater Los Angeles Healthcare System, Sulpulveda, California and
David Geffen School of Medicine, University of California, Los Angeles,
California, U.S.A.
INTRODUCTION
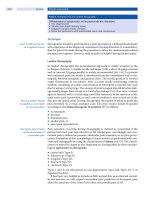
The obstructive sleep apnea-hypopnea syndrome (OSA) is recognized pre-
dominantly by daytime somnolence and night-time snoring often in obese individ-
uals (1,2). The diagnosis is confirmed by demonstrating a sufficient number of
obstructive apneas (absence of airflow with continued respiratory effort) and/or
obstructive hypopneas (reduction in airflow despite sufficient respiratory effort to
produce normal airflow) (1). The daytime somnolence appears to result, in large
part, from short, amnestic arousals that fragment and reduce the efficiency of sleep.
OSA appears to affect about 4% of men and 2% of women between 30 and 60 years
of age (3). OSA is associated with systemic hypertension, myocardial infarction,
motor vehicle accidents, and cerebrovascular accidents (4–7).
Daytime somnolence is a nonspecific symptom and may be due to narcolepsy,
insufficient sleep, and idiopathic hypersomnia among other conditions (2). In addi-
tion, snoring is a nonspecific finding; for example, 67% of obese patients [body mass
index (BMI) ≥ 30] who snored loudly (patient report) had OSA (8). The general non-
specificity of daytime sleepiness and snoring requires objective measurement of
apneas and hypopneas during sleep for confirmation of OSA.
In general, confirmation involves an overnight sleep study while monitoring
a number of respiratory channels (nasal and oral airflow, chest wall and abdominal
movement, and oximetry), sleep staging by electroencephalogram (EEG) (central
and occipital electrodes usually referenced to the ear), electro-oculogram (right and
left eye movement) and chin electromyogram, at least a one-lead electrocardiogram,
as well as leg movements (bilateral anterior tibialis electrodes) which may also pro-
duce frequent arousals (9). The study is attended by a technician (poly somnographic
or sleep technologist) to perform and observe the study, ensure quality and safety,
and make needed interventions including application of the most frequently used
therapy, continuous positive airway pressure (CPAP). This approach is called
polysomnography (PSG).
The number of potential patients usually exceeds the number of sleep laboratory
facilities capable of performing the test in a timely fashion. The labor intensity of the
attendant, scoring and interpretation of the study, and cost of the space and equipment
make PSG relatively expensive, typically costing $1000 or more per study (10).
To increase access to diagnosis and potentially reduce cost, there has been an
effort to produce systems that incorporate part or all of the PSG but make it portable
and ideally usable without an attendant technician. The ideal system would measure
the minimum number of channels necessary, be self-contained and self-administered
by the patient, be amenable to rapid and accurate scoring, and provide information
3
36 Littner
that would confirm OSA with identical specificity and sensitivity to the PSG. This
review will evaluate the ability of various methods to achieve this goal in adults.
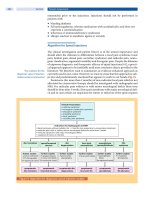
PATHOPHYSIOLOGY
Patients with OSA experience intermittent upper airway obstruction above the
epiglottis generally of the pharynx. The pharyngeal musculature attempts to keep
the upper airway open to permit ventilation and opposes subatmospheric pressure
in the pharynx that results from turbulent flow during partial upper airway obstruc-
tion. The genioglossus muscles also keep the upper airway clear of obstruction by
pulling it forward. Anatomic factors (e.g., adipose tissue, tongue size, mandibular
configuration, uvula, and tonsils) as well as neuromuscular factors (e.g., sleep state
affecting the pharyngeal muscles and alcohol) contribute to increasing, maintaining
or reducing upper airway patency (11).
Obstructive events result from the completely or partially obstructed upper
airway during sleep may lead to cessation (apnea) (Fig. 1) or reduction (hypopnea)
(Fig. 2) of airflow. Partial obstruction can also lead to snoring without a reduction in
airflow. Partial or complete cessation of respiratory effort leads to central apneas
(Fig. 3) or hypopneas. Mixed events start with a central component and end with an
obstructive component. Mixed apneas (Fig. 4) and hypopneas are considered to
be obstructive in behavior.
FIGURE 1 A series of obstructive apneas (no airflow with continued respiratory effort) from a Level
III portable monitoring system used unattended in the patient’s home. Note the severe cyclical arte-
rial oxygen desaturations associated with the apneas. The patient was instructed in the outpatient
area of the medical center, took home the system, attached it to himself just before retiring for the
night, and brought the system back the next day for analysis. The epoch is 10 minutes in duration.
Note that the events were occurring so frequently that the labels “Desaturation” and “Obstructive
Apnea” are partially obscured on the record. Abbreviations: SpO2, pulse oximetry; HR, heart rate;
FLOW from a nasal
/
oral pressure cannula; EFFOR(T) from the movement of a chest wall belt;
POS(ition) is supine (S).
Polysomnography and Cardiorespiratory Monitoring 37
Although the above distinctions are made, the vast majority of patients
with sleep apnea have predominantly obstructive apneas and hypopneas
(continued respiratory effort with absence or reduction in airflow, respectively)
even if there are elements of central or mixed events. Central apneas are seen
more commonly in patients with congestive heart failure (in association with
Cheyne-Stokes respiration), underlying neurologic disorders (such as stroke), or
in individuals who reside at higher altitudes (1,12).
A variant is known as the upper airway resistance syndrome (UARS) (1), in
which the pathologic events are respiratory effort-related arousals (RERAs). RERAs
as defined by the American Academy of Sleep Medicine (AASM) (13) are due to
partial upper airway obstruction with an increase in amplitude of negative intratho-
racic pressure (increase in respiratory effort), leading to minimal reduction in air-
flow and arterial oxygen saturation but terminating in an arousal. The gold standard
for assessing RERAs is by esophageal manometry (i.e., pressure measurements),
which typically uses either a water-filled catheter or balloon placed in the esopha-
gus inserted via the nose. Esophageal pressure assesses respiratory effort or work of
breathing by estimating transmitted intrathoracic pressure, and can be useful in
FIGURE 2 An obstructive hypopnea associated with snoring and ending in an arousal. The airflow
is reduced but not absent and is associated with continued respiratory effort with a paradox of the
abdominal and thoracic movement (respiratory excursions are out of phase) and an arterial oxygen
desaturation to 82%. The hypopnea is occurring in rapid eye movement (REM) sleep (REMs seen
at the beginning and end of the epoch). The hypopnea ends with a snore associated with a brief
arousal noted by an increase in chin electromyogram tone and an increase in the electroencephalo-
gram signal frequency. The record also demonstrates electrocardiogram artifact in several leads.
The epoch is 30 seconds in duration. Abbreviations: LOCA2, left eye electro-oculogram referenced
to the right (A2) ear; ROCA1, right eye electro-oculogram referenced to the left (A1) ear; CHIN,
electromyogram recorded from chin muscles; C3A2, O1A2, electroencephalogram electrodes
placed centrally or occipitally, respectively, and referenced to the right (A2) ear; EKG, electrocardio-
gram; LEGS, sensors placed on each leg and linked to provide a single signal for leg movement;
SNOR, snoring intensity by microphone; FLOW, airflow measured by oronasal thermistor; THOR
and ABDM, thoracic and abdominal movement, respectively, measured by strain gauges; SaO
2
,
pulse oximetry from a finger sensor.
38 Littner
helping the sleep specialist to identify and distinguish abnormal breathing events
(Figs. 5 and 6). Alternatively, a RERA may be inferred from repetitive snoring
increasing in amplitude followed by an arousal (Fig. 7). An arousal is an EEG event
characterized as an abrupt shift in EEG frequency (excluding delta waves and
spindles) lasting more than three seconds and preceded by at least 10 seconds of
sleep. An arousal is frequently accompanied by an increase in chin muscle tone,
particularly during rapid eye movement (REM) sleep (14).
Cardiac arrhythmias are common in patients with OSA. The most common is
sinus arrhythmia but atrial fibrillation, bradycardia, premature atrial and ventricular
contractions, and nonsustained and sustained ventricular tachycardia occur more
frequently than in control patients (15).
FIGURE 3 A central apnea, probably from a postarousal hyperventilation apnea from an in-
laboratory polysomnogram. The chest and abdominal effort are lacking, there is no airflow and there
are cardiac oscillations observed on the airflow channel from small amounts of airflow resulting from
contraction and relaxation of the heart causing the lungs to slightly compress and decompress. The
patient had a modest 4% reduction in arterial saturation (not labeled except as “Desat”). The sleep
stage is non-rapid eye movement stage 1 with a frequency of electroencephalogram (EEG) activity
of 4 to 6 cycles/second after the arousal (EEG frequency ≥ 8 cycles/second, a subtle increase in
chin electromyogram activity and a leg movement from the arousal) that occurred at the beginning
of the epoch. The epoch is 60 seconds in duration. Abbreviations: LEOG, left eye electro-oculogram;
REOG, right eye electro-oculogram; CHIN EMG, electromyogram recorded from chin muscles; C3A2,
O2A1, electroencephalogram electrodes placed centrally or occipitally and referenced to the right
(A2) or left (A1) ear, respectively; L&R LEGS, sensors placed on each leg and linked to provide a
single signal for leg movement; EKG, electrocardiogram; SONOGRAM, snoring intensity by
microphone; AIRFLOW, airflow measured by oronasal thermistor; THORACIC and ABDOMINAL,
thoracic and abdominal movement, respectively, measured by strain gauges; OXIMETRY, pulse
oximetry from a finger sensor.
Polysomnography and Cardiorespiratory Monitoring 39
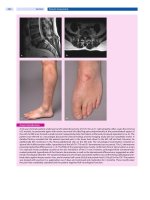
DIAGNOSIS OF OBSTRUCTIVE SLEEP APNEA
According to the International Classification of Sleep Disorders (second edition)
(ICSD-2) (2), the diagnosis is based on PSG and clinical criteria in adults and children.
The following is a brief overview of the diagnostic criteria.
In adults, the patient complains of daytime sleepiness, unrefreshing sleep,
fatigue, insomnia, awaking with breath holding, gasping, or choking, or there is a
bed partner that notes loud snoring or breathing pauses during sleep. If the patient
is not symptomatic, for example the patient has only snoring during sleep, then a
PSG showing ≥ 15 obstructive apneas, obstructive hypopneas, and/or RERAs per
hour of sleep can be confirmatory. If the patient is symptomatic, for example the
patient has daytime sleepiness, OSA is confirmed by a PSG showing ≥ 5 obstructive
apneas, obstructive hypopneas, and/or RERAs per hour of sleep.
A child may not be able to give a history and the parent or other caregiver may
note snoring, labored or obstructed breathing, or both during the child’s sleep. There
are a number of witnessed sleep events that may indicate OSA, which include para-
doxical inward rib cage motion during inspiration, movement arousals, sweating, or
neck hyperextension. In addition, the parent or caregiver may note that the child is
excessive sleepy during the day, has hyperactivity or aggressive behavior, has a slow
rate of growth, has morning headaches and/or enuresis. This is confirmed by a PSG
FIGURE 4 A mixed apnea with a central component (no airflow or respiratory effort) followed by
an obstructive component (no airflow with continued respiratory effort) from Level III portable moni-
toring system used unattended in the patient’s home. The patient was instructed in the outpatient
area of the medical center, took home the system, attached it to himself just before retiring for the
night and brought the system back the next day for analysis. The epoch is 60 seconds in duration.
Note that the start of arterial oxygen desaturation occurs at about 20 seconds after the start of the
apnea. This time delay is due to a combination of arterial circulation lag time from lungs to finger and
the oximetry machine electronic lag time from time of sensing to display. Abbreviations: SpO2,
pulse oximetry; HR, heart rate; FLOW from a nasal/oral pressure cannula; EFFOR(T) from the
movement of a chest wall belt; Pos(ition) is supine (S).
40 Littner
that demonstrates during sleep one or more apneas or hypopneas of at least two
respiratory cycles in duration, or frequent RERAs, arterial oxygen desaturation with
apnea, or hypercapnia, or frequent arousals and snoring associated with periods of
hypercapnia and/or arterial oxygen desaturation or frequent arousals associated
with paradoxical breathing (abdominal and thoracic movement out of phase).
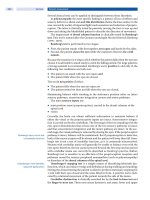
CLASSIFICATION OF METHODS FOR DIAGNOSIS OF
SLEEP-DISORDERED BREATHING
The AASM, formerly known as the American Sleep Disorders Association, in 1994
(16,17) classified diagnostic sleep equipment into four levels (Table 1). Attended PSG
has already been described and is Level I. Unattended PSG is Level II. Measurement
of a minimum of four channels, which must include oximetry, one channel each of
respiratory effort or movement and airflow or two channels of respiratory effort or
movement, and heart rate is Level III. A single or two-channel system typically includ-
ing oximetry is Level IV. For purposes of this review, traditional systems that do not
FIGURE 5 An obstructive apnea with a crescendo increase in esophageal pressure (Pes). Snoring
intensity, observed in the Mic channel, parallels the changes in esophageal pressure until the start
of the apnea. The apnea ends in an arousal, noted by an increase in chin and leg electromyogram
tone and an increase in the electroencephalogram signal frequency. There is a paradox of the
abdominal and thoracic movement (respiratory excursions are out of phase) and an arterial oxygen
desaturation to 87%. The apnea occurs in rapid eye movement sleep, and the epoch is two minutes
in duration. Abbreviations: C4A1, O1A2, electroencephalogram electrodes placed centrally or
occipitally and referenced to the left (A1) and right (A2) ear, respectively; Chin EMG, electromyo-
gram recorded from chin muscles; ROCA1, right eye electro-oculogram referenced to the left (A1)
ear; LOCA2, left eye electro-oculogram referenced to the right (A2) ear; PULSE, pulse rate; EKG,
electrocardiogram; LAT and RAT, leg movements measured from left and right anterior tibialis,
respectively; Mic, snoring intensity by microphone; Nasal and Oral, airflow assessed by pressure
transducer and thermistor, respectively; Chest and Abdomen, thoracic and abdominal movement,
respectively, measured by impedance bands; Pes, esophageal pressure measurements; SaO2,
pulse oximetry from a finger sensor. Source: Courtesy of Clete A. Kushida, M.D., Ph.D.
Polysomnography and Cardiorespiratory Monitoring 41
meet minimum criteria for a Level III will be classified as Level IV. The classification
is essentially one of lesser and lesser channels that are typically part of the PSG.
Portable monitoring systems are generally designed to be used unattended
usually in the patient’s home. However, the systems can also be used attended in
the sleep laboratory and this will also be reviewed. For purposes of this paper,
attended PSG will be the reference for comparison of portable monitoring systems.
WHAT IS THE PROPER STUDY DESIGN TO
VALIDATE A PORTABLE MONITOR?
As discussed in a review published in 2003 (18), validation of a particular device
involves comparison to attended PSG with determination of the sensitivity and
specificity of the portable monitor. This comparison should be made in a patient
population that is representative of the population in which the method is to be
FIGURE 6 A respiratory effort-related arousal (RERA) with a crescendo increase in esophageal
pressure (Pes) is depicted in the first half of the epoch. There is a decrease in nasal but not oral air-
flow, so the abnormal respiratory event does not meet criteria for a hypopnea. Snoring is observed,
and the RERA culminates in an arousal, noted by an increase in chin and leg electromyogram tone
and an increase in the electroencephalogram signal frequency. The RERA occurs in non-rapid eye
movement stage 1 sleep, and the arterial oxygen desaturates to 90%. Following the RERA, there is
a resumption of snoring and a crescendo increase in esophageal pressure, and the decrease in
both the nasal and oral airflow is more compatible with a hypopnea. The epoch is two minutes in
duration. Abbreviations: C3A2 and C4A1, left and right electroencephalogram electrodes placed
centrally and referenced to the right (A2) and left (A1) ear, respectively; O1A2 and O2A1, left and
right electroencephalogram electrodes placed occipitally and referenced to the right (A2) and left
(A1) ear, respectively; Chin EMG, electromyogram recorded from chin muscles; LOCA2, left eye
electro-oculogram referenced to the right (A2) ear; ROCA1, right eye electro-oculogram referenced
to the left (A1) ear; EKG, electrocardiogram; LAT and RAT, leg movements measured from left and
right anterior tibialis, respectively; SaO2, pulse oximetry from a finger sensor; Mic, snoring intensity
by microphone; Nasal and Oral, airflow assessed by pressure transducer and thermistor, respectively;
Chest and Abdomen, thoracic and abdominal movement, respectively, measured by impedance bands;
Pes, esophageal pressure measurements. Source: Courtesy of Clete A. Kushida, M.D., Ph.D.
42 Littner
used. Patient selection should be consecutive without undue referral biases or at
least with the referral bias clearly defined and uninfluenced by the investigator or a
small group of providers. In addition, the prevalence of OSA in the study popula-
tion should be typical of the population for which the device is ultimately to be
used. For example, if a method tests only high probability patients for validation,
the results cannot be confidently extrapolated to populations of moderate or low
probability.
There are two approaches that should be used to validate a portable monitor.
First, the sensitivity and specificity under ideal conditions should be determined in a
simultaneous comparison with attended PSG. This must be done blinded. The ques-
tion of whether a technician should intervene depends, in part, on the intended use of
the portable monitor. If there is consideration to use the portable monitor with a tech-
nician to attend the study, then intervention is appropriate. If the consideration is only
for unattended use, then there should be no intervention to repair or correct possible
data loss from the portable monitor. This provides the sensitivity and specificity for
the diagnosis in direct comparison during the same real-time period as the PSG. The
FIGURE 7 A series of increasing snores (noted as increasing duration of activity on the sonogram
channel), followed by an arousal marked by an increase in the frequency of the electroencephalo-
gram activity, a leg movement and an increase in chin electromyogram activity. The sleep stage is
non-rapid eye movement stage 2 with K complexes prior to the arousal. There is no obvious reduc-
tion in airflow or a decrease in arterial oxygen saturation. The epoch is 30 seconds in duration.
Abbreviations: LEOG, left eye electro-oculogram; REOG, right eye electro-oculogram; CHIN EMG,
electromyogram recorded from chin muscles; C3A2, O2A1, electroencephalogram electrodes
placed centrally or occipitally and referenced to the right (A2) or left (A1) ear, respectively; L&R
LEGS, sensors placed on each leg and linked to provide a single signal for leg movement; EKG,
electrocardiogram; SONOGRAM, snoring intensity by microphone; AIRFLOW, airflow measured by
oronasal thermistor; THORACIC and ABDOMINAL, thoracic and abdominal movement, respec-
tively, measured by strain gauges; OXIMETRY, pulse oximetry from a finger sensor.
Polysomnography and Cardiorespiratory Monitoring 43
TABLE 1 American Academy of Sleep Medicine Classification of Levels of Sleep Apnea
Testing (Modified)
Level I
Attended PSG
recording
Level II
Unattended
PSG
Level III
Modified portable
sleep apnea
testing
Level IV
a
Continuous single or
dual bioparameter
recording
Measures Minimum of 7,
including EEG,
EOG, chin
EMG, ECG,
ventilation,
respiratory
effort, oxygen
saturation
Minimum of 7,
including EEG,
EOG, chin EMG,
ECG or heart
rate, ventilation,
respiratory effort,
oxygen saturation
Minimum of 4,
including
ventilation, heart
rate or ECG,
oxygen saturation
Minimum of 1:
oxygen saturation,
ventilation, or
chest movement
Body position Yes Possible Possible No
Leg movement EMG or motion
sensor
desirable but
optional
Optional Optional No
Personnel Yes No No No
Interventions Possible No No No
a
Level IV may also include any device that does not meet criteria for a higher level.
Abbreviations: ECG, electrocardiography; EEG, electroencephalography; EMG, electromyography; EOG, electro-
oculography; PSG, polysomnography; patterned after Reference 16. Six hours overnight recording minimum.
Source: Ref. 16
report should include the apneas and hypopneas during various patient positions
for the PSG and for the portable system and whether there was intervention and if so,
details of the intervention. Ideally, the portable system should have a position moni-
tor. If the system does not perform well in this setting, the system is of questionable
use. This comparison is of benefit in validation for attended in-laboratory use only.
The second step in the validation process is to compare the in-laboratory PSG
to the portable monitor used in the intended environment, usually unattended in
the patient’s home. The study should be blinded, randomized and the PSG and
portable monitor should be applied in every patient. The interval between studies
should be short, preferably a week or less. Variables that may affect the results are
body position, total sleep time, REM sleep time, and environmental conditions such
as room temperature and extraneous noise. These contribute to normal night-
to-night variability (19), which may differ between the laboratory and portable
monitoring environment.
A strategy to deal with variability that is not an intrinsic characteristic of the
portable monitoring device is to also conduct the PSG on a second night in the labo-
ratory. Ideally, a fourth night should also be performed outside the laboratory in
order to determine the night-to-night variability of the unattended portable monitor.
This information would help separate the effects of night-to-night variability on the
results from those due to intrinsic differences between the PSG and portable monitor.
To date, one study of a Level III monitor has adopted much of this approach (20).
The methods should include full disclosure of the PSG and portable monitor
sensors and channels, definition of apneas and hypopneas for both the PSG and
portable monitor, epoch length for scoring of sleep and respiratory variables,
oximeter sampling and recording rates, and funding for the study.
44 Littner
WHAT CAN BE EXPECTED FROM A COMPARISON OF A PORTABLE
MONITOR TO POLYSOMNOGRAPHY?
The concept that portable monitoring can be as diagnostically effective as PSG rests
on the assumption that not all of the PSG monitored channels are necessary to make
a diagnosis of OSA. That is, some of the channels are either redundant or measure
variables that are not essential to the diagnosis. For this to be valid, the definition
of what constitutes a confirmatory study for OSA is important. The typical defini-
tion of an apnea is the cessation of airflow (i.e., a decrease of 90% or greater from
baseline levels) for 10 seconds or more that cannot be attributed to another cause or
artifact. A report of a task force of the AASM on research methods (13) provided an
alternative definition that did not distinguish between an apnea and a hypopnea;
the obstructive apnea/hypopnea event was defined as a reduction in airflow (50%
or greater from baseline levels) lasting 10 seconds or greater or a decrease in airflow
that does not meet this criterion but is accompanied by an arterial oxygen
desaturation (greater than 3%) or an EEG arousal. In addition, a RERA was included
as a respiratory event consistent with OSA that does not meet criteria for an apnea
or hypopnea. The Centers of Medicare and Medicaid Services (CMS) (i.e., Medicare)
requires a 4% desaturation during sleep in addition to airflow reduction (21). The
Medicare criteria require that sleep be measured using traditional sensors in a
facility-based sleep laboratory making most if not all portable systems currently
unacceptable as diagnostic devices for Medicare purposes.
The design of a portable system is potentially limited by the goals of measure-
ment. For example, if the goal is to define OSA by a combination of hypopneas asso-
ciated with oxygen desaturations and clear-cut apneas, a two-channel system may be
sufficient if the issues of sleep, central apneas, (apneas without continued respiratory
effort) and body position are not clinically relevant. On the other hand, the two-chan-
nel system is totally inadequate to detect hypopneas with arousals or RERAs. These
types of considerations have not been well-evaluated in most previous studies. Some
studies are weighted to favor the portable system by defining respiratory events
identically between the PSG and portable monitor with the exception of use of sleep
time in the PSG and recording time (often minus artifact) in the portable monitor. In
summary, the more types of events that are deemed necessary to make a diagnosis of
OSA, the less likely that the portable monitor will detect most of the events. With
these considerations in mind, the following section evaluates the evidence to support
or not to support the use of portable monitors to diagnose OSA.
WHAT IS THE EVIDENCE TO DATE? (SEE ALSO CHAPTER 2)
There are a large number of studies that have used portable monitors without direct
comparison to PSG for a variety of epidemiologic and diagnostic purposes. However,
these will not be reviewed since they provide little or no insight into the sensitivity
and specificity of portable monitoring compared to PSG in an individual patient.
Based on the evidence to be discussed, Level II and IV portable monitors are not
sufficiently accurate or validated to recommend for use at this time, particularly
unattended in the home. Level III monitors are useful attended in the laboratory
and of possible usefulness unattended in either the laboratory or the home.
In October 2003, a joint task force of the AASM, the American College of Chest
Physicians (ACCP) and the American Thoracic Society (ATS) published an
evidence-based review (Joint Review) of portable monitors (18). Fifty-one publica-
tions with 54 studies were reviewed. Sensitivities and specificities were calculated
Polysomnography and Cardiorespiratory Monitoring 45
in 49 of these studies. Since then there have been at least 24 publications (1 Level II,
9 Level III, 11 Level IV, and 3 of a hybrid Level IV system) with 29 studies (5 had
both simultaneous laboratory as well as home to laboratory studies). In what fol-
lows, the apnea/hypopnea index (AHI) per hour of sleep is designated as AHI for
PSG and the respiratory disturbance index (RDI) per hour of recording or equivalent
is designated as RDI for portable monitors unless otherwise indicated.
Many studies, particularly Level IV, required different thresholds for AHI
and/or RDI to achieve the highest possible sensitivity and specificity pairs (best
sensitivity and sensitivity). This left many patients with a nondiagnostic RDI, which
would require a subsequent evaluation including potentially an attended PSG.
Despite the use of best values, many studies failed to achieve an acceptable pair for
diagnostic purposes. This was defined in the Joint Review as a likelihood ratio (LR)
pair of ≥ 5 to increase post-test probability (i.e., increasing the positive predictive
value) of OSA with a positive test and ≤ 0.2 to decrease post-test probability (i.e.,
increasing the negative predictive value) with a negative test. These LR values
indicate a modest improvement in diagnostic accuracy (22) over no test at all. The
reader is referred to Reference (18) for a more detailed discussion of LRs.
The Joint Review classified evidence based on the following grades:
1. Blinded comparison, consecutive patients, reference standard (i.e., PSG) performed
on all patients;
2. Blinded comparison, nonconsecutive patients, reference standard performed on
all patients;
3. Blinded comparison, consecutive patients, reference standard not performed on
all patients;
4. Reference standard was not applied blindly or independently.
The definition of hypopnea and the threshold AHI to define OSA varied from
study-to-study but was consistent within each study. That is, the evidence can be used
to determine the performance of portable monitors compared to PSG but cannot easily
be used to define what is an acceptable AHI or RDI to identify OSA across all studies.
There were a total of three papers on Level II monitors of evidence grades II, IV
and IV (23–25). In addition, there is one study published since the Joint Review of
grade II evidence (26). The study suggests that similar data can be obtained from home
compared to a telemetry monitored and partially attended in-hospital study but the
failure rate of home monitoring was unacceptably high at 23.4%. In addition, the
tele metry-monitored studies had an 11.2% failure rate. Of 99 subjects, evaluable data
were available in 65 for both nights. Using the telemetry-monitored studies as the
reference standard, the sensitivity and specificity were 94.9% and 80.8% with LRs of
4.95 and 0.063, respectively, for the 65 subjects (calculated from data presented in the
publication). The paucity of data does not allow one to reach any conclusion regarding
the utility of these systems in the diagnosis of OSA. In concept, Level II should be the
most accurate. In practice, as indicated by one of the publications (26), the complexity
of these systems makes patient setup and subsequent data loss a potential problem.
Of nine studies of a Level III monitor done simultaneously attended in the
sleep laboratory nine had an acceptable LR pair from the Joint Review (18). Only
one of the studies had a group of nondiagnostic RDIs (36%). Of four studies
comparing home to laboratory, two had an acceptable LR pair with 22% and 37%
nondiagnostic RDIs. Data loss, when reported, was under 10% for those with an
acceptable LR pair.
Table 2 summarizes the data for simultaneously attended Level III monitors
(20,27–40), which includes the nine simultaneous studies (28–36) from the Joint
46 Littner
TABLE 2 Studies of Level III Portable Monitors Simultaneous with In-Laboratory Tests
Study AHI RDI Prev (%) Sens Spec LR(H) LR(L) Non (%) PPV NPV Evid Comment
28 10 6 24 89 92 11.1 0.12 0 78 96 II Red in airflow plus 3% red in sat or an arousal used
to determine AHI. Red in airflow plus 3% red in
sat used to determine RDI.
29 15 15 50 86 95 17 0.15 0 94 87 IV Red in airflow plus 4% red in sat or an arousal used
to determine AHI.
30 5 5 62 95 96 24 0.05 0 98 92 I Red in airflow used to determine AHI and RDI.
Compressed time frame for scoring RDI but not
AHI.
31 10 10 57 97 100
a
0.03 0 100 96 II Red in thoracoabdominal movement of 50% plus
4% red in sat for AHI. Discernable red in airflow
plus 4% red in sat for RDI.
32 15 15 27 86 95 17 0.15 0 86 95 II Red in airflow used to determine AHI and RDI.
33 10 10 84 95 100
a
0.05 0 100 80 II Red in airflow plus 4% red in sat or 2% red in sat
plus arousal for AHI. Red in airflow plus 2% red
in sat for RDI.
34 10 10 47 92 96 25 0.08 0 93 95 I Red in airflow used to determine AHI and RDI.
35 10
for
sens,
20
for
spec
10
for
sens,
20
for spec
63.3
for sens,
43.3
for spec
100
(64
corr
spec)
88
(77 corr
sens)
6.5 0 36 83 100 II Red in airflow plus 4% red in sat (Denver) or 2%
red in sat (Los Angeles) or arousal for AHI and
RDI. Arousals were measured indirectly
with PM. Compressed time frame
for scoring RDI but not AHI.
36 10 10 66 100 100
a
0 0 100 100 I Red in airflow used to determine AHI and RDI.
Sleep stages not used for either PSG or PM.
20 (new
study)
15 15 48 (est) 95 91 10.6 0.06 0 91 96 I Red in airflow and 2% desaturations with automatic
scoring for AHI and RDI. 12% data loss for PM.
37 (new
study)
15 10
for
sens,
20
for spec
62 100 (corr
spec
67)
93 (corr
sens 88)
12.6 0 18 95 100 II RDI red in thoracoabdominal movement and red in
nasal pressure. AHI red in thoracoabdominal
movement for hypopneas. 3% data loss.
Polysomnography and Cardiorespiratory Monitoring 47
27 (new
study)
5 levels
(5, 10,
15, 20,
30)
6.7
for
sens,
27.6
for spec
86
for AHI 5
(RDI 6.7),
44 for
AHI 30
(RDI
27.6)
97.1 (corr
spec
90.9)
90.9 (corr
sens
88.6)
7.97 0.0319 41 98.5 90.9 IV Automatic scoring had unacceptable results. PSG
scoring used arousals. Data loss under 10%.
Evidence grade IV since blinding of scoring not
reported.
38 (new
study)
?5
for
sens,
10
for
spec
5
for
sens,
10
for spec
?86
for sens,
84
for spec
100 (corr
spec
71.4)
100 (corr
sens,
95.2 or
92.9,
unclear
from
paper)
a
0 12
based
on text
of
results
100 100 I Scoring same for apneas and hypopneas for PSG
and PM without arousals. No prevalence data for
AHI ≥ 5. Oximetry sampling rates not given.
Time in bed used for PM RDI was 35% longer
than total sleep time used for AHI.
39 (new
study)
10 10 38.6 79.3 97.8 36 0.212 0 95.8 88.2 II AHI of 10 gives best pair of NPV and PPV. Patients
with heart failure. Arousals included in AHI for
PSG. Oximeter sampling rate of five seconds on
PM and PSG.
40 (new
study)
5 for
sens,
15 for
spec
5 for sens,
15 for
spec
83.3 for
sens,
51.6 for
spec
98 (corr
spec
40)
75.9 (corr
sens
83.9)
3.48 0.05 32 78.8 80 I Scoring same for apneas and hypopneas for PSG
and PM without arousals. Oximeter sampling
rate not disclosed. AHI of five gave best PPV
(89.1%) due to high prevalence although high
LR was minimally increased at 1.63.
Note: Data obtained with portable monitor simultaneous with polysomnography. Apnea/hypopnea index per hour of sleep with polysomnography. Respiratory disturbance index,
apnea/hypopnea index per hour of recording unless otherwise indicated for portable monitor.
a
Cannot be calculated due to division by 0.
Abbreviations: AHI, apnea/hypopnea index; corr, corresponding sensitivity or specificity when best sensitivity and specificity at different RDI or AHI thresholds (when this occurs,
there are a number of nondiagnostic tests); est, estimate; Evid, evidence grade; H, high; LR, likelihood ratio; L, low; NPV, negative predictive value = true negatives/true negatives
plus false negatives (%); Non (%), percent of nondiagnostic tests; PM, portable monitor; PSG, attended polysomnography; Prev (%), prevalence in percent; PPV, positive predic-
tive value = true positives/true positives plus false positives (%); red, reduction; RDI, respiratory disturbance index; Sens, sensitivity (%); Spec, specificity (%); sat, arterial oxygen
desaturation.
48 Littner
Review (18). In addition, Table 2 includes six studies not yet published at the time the
Joint Review was closed (20,27,37–40). All but one had acceptable LRs and the stud-
ies had a spectrum of grades I, II and IV evidence. In the new studies, there were
12%, 18%, 32%, and 41% nondiagnostic studies, and 12% data loss in one study.
Table 3 summarizes data for home to laboratory Level III monitors (20,35,37,
41–44) including four home to laboratory studies from the Joint Review (18). Table
3 includes two studies (20,37) not yet published at the time that the Joint Review
was closed. These two studies had acceptable LRs but data loss was 14% and 18%
and one had 36% nondiagnostic studies. In addition, there is an unpublished Level
III study in manuscript form available on the Internet (44). The LRs were acceptable
at AHI thresholds of five and 15.
Of 25 studies of a Level IV monitor done simultaneously in the sleep labora-
tory, 14 had an acceptable LR pair (18). Nine of the 14 studies had nondiagnostic
RDIs ranging from 11% to 67%. Of eight studies comparing home to laboratory, one
had an acceptable LR pair with 49% nondiagnostic RDIs. Data loss, when reported,
was under 10% for those with an acceptable LR pair.
Since the Joint Review, at least 11 Level IV monitor publications with 12
studies have been published (45–55), six simultaneous, one on different nights for
oximetry and PSG in the laboratory, and five home to laboratory. The results of
these 12 studies had a spectrum of sensitivities and specificities with PSG. One
simultaneous laboratory study (46) using a fast Fourier analysis of the spectrum
of the heart rate and saturation from the pulse oximeter had acceptable LRs and,
if reproducible in a home to laboratory study, may show promise. Another pro-
spective study using oximetry simultaneous with PSG had acceptable LRs for
severe sleep apnea (AHI ≥ 30). The low prevalence (4.7%) led to an excellent nega-
tive predictive value (99%) with an LR of 0.122 but an unacceptable positive pre-
dictive value (estimated from the publication at about 50%) despite an LR estimated
at 16 (53). On the other hand, in one study (49), 40% of patients with a normal
home oximetry had significant OSA (AHI > 15) on PSG. However, this study used
a 12-second oximeter recording setting, which has been documented to substan-
tially underestimate the number of arterial oxygen desaturations (56–58). In
another Level IV home to laboratory study, of 31 subjects using a system that
records oronasal sound and airflow, eight normal PSG studies were classified as
positive by portable monitor, and one classified as moderate and one as severe on
PSG were normal on the portable study (55).
There is at least one system that uses an alternative technology. This monitor
is a hybrid with an oximeter, an actigraph, and a measurement of radial artery pulse
volume. The studies to date on this monitor show promise (59–61) and one validation
study comparing both in-laboratory and home monitoring with sensitivity and
specificity at specific thresholds is available (61). The LRs in this study are accept-
able at several AHI thresholds but it is unclear if this is a consistent finding
(Tables 4 and 5).
To reiterate, almost all attended Level III portable monitors have acceptable
high and low LRs making them potentially useful to diagnose OSA. However, the
number of nondiagnostic studies and the inherent insensitivity to measure subtle
hypopneas requires careful follow-up and, usually, a PSG to fully evaluate the
patient with a negative or nondiagnostic study. Level II and IV portable monitors do
not appear to have sufficient diagnostic accuracy and/or reliability to be recom-
mended for the diagnosis of OSA.
Polysomnography and Cardiorespiratory Monitoring 49
TABLE 3 Studies of Level III Portable Monitors Home to Laboratory Tests
Study AHI RDI Prev (%) Sens Spec LR(H) LR(L) Non (%) PPV NPV Evid Comment
35 10
for sens,
20
for spec
10
for sens,
20
for spec
61.4
for sens,
41.4
for spec
91 (corr
spec
70.4)
82.9 (corr
sens 86)
5.1 0.13 22 78 83 II Red in airflow plus 4% red in sat (Denver) or
2% red in sat (Los Angeles) or arousal for
AHI and RDI. Arousals were measured
indirectly with PM. Compressed time
frame for scoring RDI but not AHI.
41 10 10 74 100 66 2.9 0 0 89 100 IV Red in airflow for AHI and RDI. Two min
epochs used for PM.
42 15 10
for sens,
20
for spec
55 94 (corr
spec
35)
89 (corr
sens 38)
3.26 0.179 55 64 54 IV Red in thoracoabdominal movement of AHI.
Red in chest movement for RDI. Only
patients with RDI < 30 included in analysis.
43 10 8
for sens,
23
for spec
84 95 (corr
spec
33)
93 (corr
sens 63)
9 0.15 37 98 55 II Red in airflow or thoracoabdominal paradox
with an arousal or cyclical red in sat for
AHI. Same with cyclical 2% red in sat and
no arousals criteria. One month between
studies.
20 (new
study)
15 15 48 (est) 91 83 5.35 0.11 0 83 91 I Red in airflow and 2% desaturations with
automatic scoring for AHI and RDI. 14%
data loss for PM. 91% split-night studies
in sleep laboratory, up to three nights
averaged for home.
37 (new
study)
15 10
for sens,
20
for spec
76 100 (corr
spec
75)
100 (corr
sens 61)
a
0 36 100 100 I RDI and AHI red in thoracoabdominal
movement. Manual scoring better than
automatic. 18% data loss for PM.
44 (new
study)
5
15
5
15
80
70
100
86
100
100
a
a
0
0.14
0
0
100
100
100
75
IV Not obviously blinded. Automatic scoring
with review for the portable device.
Patient selection not well described.
Note: Laboratory, data obtained from polysomnography; Home, data obtained with portable monitor unattended in the home; Apnea/hypopnea index per hour of sleep with PSG;
Respiratory disturbance index, apnea/hypopnea index per hour of recording unless otherwise indicated for portable monitor.
a
Cannot be calculated due to division by 0.
Abbreviations: AHI, apnea/hypopnea index; corr, corresponding sensitivity or specificity when best sensitivity and specificity at different RDI or AHI thresholds (when this occurs, there
are a number of nondiagnostic tests); est, estimate; Evid, evidence grade; H, high; LR, likelihood ratio; L, low; Non (%), percent of nondiagnostic tests; NPV, negative predictive value
= true negatives/true negatives plus false negatives; PM, portable monitor; PSG, attended polysomnography; Prev (%), prevalence in percent; PPV, positive predictive value = true
positives/true positives plus false positives; RDI, respiratory disturbance index; red, reduction; sat, arterial oxygen desaturation; Sens, sensitivity (%); Spec, specificity (%).
50 Littner
TABLE 4 Peripheral Arterial Tonometry Simultaneous with Polysomnography in the Laboratory
Study AHI RDI Prev (%) Sens Spec LR(H) LR(L) Non (%) PPV NPV Evid Comment
61 (Chicago
criteria for
AHI)
5 5 100 100 100
aa
0 100 100 I High prevalence makes
generalization difficult.
Oximeter sampling rates
identical between PSG and
PM with a sampling rate of
one second.
61 (Medicare
criteria for
AHI)
10 9.5 48 100 100
aa
0 100 100 I RDI was oxygen desaturation
index for PAT (i.e., functioned
as an oximeter). Oximeter
sampling rates identical
between PSG and PM with a
sampling rate of one second.
59 15
for sens
30
for spec
NA 50%
for 15
20%
for 30
93.3
(corr
spec
73.3)
91.7
(corr
sens
83.3)
3.49 0.1 30 77.8 95.6 II Oximeter sampling rates not
disclosed. Oximeter model on
PM not disclosed. PSG
hypopneas included arousals.
60 20
10
20
10
NA 85 (est)
75 (est)
82 (est)
82 (est)
4.72
4.17
0.183
0.305
NA NA NA II Oximeter sampling rates not
disclosed. Oximeter model on
PM not disclosed. PSG
hypopneas included arousals.
Sensitivity and specificity
estimated from receiver
operating characteristic (ROC)
curves.
Note: Data obtained with portable monitor simultaneous with polysomnography; Chicago, apnea/hypopnea index (AHI) and respiratory disturbance index (RDI) calculated from
criteria proposed in Reference (16); Medicare, AHI and RDI calculated from criteria required by Medicare (17); AHI per hour of sleep with polysomnography; RDI, AHI per hour of
recording unless otherwise indicated for portable monitor.
a
Cannot be calculated due to division by 0.
Abbreviations: corr, corresponding sensitivity or specificity when best sensitivity and specificity at different RDI or AHI thresholds (when this occurs, there are a number of nondiag-
nostic tests); est, estimated from receiver operating characteristic (ROC) curves; Evid, evidence grade; H, high; LR, likelihood ratio; L, low; NA, not available; Non (%), percent
of nondiagnostic tests; NPV, negative predictive value = true negatives/true negatives plus false negatives; PAT, peripheral arterial tonometry; PSG, attended polysomnography;
PM, portable monitor; Prev (%), prevalence in percent; PPV, positive predictive value = true positives/true positives plus false positives; red, reduction; Sens, sensitivity (%); Spec,
specificity (%).
Polysomnography and Cardiorespiratory Monitoring 51
TABLE 5 Peripheral Arterial Tonometry Laboratory Vs. Home
Study AHI RDI Prev (%) Sens Spec LR(H) LR(L) Non (%) PPV NPV Evid Comment
b,c
61 (Chicago criteria for
AHI)
5 5 100 100 100
aa
0 100 100 I
61 (Medicare criteria for
AHI)
5 4.7 55 100 100
aa
0 100 100 I
Note: Laboratory, data obtained from polysomnography; Home, data obtained with portable monitor unattended in the home; Chicago, apnea/hypopnea index (AHI) and respiratory
disturbance index (RDI) calculated from criteria proposed in Reference (16); Medicare, AHI and RDI calculated from criteria required by Medicare (17); AHI per hour of sleep with
polysomnography; RDI and AHI per hour of recording unless otherwise indicated for portable monitor.
a
Cannot be calculated due to division by 0.
b
High prevalence (100%) makes generalization difficult. Oximeter sampling rates identical between PSG and PM with a sampling rate of one second.
c
RDI was oxygen desaturation index for PAT (i.e., essentially functioned as an oximeter). Oximeter sampling rates identical between PSG and PM with a sampling rate of one
second.
Abbreviations: Evid, evidence grade; H, high; L, low; LR, likelihood ratio; Non (%), percent of nondiagnostic tests; NPV, negative predictive value = true negatives/true negatives
plus false negatives; PAT, peripheral arterial tonometry; PSG, attended polysomnography; PM, portable monitor; Prev (%), prevalence in percent; PPV, positive predictive value =
true positives/true positives plus false positives; Sens, sensitivity (%); Spec, specificity (%).
52 Littner
WHAT ARE LIMITATIONS OF POLYSOMNOGRAPHY
AS A REFERENCE STANDARD?
There are limitations to PSG implementation and interpretation. Sleep staging is
reasonably well-standardized according to published rules (62) but these were
developed before OSA was well-recognized. For example, arousals were not
well-defined (62) and while there are subsequent published recommendations (14),
there are no universally accepted or easily reproducible definitions, making inter-
scorer reliability potentially poor between clinical centers.
Scoring of hypopneas is in evolution. Although research definitions have been
proposed (13), the correlation between these definitions and clinical outcomes is
essentially unknown at this time. This leads to difficulty in determining a threshold
AHI to confirm OSA.
Night-to-night variability of the AHI or RDI can be substantial and is due to a
number of factors, including body position and the amount of REM sleep (supine
and REM AHIs are almost always higher than non-rapid eye movement [NREM]
and lateral position AHIs). Although the mean AHI in a group of OSA patients
does not change substantially, individual patients may have large increases or
decreases (19). For this reason, more than one night of PSG may be necessary to
clarify whether a patient has OSA. This variability also makes it difficult to know
how much of the difference between a portable monitor and PSG result is normal
variability and how much is from the limited set of monitored variables attended or
unattended during sleep.
The use of a single AHI to characterize the entire night’s study is simplistic.
For example, the classification of OSA by overall AHI does not take into account a
number of variables that may well have clinical relevance such as supine and REM
AHIs and the degree of arterial oxygen desaturation.
SLEEP STAGING
Portable monitors do not generally provide a measure of REM sleep and many do
not provide body position. This makes it difficult to fully characterize the RDI result.
For example, a patient who snores and has severe daytime sleepiness may sleep
mostly in stages 2 to 4 of NREM sleep and have a RDI of four on one night but have
normal REM on a second night with a RDI of 15. Most portable monitors do not
have sleep staging and the interpretation of these two RDIs would be difficult.
On the other hand, a PSG with sleep stages would provide important information
in the interpretation of the study. In particular, an AHI of four in the first case
would potentially prompt a second baseline study but in the case of the portable
monitor it might be interpreted as nonsignificant and the patient may not be
properly evaluated.
WHAT IS THE APPROPRIATE APNEA-HYPOPNEA INDEX DEFINITION
OF OBSTRUCTIVE SLEEP APNEA BY PORTABLE MONITORING?
Historically, hypopneas (decreased airflow) have been used to characterize OSA
and studies have suggested that hypopneas may have the same clinical significance
as apneas in many patients (63). However, the standard method of measuring air-
flow with a thermistor may leave many hypopneas unrecognized by this technique
(13). In addition, partial upper airway obstruction that leads to increased amplitude
Polysomnography and Cardiorespiratory Monitoring 53
of intrathoracic pressure can trigger an arousal (i.e., a RERA) and such arousals may
produce daytime sleepiness (13,64).
Methods to capture more subtle hypopneas and measure airflow more
quantitatively have become available. These currently focus around nasal pressure
measurement which is an indirect measure of airflow and more sensitive than
thermis tors (13). Nasal pressure has been favorably compared against pneumotach-
ograph airflow in OSA and appears more accurate than thermistor airflow (65,66).
In addition, the use of an esophageal balloon or tube to measure intrathoracic pres-
sure swings is recommended to determine the presence of RERAs (13).
Based on this newer technology, definitions of hypopnea and respiratory
events for research purposes have been proposed including syndrome definition
using a composite AHI ≥ 5 for confirmation of OSA (13). However, almost all previous
OSA studies used thermistors and none of the new definitions have been adequately
validated against thermistors in patients with OSA or against non-OSA controls.
Given the newer, more sensitive technology to detect respiratory events, it is possible,
even likely, that a diagnostic AHI will be much higher than previously observed and
many individuals who were considered with a combination of clinical evaluation
and PSG results not to have OSA will now have an AHI in the OSA range of at least
five and possibly much higher.
PSG is potentially capable of capturing all of the currently recommended
respiratory events whereas portable monitors, in general, capture only disturbances
in airflow and saturation leading to a RDI that frequently underestimates the
number of potential respiratory disturbances during sleep (i.e., apneas, hypopneas,
desaturations, arousals, and RERAs). Depending on the technology and definitions
used, RDI may vary considerably on the same night in the same patient.
To confuse the matter further, Medicare as mentioned, has published criteria
for scoring hypopneas on PSG for purposes of qualifying for CPAP (21). These
require a ≥ 30% decrease in airflow associated with a 4% desaturation from baseline
during recorded sleep ≥ 2 hours duration. The PSG must be performed in a facility-
based sleep study laboratory and not in the home or in a mobile facility. Without the
sleep requirement, it is likely that a portable monitor could more readily replicate
this definition. Of note, several Local Medical Review Policies (LMRP) may have
substituted recording time for sleep time (e.g., ).
Medicare criteria require an AHI of at least five patients with symptoms of OSA
such as daytime sleepiness or an AHI of 15, irrespective of symptoms.
The user of a portable monitor should be aware of the operating characteristics
of the monitor and not rely on computer-generated scoring. In addition, since the
portable monitor does not measure a number of events that may be recorded on the
PSG and does not usually measure sleep and may not measure position, a negative
study should not be accepted to exclude a diagnosis of OSA. On the other hand,
since the portable monitor is generally less sensitive than the PSG, a positive study
with a properly validated monitor, if technically adequate, should generally be
accepted as confirmatory in the appropriate clinical setting.
WHAT ARE DIFFERENTIAL DIAGNOSTIC CONSIDERATIONS?
Patients with Cheyne-Stokes respiration may mimic OSA but with a combination of
airflow, respiratory movement, and saturation measurements; this should be apparent
on a portable monitor. Patients with chronic obstructive pulmonary disease (COPD)
may have periods of desaturation that typically occur during REM sleep (67). Since
54 Littner
the portable monitor does not measure REM sleep, studies in patients with severe
COPD should be avoided if attempting to diagnose OSA.
As mentioned, daytime sleepiness can occur in sleep disorders other than
OSA (2). The typical Level III portable monitor is of little use in these cases and
patients with daytime sleepiness and a negative portable monitor study should
have the cause of the daytime sleepiness characterized. This will often require a PSG
and possibly a multiple sleep latency test, which requires measurement of sleep
staging (2,68).
TECHNICAL CONSIDERATIONS
The type of sensors may impact the results. For example, use of a thermistor is
excellent for detection of apneas but relatively insensitive for detection of modest
reductions in airflow (13). Thoracoabdominal movement by inductance plethys-
mography appears more sensitive for detection of hypopneas but the belts may lose
calibration or shift during the study. Nasal pressure appears to be very sensitive to
reductions in airflow but data loss may be a problem due to loss of signal or mouth
breathing (13).
Several studies have documented that the method of sampling the saturation
signal with an oximeter is important in accurately measuring reductions in arterial
oxygen saturation (56–58). For example, an oximeter set at a three-second recording
rate produced almost twice as many 3% desaturations as a 12-second recording rate
(56). Furthermore, desaturations stored in oximeter memory substantially underes-
timate desaturations displayed in real time on-line at any recording rate (57).
The method of scoring, manual versus computer is also a consideration.
Without the ability to manually review data, results will always be suspect since
artifact may often mimic respiratory events. In general, computer scoring has been
less accurate than manual scoring but the time involved is considerably greater
with manual scoring (69). In addition, the ability to independently calibrate and test
the equipment is desirable to ensure that equipment failure is not producing
erroneous results.
WHAT CAN BE SUPPORTED BY THE EVIDENCE?
As discussed previously, based on the current evidence, an attended Level III
system with a minimum of airflow, oximetry, respiratory movement, and heart
rate can be recommended under certain conditions. Strongly recommended is an
additional sensor to measure body position. Also recommended is a sensor to
measure snoring.
The use of an attended Level III portable monitor to diagnose OSA would
appear from both evidential and strategic analyses to be more appropriate rather
than to exclude patients with OSA since:
1. A positive portable study, if properly performed in a patient with clinical features
of OSA, has a high degree of specificity and positive predictive value.
2. A negative or nondiagnostic portable study should be followed, usually with an
attended PSG, since the portable monitor study
a. is less likely to detect other evidence of OSA including RERAs and subtle
hypopneas and will not allow the determination of REM AHI;
b. will not diagnose other disorders contributing to the patient’s clinical
presentation such as periodic limb movement disorder.
Polysomnography and Cardiorespiratory Monitoring 55
Based on considerations similar to the above, the AASM/ATS/ACCP task
force guidelines (69) recommend that attended Level III studies are acceptable for
diagnosis with careful follow-up of negative studies including, in most cases, a PSG
for confirmation.
This review at this point has concentrated on the diagnosis of OSA without
considering that PSG is used to monitor CPAP titration during sleep. To date, there
appears to be only one study that examined a Level III portable monitoring mon-
tage to titrate CPAP during an attended study (70). In addition, the use of an attended
portable monitor to make a diagnosis during the first half of the night followed by
a CPAP titration during the second half of the night (split-night study) has not been
examined. For these reasons, use of a portable monitor to both diagnose and titrate
CPAP cannot be well-supported by evidence.
WHAT OTHER OPTIONS MAY BE CONSIDERED?
The evidence is lacking to support unattended use of a portable monitor in the
patient’s home as a stand-alone approach to diagnosis of OSA. However, in the
proper setting, with appropriate patient selection, and careful follow-up including
ready access to attended PSG, unattended Level III home portable studies are feasi-
ble. Based on an integration of the evidence available, the following conditions
would appear to be necessary:
1. A high pretest probability (i.e., a high prevalence of OSA in the patient
population), ideally to exceed 70%. There are a number of equations that use
readily available data such as BMI, sex, history of snoring, neck circumference,
and so on, or more complicated data such as X-rays of the upper airway with
cephalometric measurements (68,71–76).
2. The availability of attended PSG for patients with a strong clinical history and a
negative or nondiagnostic portable monitoring study.
3. The availability of treatment including PSG titration for CPAP.
4. An experienced sleep practitioner who is capable of evaluating both the clinical
and portable monitoring information.
The approach to CPAP titration is beyond the scope of this chapter; there has
been a trend to use auto-titrating positive airway pressure (APAP) machines unat-
tended in the patient’s home (see also Chapter 8). The reader is referred to an evi-
dence-based review of the topic and guidelines published by the AASM (77,78) and
a Canadian technology review (79), which indicate that unattended use for CPAP
titration is not established for CPAP naïve patients. Subsequent to publication of the
guidelines, at least one study has provided evidence that APAP can lead to favor-
able outcomes in CPAP naïve patients (80). In general, such an approach should
only be carried out with the knowledge that the evidence for the efficacy of unat-
tended home CPAP titration in CPAP naïve patients is in evolution.
COST EFFECTIVENESS
This is a complicated topic since the costs must be weighed against the accessibility
of patients to diagnostic studies. If there are sufficient resources to study all patients
who are identified as candidates, then the cost of the attended PSG, often a split-
night study, must be balanced against the cost of the portable study and the potential
need for a second study for CPAP treatment. The lower sensitivity of the portable
56 Littner
study for OSA, particularly if the research criteria (13) are used for comparison, and
the night-to-night variability of any test for OSA require careful evaluation of nega-
tive and nondiagnostic studies with strong consideration given to proceeding to a
subsequent attended PSG. In addition, local reimbursements are also an issue and
the Medicare rules essentially exclude portable monitoring attended or unattended
as an option for confirming a diagnosis of OSA.
If there are not sufficient resources, then unattended Level III portable monitor-
ing with the possibility of APAP becomes a potential option, recognizing all the limita-
tions of portable monitoring and the use of APAP machines to titrate and determine
treatment for patients.
Of note, the use of a Level III portable monitor attended in the laboratory is
another potential addition to the overall diagnostic strategy and at least one
analysis suggests that this may be more cost-effective than performing attended
PSGs on all patients (81).
Although a comprehensive answer cannot be given, the following, at a mini-
mum, should be assessed:
1. What is the cost of the PSG equipment, supplies, space, utilities, technician time,
physician time, etc?
2. What is the cost of portable monitoring equipment, supplies, time spent with
patient, interpretation time, etc?
3. What are the numbers of studies that are nondiagnostic and require follow-up
PSG?
4. What is the strategy for CPAP titration? Does it include an attended PSG, a
portable monitoring titration, an APAP, or some combination?
5. What are the acceptance and adherence with CPAP with any of the strategies?
6. What is an acceptable wait time for a test and if too long, how does this impact
the quality of life of the patients?
7. Based on the acceptable wait time, what are the resources necessary for each of
the possible strategies?
8. What is the patient population to be studied? What is the prevalence of OSA?
What is the likelihood that other diagnoses are present such as periodic limb
movement disorder or narcolepsy?
CONCLUSIONS
At the present time, the typical procedure for confirmation of the diagnosis of OSA
and its management is an in-laboratory PSG with application of CPAP. Portable
monitoring systems have arisen to increase access to the diagnosis of OSA and to
potentially reduce costs. A RDI ≥ 5 in adults is used to confirm OSA unless the patient
is asymptomatic, in which case a RDI ≥ 15 is used to confirm OSA. For children, one
or more apneas or hypopneas of at least two respiratory cycles in duration, or other
evidence of respiratory disturbance (i.e., RERAs, arterial oxygen desaturation, snor-
ing, hypercapnia, arousals) confirm OSA. Validation of a portable monitoring device
should involve the assessment of sensitivity and specificity of the OSA diagnosis
using the device under ideal conditions as well as in the intended environment
(typically the patient’s home) versus simultaneous comparison with attended PSG.
At the present time, Level II and IV portable monitors are not sufficiently accurate
or validated to recommend for use, particularly unattended in the home, while
Level III monitors are useful attended in the laboratory and of possible usefulness
Polysomnography and Cardiorespiratory Monitoring 57
unattended in either the laboratory or the home, with the proviso that careful follow-
up and usually a PSG is necessary to fully evaluate the patient with a negative or
nondiagnostic study. The role of PSG as a reference standard is limited given issues
such as the lack of standardized scoring of hypopneas and the night-to-night
variability of the AHI or RDI; however, features such as sleep stage, body position,
and all currently recommended respiratory event data are typically found in PSG
systems but are lacking in portable monitors. Complicating these issues is the fact
that current Medicare guidelines make it difficult for portable monitors to adhere to
Medicare criteria for OSA diagnostic devices, and portable monitors are not the best
choice for confirming the OSA diagnosis in patients with COPD or who have signif-
icant daytime sleepiness from causes other than OSA. The type of electrodes or sen-
sors, oximeter sampling rate, and manual versus computerized scoring are technical
factors that should be considered in the selection of the portable monitoring device.
The most appropriate use of an attended Level III portable monitor appears to be
the diagnosis of OSA rather than the exclusion of patients with OSA based on both
evidential and strategic analyses. Lastly, the cost effectiveness of portable monitor-
ing compared to in-laboratory PSG studies is a complex issue that at the present
time has not been resolved.
REFERENCES
1. Bassiri AG, Guilleminault C. Clinical features and evaluation of obstructive sleep apnea-
hypopnea syndrome. In: Kryger MH, Roth T, Dement WC eds, Principles and Practice
of Sleep Medicine 3rd ed. Philadelphia, PA: W.B. Saunders, 2000:869–878.
2. American Sleep Disorders Association. International classification of sleep disorders.
2nd ed. Diagnostic and Coding Manual. Westchester, Illinois: American Academy of
Sleep Medicine, 2005.
3. Young T, Palta M, Dempsey J, Skatrud J, Weber S, Badr S. The occurrence of sleep-
disordered breathing among middle-aged adults. N Engl J Med 1993; 328: 1230–1235.
4. Findley LJ, Unverzagt ME, Suratt PM. Automobile accidents involving patients with
obstructive sleep apnea. Am Rev Respir Dis 1988; 138:337–340.
5. Peppard PE, Young T, Palta M, Skatrud J. Prospective study of the association between
sleep-disordered breathing and hypertension. N Engl J Med 2000; 342:1378–1384.
6. Hung J, Whitford EG, Parsons RW, Hillman DR. Association of sleep apnoea with
myocardial infarction in men. Lancet 1990; 336:261–264.
7. Dyken ME, Somers VK, Yamada T, Ren ZY, Zimmerman MB. Investigating the relation-
ship between stroke and obstructive sleep apnea. Stroke 1996; 27:401–407.
8. Resta O, Foschino-Barbaro MP, Legari G, et al. Sleep-related breathing disorders, loud
snoring and excessive daytime sleepiness in obese subjects. Int J Obes Relat Metab Disord
2001; 25:669–675.
9. Hening WA, Allen RP, Earley CJ, Picchietti DL, Silber MH. Restless Legs Syndrome Task
Force of the Standards of Practice Committee of the American Academy of Sleep
Medicine. An update on the dopaminergic treatment of restless legs syndrome and
periodic limb movement disorder. Sleep 2004; 27(3):560–583.
10. Chervin RD, Murman DL, Malow BA, Totten V. Cost-utility of three approaches to the
diagnosis of sleep apnea: polysomnography, home testing, and empirical therapy. Ann
Intern Med 1999; 130:496–505.
11. Rama A, Tekwani S, Kushida C. Sites of obstruction in obstructive sleep apnea. Chest
2002; 122:1139–1147.
12. Leung RS, Bradley TD. Sleep apnea and cardiovascular disease. Am J Respir Crit Care
Med 2001; 164:2147–2165. PMID: 11751180.
13. American Academy of Sleep Medicine. Sleep-related breathing disorders in adults: rec-
ommendations for syndrome definition and measurement techniques in clinical research.
The Report of an American Academy of Sleep Medicine Task Force. Sleep 1999;
22:667–689.