1999 HVAC Applications Part 9 ppsx
Bạn đang xem bản rút gọn của tài liệu. Xem và tải ngay bản đầy đủ của tài liệu tại đây (437.51 KB, 31 trang )
33.16 1999 ASHRAE Applications Handbook (SI)
the on-peak period, the building load may be met by the chiller, the
storage, or a combination of both (Figure 15B). A downstream mod-
ulating valve maintains the chilled water supply to the building loop
at the desired temperature. If demand limiting is desired, the chiller
electrical demand must also be controlled. The remainder of the
load is met by the storage.
Storage Tank Insulation
Because of the low temperature associated with ice storage, insu-
lation is a high priority. In retrofit applications, the current insula-
tion must be evaluated to ensure there is no condensation or
excessive heat loss. All ice storage tanks located above ground
should be insulated to limit standby losses. For external melt ice-on-
coil systems and some internal melt ice-on-coil systems, the insula-
tion and vapor barrier are part of the factory-supplied containers;
most other storage tanks require that insulation and a vapor barrier
by applied in the field. Below-ground tanks used with ice harvesters
may not need insulation below the first metre. Because the tank tem-
perature does not drop below 0°C at any time, there is no danger of
freezing and thawing groundwater.
All below-ground tanks using fluids below 0°C during the
charge cycle should have a well designed and properly installed
insulation and vapor barrier, generally on the exterior. Interior insu-
lation is susceptible to damage from the ice and should be avoided.
Because a hydrated salt solution operates at chilled water tem-
peratures of about 8°C, the same insulation practices apply.
ELECTRICALLY CHARGED HEAT
STORAGE DEVICES
Thermal energy can also be stored in electrically-charged, ther-
mally-discharged storage devices. For devices that use a solid mass
as the storage medium, equipment size is typically specified by the
nominal power rating (to the nearest kilowatt) of the internal heating
elements. The nominal storage capacity is taken as the amount of
energy supplied during an 8 h charge period. For example, a 5 kW
heater would have a nominal storage capacity of 144 MJ (40 kWh).
ASHRAE Standard 94.2 describes methods for testing these devices.
If multiple charge/off-peak periods are available during a 24 h period,
an alternative method yields a more accurate estimate of equipment
size. The method considers not only the nominal power rating, but
also fan discharge rate and storage capacity. The equipment manu-
facturer should have more information on calculating capacity.
Room Storage Heaters (Room Units)
Room storage heaters (commonly called room units) have mag-
netite or magnesite brick cores encased in shallow metal cabinets
(Figure 16). The core can be heated to 760°C during off-peak hours
by resistance heating elements located throughout the cabinet.
Room units are generally small heaters that are placed into a partic-
ular area or room. These heaters have well-insulated storage cavi-
ties, which help retain the heat in the brick cavity. Even though the
brick inside the units get very hot, the outside of the heater is rela-
tively cool with surface temperatures generally below 80°C. Stor-
age heaters are discharged by natural convection, radiation, and
conduction (static heaters) or by a fan. The air flowing through the
core is mixed with room air to limit the outlet air temperature to a
comfortable range.
Storage capacities range from 49 to 216 MJ (13.5 to 60 kWh).
Inputs range from 0.8 to 9.0 kW. In the United States, 120 V, 208 V,
240 V, and 277 V units are commonly available. The 120 V model
is useful for heating smaller areas or in geographical areas with
moderate heating days. Room storage heaters are for residential,
motel, hotel, apartment, and office applications.
Operation is relatively simple. When a room thermostat calls for
heat, fans (on dynamic units) located in the lower section of the room
unit discharge air through the ceramic brick core and into the room.
Depending on the charge level of the brick core, a small amount of
radiant heat may also be delivered from the room unit. The amount
of heat stored in the brick core of the unit can be regulated either
manually or automatically in relation to the outside temperature.
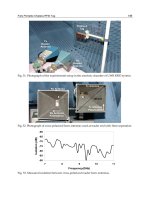
These units fully charge in about 7 h (Figure 17), and they can be
fully depleted in as little as 6 h. The equipment retains heat for up to
72 h (3 days) if it has no fan discharge (Figure 18).
Choosing the appropriate size of room unit(s) depends on control
strategy of the power company (on-peak versus off-peak hours),
outside design climate, and heat loss of the area or space. The man-
ufacturer of the equipment may provide assistance in determining
the heat loss for the area requiring heat. Based on the control strat-
egy of the power company, the following two concepts can be used
for sizing of the equipment:
Whole House Concept. Under this strategy, room units are
placed throughout the home. A room by room heat loss calculation
must be performed. This method is used in areas where the power
company has long hours of consecutive control (on-peak hours),
generally 10 h or more.
Fig. 15 Thermal Storage with Chiller Upstream
Fig. 16 Room Storage Heater
33.18 1999 ASHRAE Applications Handbook (SI)
Underfloor Heat Storage
This storage method typically uses electric resistance cables
buried in a bed of sand 300 to 900 mm below the floor of a build-
ing. It is suitable for single-story buildings, such as residences,
churches, offices, factories, and warehouses. An underfloor stor-
age heater acts as a flywheel; while it is charged only during the
nightly off-peak, it maintains the top of the floor slab at a constant
temperature slightly higher than the desired space temperature.
Because the cables spread heat in all directions, they do not have
to cover the entire slab area. For most buildings, a cable location
of 450 mm below the floor elevation is optimum. The sand bed
should be insulated along its perimeter with 50 mm of rigid,
closed-cell foam insulation to a depth of 1200 mm (see Figure 20).
Even with a well-designed and well-constructed underfloor stor-
age, 10% or more of the input heat may be lost to the ground.
BUILDING MASS
Building Mass Effects
The thermal storage capabilities inherent in building mass can
have a significant effect on the temperature within the space as well
as on the performance and operation of the HVAC system. Effective
use of structural mass for thermal storage reduces building energy
consumption and reduces and delays peak heating and cooling loads
(Braun 1990). In some cases, it improves comfort (Simmonds 1991;
Morris et al. 1994). Perhaps the best-known use of thermal mass to
reduce energy consumption is in buildings that include passive solar
techniques (Balcomb 1983).
Cooling energy can be reduced by precooling the structure at
night using ventilation air. Braun (1990), Ruud et al. (1990), and
Andresen and Brandemuehl (1992) suggested that mechanical pre-
cooling of a building can reduce and delay peak cooling demand;
Simmonds (1991) suggested that the correct building configuration
may even eliminate the need for a cooling plant. Mechanical pre-
cooling may require more energy use; however, the reduction in
electrical demand costs may give lower overall energy costs. More-
over, the installed capacity of air-conditioning equipment may also
be reduced, providing lower installation costs.
The effective use of thermal mass can be considered incidental
and be allowed for in the heating or cooling design, or it may be con-
sidered intentional and form an integral part of the design. The
effective use of building structural mass for thermal energy storage
depends on such factors as (1) the physical characteristics of the
structure, (2) the dynamic nature of the building loads, (3) the cou-
pling between the mass and zone air (Akbari et al. 1986), and (4) the
strategies for charging and discharging the stored thermal energy.
Some buildings, such as frame buildings with no interior mass, are
inappropriate for thermal storage. Many other physical characteris-
tics of a building or an individual zone, such as carpeting, ceiling
plenums, interior partitions, and furnishings, affect thermal storage
and the coupling of the building with zone air.
Incidental Thermal Mass Effects. A greater amount of ther-
mal energy must be removed or added to bring a room in a massive
building to a suitable condition before occupancy than for a simi-
lar light building. Therefore, the system must either start condi-
tioning the spaces earlier or operate at a greater output. During the
occupied period, a massive building requires a lower output, as a
higher proportion of heat gains or losses are absorbed by the ther-
mal mass.
Advantage can be taken of these effects if low-cost electrical
energy is available during the night; the air-conditioning system can
be operated during this period to precool the building. This can
reduce both the peak and total energy required during the following
day (Braun 1990; Andresen and Brandemuehl 1992) but may not
always be energy-efficient.
Intentional Thermal Mass Effects. To make best use of thermal
mass, the building should be designed with this objective in mind.
Intentional use of the thermal mass can be either passive or active.
Passive solar heating is a common application that applies the ther-
mal mass of the building to provide warmth outside the sunlit
period. This effect is discussed in further detail in Chapter 32. Pas-
sive cooling applies the same principles to limit the temperature rise
during the day. The spaces can be naturally ventilated overnight to
absorb surplus heat from the building mass. This technique works
well in moderate climates with a wide diurnal temperature swing
and low relative humidities, but it is limited by the lack of control
over the cooling rate.
Active systems overcome some of the disadvantages of passive
systems by using (1) mechanical power to help heat and cool the
building and (2) appropriate controls to limit the output during the
release or discharge period.
Systems
Both night ventilation and precooling have limitations. The
amount of heat stored in a slab equals the product of mass, specific
heat and temperature rise. The amount of heat available to the space
depends on the rate at which heat can be extracted from the slab,
which in simple terms is
(5)
where
q
s
= rate of heat flow from slab, kW
ρ =density, kg/m
3
c
p
= specific heat, kJ/(kg·K)
V = slab volume, m
3
θ = time, s
h
o
= heat transfer coefficient, W/(m
2
·K)
A = area of slab, m
2
t
s
= temperature of slab, °C
t = temperature of space, °C
Equation (5) also applies to transferring heat to the storage
medium; while the potential is equivalent to c
p
V(t
s
− t), the heat
released during the daytime period is related to the transfer coef-
ficients. Building transfer coefficients are quite low; for example, a
Fig. 20 Underfloor Heat Storage
q
s
ρc
p
V
θd
dt
s
h
o
At
s
t–()==
Thermal Storage 33.19
typical value for room surfaces is 8 W/(m
2
·K), which is the maxi-
mum amount of energy that can be released.
Effective Storage Capacity. The total heat capacity (THC)
(Ruud et al. 1990) is the maximum amount of thermal energy stored
or released due to a uniform change in temperature ∆t of the mate-
rial and is given by
(6)
The diurnal heat capacity (DHC) is a measure of the thermal
capacity of a building component exposed to periodically varying
temperature.
Many factors must be considered when an energy source is time-
dependent. The minimum temperature occurs around dawn, which
may be at the end of the off-peak tariff; the optimum charge period
may run into the working day. Beginning the charge earlier may be
less expensive but also less energy-efficient. In addition, the energy
stored in the building mass is neither isolated nor insulated, so some
energy is lost during charging; and the amount of available free
energy varies and must be balanced against the energy cost of
mechanical power. As a result, there is a trade-off that varies with
time between the amount of free energy that can be stored and the
power necessary for charging.
As the cooling capacity is, in effect, embedded in the building
thermal mass, conventional techniques of assessing the peak load
cannot be used. Detailed weather records that show peaks over 3- to
5-day periods, as well as data on either side of the peaks, should be
examined to ensure that (1) the temperature at which the building
fabric is assumed to be before the peak period is realistic and (2) the
consequences of running with an exhausted storage after peak are
considered. This level of analysis can only be carried out effectively
using a dynamic simulation program. Experience has shown that
these programs should be used with a degree of caution, and the
results should be compared with both experience and intuition.
Storage Charging and Discharging
The building mass can be charged (cooled or warmed) either
indirectly or directly. Indirect charging is usually accomplished by
heating or cooling either the bounded space or an adjacent void.
Almost all passive and some active cooling systems are charged by
cooling the space overnight (Arnold 1978). Most indirect active
systems charge the store by ventilating the void beneath a raised
floor (Herman 1980; Crane 1991). Where this is an intermediate
floor, cooling can be radiated into the space below and convected
from the floor void the following day. By varying the rate of venti-
lation through the floor void, the rate of discharge can be controlled.
Proprietary floor slabs are commonly of the hollow-core type
(Anderson et al. 1979; Willis and Wilkins 1993). The cores are con-
tinuous, but when used for thermal storage, they are plugged at each
end, and holes are drilled to provide the proper airflow. Charging is
carried out by circulating cool or warm air through the hollow cores
and exhausting it to the room. Discharge can be controlled by a
ducted switching unit that directs air through the slab or straight into
the space.
A directly charged slab, used commonly for heating and occa-
sionally for cooling, can be constructed with an embedded hydronic
coil. The temperature of the slab is only cycled 2 to 3 K to either side
of the daily mean temperature of the slab. Consequently the tech-
nique can use very low grade free cooling (approximately 19°C)
(Meierhans 1993) or low-grade heat rejected from condensers
(approximately 28°C). In cooling applications the slab is used as a
cool radiant ceiling, and for warming it is usually a heated floor. Lit-
tle control is necessary due to the small temperature differences and
the high heat capacity of the slab.
INSTALLATION, OPERATION,
AND MAINTENANCE
The design professional must consider that almost all thermal
storage systems require more space than nonstorage systems. Hav-
ing selected a system, the designer must decide on the physical
location; the piping interface to the air-conditioning equipment;
and the water treatment, control, and optimization strategies to
transfer theoretical benefits into realized benefits. The design must
also be documented, the operators trained, and the performance
verified (i.e., the system must be properly commissioned). Finally,
the system must be properly maintained over its projected service
life. For further information on operation and maintenance man-
agement, see Chapter 37.
SPECIAL REQUIREMENTS
The location and space required by a thermal storage system are
functions of the type of storage and the architecture of the building
and site. Building or site constraints often shift the selection from
one option to another.
Chilled Water Systems
Chilled water systems are associated with large volume. As a
result, many stratified chilled water storage systems are located out-
doors (such as in industrial plants or suburban campus locations). A
tall tank is desirable for stratification, but a buried tank may be
required for architectural or zoning reasons. Tanks are traditionally
constructed of steel or prestressed concrete. A supplier who
assumes full responsibility for the complete performance often con-
structs the tank at the site and installs the entire distribution system.
Ice-on-Coil Systems (External and Internal Melt)
Ice-on-coil systems are available in many configurations with
differing space and installation requirements. Because of the wide
variety available, these often best meet the unique requirements of
many types of buildings.
Bare coils are available for installation in concrete cells, which
are a part of the building structure. The bare steel coil concept can
be used with direct cooling, in which the refrigerant is circulated
through the coils, and the water is circulated over the coils to be
chilled or frozen. This external melt system has very stringent
installation requirements. Coil manufacturers do not normally
design or furnish the tank, but they do provide design assistance,
which covers distribution and air agitation design as well as side and
end clearance requirements. These recommendations must be fol-
lowed exactly to ensure success.
The bare coil concept can also be used with a secondary coolant
to provide the cooling necessary to build the ice. In an internal melt
configuration, the ice and water, which remains in the tank and is
not circulated to the cooling system, cools the secondary coolant
during discharge. This indirect chilling can also be used with an
external melt discharge if it is not desirable to circulate the second-
ary coolant to the cooling load. Indirect chilling can use either steel
or plastic tubes in the ice builder.
Coils with factory-furnished containers come in a variety of sizes
and shapes. A suitable style can usually be found to fit the available
space. Round plastic containers with plastic coils are available in
several sizes. These are offered only in an internal melt configura-
tion and can be above ground or partially or completely buried.
Rectangular steel tanks are available with both steel and plastic
pipe in a wide variety of sizes and capacities. Steel coil modules
have the option of either internal or external melt. These steel tank
systems are not normally buried. Each system comes prepackaged;
installation requires only placement of the tank and proper piping
connections. Any special support or insulation requirements of the
manufacturer must be strictly followed.
THC ρc
p
V∆t=
33.20 1999 ASHRAE Applications Handbook (SI)
Encapsulated Ice
Cylindrical steel containers with encapsulated water modules
are also available. These offer yet another shape to fit available
space. With proper precautions, these containers can be installed
below grade. Standards and recommendations for corrosion pro-
tection published by the Steel Pipe Institute and the National
Association of Corrosion Engineers should be followed, as should
the manufacturer’s instructions. These systems are not shipped
assembled. The containers must be placed in the shell at the job
site in a way that channels the secondary coolant through passages
where the desired heat transfer will be achieved.
Ice-Harvesting
Field-built concrete ice tanks are generally used with ice harvest-
ing. The ice harvester manufacturer may furnish assistance in tank
design and piping distribution in the tank. The tank may be com-
pletely or partially buried or installed above ground. Where the
ground is dry and free of moving water, tanks have been buried
without insulation. In this situation the ground temperature eventu-
ally stabilizes, and the heat loss becomes minimal. However, a min-
imum of 50 mm of closed cell insulation should be applied to the
external surface. Because the shifting ice creates strong dynamic
forces, internal insulation should not be used except on the under-
side of the tank cover. In fact, only very rugged components should
be placed in the tank; exit water distribution headers should be of
stainless steel or rugged plastic suitable for the cold temperatures
encountered. PVC is not an acceptable material due to its extreme
brittleness at the ice water temperature. An underfloor system that is
a part of the concrete structure is preferred.
As with the chilled water and hydrated salt PCM tanks, close
attention to the design and construction is critical to prevent leak-
age. Unlike a system where the manufacturer builds the tank and
assumes responsibility for its integrity, an ice-harvesting system
needs an on-site engineer familiar with concrete construction
requirements to monitor each pour and to check all water stops and
pipe seals. Unlined tanks that do not leak can be built. If liners are
used, the ice equipment suppliers will provide assistance in deter-
mining a suitable type; the liner should be installed only by a qual-
ified installer trained in the proper methods of installation by the
liner maker.
The sizing and location of the ice openings is critical; the tank
design engineer should check all framed openings against the certi-
fied drawings before the concrete is poured.
An ice harvester is generally installed by setting in place a pre-
packaged unit that includes the ice-making surface, the refrigerant
piping, the refrigeration equipment, and, in some cases, the heat
rejection equipment and the prewired control. To ensure proper ice
harvest, the unit must be properly positioned with respect to the
drop opening. As the internal piping is not normally insulated, the
drop opening should extend under the piping so that condensate
drops into the tank. A grating below the piping is desirable. To pre-
vent air or water leakage, gasketing between the unit frame and
caulking must be installed in accordance with the manufacturer’s
instructions. External piping and power and control wiring com-
plete the installation.
Other PCM Systems
Coolant normally flows horizontally in salt and polymeric sys-
tems, so the tanks tend to be shallower than the ideal chilled water
storage tank. As in chilled water systems, the chilled water supply to
and return from the tank must be designed to distribute water uni-
formly through the tank without channeling. Tanks are traditionally
of concrete. The system supplier normally designs the tank and its
distribution system, builds the tank, and installs the salt solution
containers.
SYSTEM INTERFACE
Open Systems
Chilled water; salt and polymeric PCMs; external melt ice-
on-coil; and ice-harvesting systems are all open chilled water piping
systems. Drain-down must be prevented by isolation valves, pres-
sure-sustaining valves, or heat exchangers. Due to the potential for
drain-down, the open nature of the system, and the fact that the
water being pumped may be saturated with air, the construction con-
tractor must follow the piping details carefully to prevent pumping
or piping problems.
Closed Systems
Closed systems normally circulate an aqueous secondary coolant
(25 to 30% glycol solution) either directly to the cooling coils or to
a heat exchanger interface to the chilled water system. A domestic
water makeup system should not be the automatic makeup to the
secondary coolant system. An automatic makeup unit that pumps a
premixed solution into the system is recommended, along with an
alarm signal to the building automation system to indicate makeup
operation. The secondary coolant must be an industrial solution (not
automotive antifreeze) with inhibitors to protect the steel and cop-
per found in the piping. The water should be deionized; as portable
deionizers can be rented, the solution can be mixed on-site. A cal-
culation, backed up by metering the water as it is charged into the
piping system for flushing, is needed to determine the specified con-
centration. Premixed coolant made with deionized water is also
available, and tank truck delivery with direct pumping into the sys-
tem is recommended on large systems. An accurate estimate of vol-
ume is required.
INSULATION
Because the chilled water, secondary coolant, or refrigerant tem-
peratures are generally 6 to 11 K below those found in nonstorage
systems, special care must be taken to prevent damage. Although
fiberglass or other open-cell insulation is theoretically suitable
when supplied with an adequate vapor barrier, experience has
shown that its success is highly dependent upon workmanship.
Therefore, a two-layer closed-cell material with staggered joints
and carefully sealed joints is recommended. A thickness of 40 to 50
mm is normally adequate to prevent condensation in a normal room.
Provisions must be made to ensure that the relative humidity in the
equipment room is less than 80%. This can be done with heating or
with cooling and dehumidification.
Special attention must be paid to pump and heat exchanger insu-
lation covers. Valve stem, gage, and thermometer penetrations and
extensions should be carefully sealed and insulated to prevent con-
densation. PVC covers over all insulation in the mechanical room
improve appearance, provide limited protection, and are easily re-
placed if damaged. Insulation located outdoors should be protected
by an aluminum jacket.
REFRIGERATION EQUIPMENT
The refrigeration system may be packaged chillers, field-built
refrigeration, or refrigeration equipment furnished as a part of a
package. The refrigeration system must be installed in accordance
with the manufacturer’s recommendations. Due to the high cost of
refrigerant, refrigerant vapor detectors are suggested even for Class
A1 refrigerants. Equipment rooms must be designed and installed to
meet ASHRAE Standard 15. Relief valve lines should be monitored
to detect valve weeping; any condensate that collects in the relief
lines must be diverted and trapped so that it does not flow to the
relief valve and eventually damage the seat.
Thermal Storage 33.21
WATER TREATMENT
Open Systems
Water treatment must be given close scrutiny in open systems.
While the evaporation and concentration of solids associated with
cooling towers does not occur, the water may be saturated with air,
so the corrosion potential is greater than in a closed system. Treat-
ment against algae, scale, and corrosion must be provided. No
matter what type of treatment is chosen (i.e., traditional chemical
or nontraditional treatment), some type of filtration that is effec-
tive at least down to 24 µm should be provided. To prevent dam-
age, water treatment must be operational immediately following
the completion of the cleaning procedure. Corrosion coupon
assemblies should be included to monitor the effectiveness of the
treatment. Water testing and service should be performed at least
once a month by the water treatment supplier.
Closed Systems
The secondary coolant should be pretreated by the supplier. A
complete analysis should be done annually. Monthly checks on the
solution concentration should be made using a refractive indicator.
Automotive-type testers are not suitable. For normal use, the solu-
tion should be good for many years without needing new inhibitors.
However, provision should be made for the injection of new inhib-
itors through a shot feeder if recommended by the manufacturer.
The need for filtering, whether it be the inclusion of a filtering sys-
tem or filtering the water or solution before it enters the system,
should be carefully considered. Combination filter feeders and cor-
rosion coupon assemblies may be needed for monitoring the effect
of the solution on copper and steel.
CONTROLS
A direct digital control to monitor and control all of the equip-
ment associated with the central plant is preferred. Monitoring of
electrical use by all primary plant components, individually if pos-
sible but at least as a group, is strongly recommended. Monitoring
of the refrigeration capacity produced by the refrigeration equip-
ment, by direct measurement where possible or by manufacturer’s
capacity ratings related to suction and condensing pressures, should
be incorporated. This ensures that a performance rating can be cal-
culated for use in the commissioning process and reevaluated on an
ongoing basis as a management tool to gage performance.
Optimization Software
Optimization software should be installed to obtain the best per-
formance from the system. This software must be able to predict,
monitor, and adjust to meet the load, as well as adapt to daily or
weekly storage, full or partial storage, chiller or ice priority, and a
wide variety of rate schedules.
IMPLEMENTATION AND COMMISSIONING
Elleson (1996) identified the following key steps to designing a
cool storage system:
• Calculate an accurate load profile.
• Use an hourly operating profile to size and select equipment.
• Develop a detailed description of the control strategy.
• Produce a schematic diagram.
• Produce a statement of design intent.
• Use safety factors with care.
• Plan for performance monitoring.
• Produce complete design documents.
• Retain an experienced cool storage engineer to review design.
Chapter 37 and Chapter 41 and ASHRAE Guidelines 1 and 4
provide information regarding design documentation and operator
training.
Performance Verification
The commissioning authority should verify performance and
document all operating parameters. This information should be used
to establish a database for future reference to normal conditions
based on a constant design condensing temperature. Some of the
performance data for various systems are as follows:
External Melt Ice-on-Coil Storage
• Evaporator and suction temperatures at start of ice build
• Evaporator and suction temperatures at end of ice build
• Ice thickness at end of ice build
• Time to build ice
• Efficiency at start versus theoretical efficiency
• Efficiency at end versus theoretical efficiency
• Refrigeration capacity based on published ratings (deviation can
indicate refrigerant loss or surface fouling)
Internal Melt Ice-on-Coil Storage
• Secondary coolant temperature and suction temperature at start
• Secondary coolant temperature and suction temperature at end
• Secondary coolant flow
• Tank water level at start
• Tank water level at end
• Time to build ice
• Efficiency at start versus theoretical efficiency
• Efficiency at end versus theoretical efficiency
• Capacity based on measured flow, heat balance, and
published rating
Ice-Harvesting
• Suction temperature at start
• Suction temperature at harvest
• Harvest time/condensing temperature
• Time from start to bin full signal
• Efficiency
• Tank water level at start
• Tank water level at bin full signal
• Capacity based on published rating
While tank water level cannot be used as an indicator of the
amount of ice in storage in a dynamic system, the water level at the
end of the discharge cycle is a good indicator of conditions in the
system. In systems with no gain or loss of water, the shutdown level
should be consistent, and it can be used as a backup to determine
when the bin is full for shutdown requirements. Conversely, a
change in level at shutdown can indicate a water gain or loss.
Maintenance Requirements
Following the manufacturer’s maintenance recommendations is
essential to satisfactory long-term operation. These recommenda-
tions vary, but their objective is to maintain the refrigeration equip-
ment, the refrigeration charge, the coolant circulation equipment,
the ice builder surface, the water distribution equipment, water
treatment, and controls so that they continue to perform at the same
level as when the system was commissioned. Monitoring ongoing
performance against kilowatt-hours per megagram of ice built gives
a continuing report of system performance.
REFERENCES
Akbari, H. et al. 1986. The effect of variations in convection coefficients on
thermal energy storage in buildings: Part 1—Interior partition walls.
Lawrence Berkeley Laboratory, Berkeley, CA.
33.22 1999 ASHRAE Applications Handbook (SI)
Anderson, L.O., K.G. Bernander, E. Isfalt, and A.H. Rosenfeld. 1979. Storage
of heat and cooling in hollow-core concrete slabs. Swedish Experience and
Application to Large, American Style Building. 2nd International Confer-
ence on Energy Use Management, Los Angeles.
Andrepont, J.S. 1992. Central chilled water plant expansions and the CFC
refrigerant issue—Case studies of chilled water storage. Proceedings of
the Association of Higher Education Facilities Officers 79th Annual
Meeting, Indianapolis, IN.
Andrepont, J.S. 1994. Performance and economics of CT inlet air cooling
using chilled water storage. ASHRAE Transactions 100(1):587.
Andresen, I. and M.J. Brandemuehl. 1992. Heat storage in building thermal
mass: A parametric study. ASHRAE Transactions 98(1):910-18.
Arnold, D. 1978. Comfort air conditioning and the need for refrigeration.
ASHRAE Transactions 84(2):293-303.
ASHRAE. 1981. Methods of testing thermal storage devices with electrical
input and thermal output based on thermal performance. Standard 94.2-
1981 (RA 96).
ASHRAE. 1986. Methods of testing active sensible thermal energy storage
devices based on thermal performance. Standard 94.3-1986 (RA 96).
ASHRAE. 1996. Commissioning of HVAC systems. Guideline 1-1996.
ASHRAE. 1994. Safety code for mechanical refrigeration. Standard 15-1994.
ASHRAE. 1993. Preparation of operating and maintenance documentation
for building systems. Guideline 4-1993.
ASME. Annual. Boiler and pressure vessel codes. American Society of
Mechanical Engineers, New York.
Balcomb, J.D. 1983. Heat storage and distribution inside passive solar build-
ings. Los Alamos National Laboratory, Los Alamos, NM.
Bahnfleth, W.P. and W.S. Joyce. 1994. Energy use in a district cooling sys-
tem with stratified chilled water storage. ASHRAE Transactions
100(1):1767-78.
Braun, J.E. 1990. Reducing energy costs and peak electrical demand through
optimal control of building thermal storage. ASHRAE Transactions
96(2): 876-88.
Caldwell, J. and W. Bahnfleth. 1997. Chilled water storage feasibility with-
out electric rate incentives or rebates. ASCE Journal of Architectural
Engineering 3(3):133-140.
Crane, J.M. 1991. The Consumer Research Association new office/labora-
tory complex, Milton Keynes: Strategy for environmental services.
CIBSE National Conference (pp. 2-29), Canterbury, England.
CSA. 1993. Design and construction of earth energy heat pump systems for
commercial and institutional buildings. Standard C447-93. Canadian
Standards Association, Rexdale, Ontario.
Dorgan, C.E. and J.S. Elleson. 1993. Design guide for cool thermal storage.
ASHRAE.
Drees, K.H. 1994. Modeling and control of area constrained ice storage sys-
tems. M.S. Thesis, Purdue University, W. Lafayette, IN.
Ebeling, J.A., L. Beaty, and S.K. Blanchard. 1994. Combustion turbine inlet
air cooling using ammonia-based refrigeration for capacity enhance-
ment. ASHRAE Transactions 100(1):583-6.
Elleson, J.S. 1996. Successful cool storage projects: From planning to oper-
ation. ASHRAE, Atlanta.
Elleson, J.S. 1993. Energy use of fan-powered mixing boxes with cold air
distribution. ASHRAE Transactions 99(1):1349-58.
Fiorino, D.P. 1994. Energy conservation with thermally stratified chilled-
water storage. ASHRAE Transactions 100(1):1754-66.
Gute, G.D., W.E. Stewart, Jr., and J. Chandrasekharan. 1995. Modelling the
ice-filling process of rectangular thermal energy storage tanks with mul-
tiple ice makers. ASHRAE Transactions 101(1).
Hall, S.H. 1993a. Environmental risk assessment for aquifer thermal energy
storage. PNL-8365. Pacific Northwest Laboratory, Richland, WA.
Hall, S.H. 1993b. Feasibility studies for aquifer thermal energy storage.
PNL-8364. Pacific Northwest Laboratory, Richland, WA.
Herman, A.F.E. 1980. Underfloor, structural storage air-conditioning sys-
tems. Proc. Paper 7. FRIGAIR 80, Pretoria, South Africa.
Hersh, H., G. Mirchandani, and R. Rowe. 1982. Evaluation and assessment
of thermal energy storage for residential heating. ANL SPG-23. Argonne
National Laboratory, Argonne, IL.
Hittle, D.C. and T.R. Smith. 1994. Control strategies and energy consump-
tion for ice storage systems using heat recovery and cold air distribution.
ASHRAE Transactions 100(1):1221-29.
Holness, G.V.R. 1992. Case study of combined chilled-water thermal energy
storage and fire protection storage. ASHRAE Transactions 98(1):1119-
22.
Hussain, M.A. and D.C.J. Peters. 1992. Retrofit integration of fire protection
storage as chilled-water storage—A case study. ASHRAE Transactions
98(1):1123-32.
ITSAC. 1992. Advisory Newsletter (March). International Thermal Storage
Advisory Council, San Diego.
Jenne, E.A. 1992. Aquifer thermal energy (heat and chill) storage. Papers
presented at the 1992 Intersociety Energy Conversion Engineering Con-
ference, PNL-8381. Pacific Northwest Laboratory, Richland, WA.
Kirshenbaum, M.S. 1991. Chilled-water production in ice-based thermal
storage systems. ASHRAE Transactions 97(2):422-27.
Knebel, D.E. 1986. Thermal storage—A showcase on cost savings. ASH-
RAE Journal 28(5):28-31.
Knebel, D.E. 1988a. Economics of harvesting thermal storage systems: A
case study of a merchandise distribution center. ASHRAE Transactions
94(1):1894-1904. Reprinted in ASHRAE Technical Data Bulletin
5(3):35-39, 1989.
Knebel, D.E. 1988b. Optimal control of harvesting ice thermal storage sys-
tems. AICE Proceedings, 1990, pp. 209-214.
Knebel, D.E. and S. Houston. 1989. Case study on thermal energy storage—
The Worthington Hotel. ASHRAE Journal 31(5):34-42.
Knebel, D.E. 1991. Optimal design and control of ice harvesting thermal
energy storage systems. ASME 91-HT-28. American Society of
Mechanical Engineers, New York.
Landry, C.M. and C.D. Noble. 1991. Case study of cost-effective low-
temperature air distribution, ice thermal storage. ASHRAE Transactions
97(1):854-62.
MacCracken, C.D. 1994. An overview of the progress and the potential of
thermal storage in off-peak turbine inlet cooling. ASHRAE Transactions
100(1):569-71.
Mackie, E.I. 1994. Inlet air cooling for a combustion turbine using thermal
storage. ASHRAE Transactions 100(1):572-82.
Meckler, M. 1992. Design of integrated fire sprinkler piping and thermal
storage systems: Benefits and challenges. ASHRAE Transactions 98(1):
1140-48.
Meierhans, R.A. 1993. Slab cooling and earth coupling. ASHRAE Trans-
actions 99(2):511-18.
Morofsky, E. 1994. Procedures for the environmental impact assessment of
aquifer thermal energy storage. PWC/RDD/106E. Environment Canada
and Public Works and Government Services Canada, Ottawa K1A OM2.
Morris, F.B., J.E. Braun, and S.J. Treado. 1994. Experimental and simulated
performance of optimal control of building thermal storage. ASHRAE
Transactions 100(1):402-14.
Musser, A. and W. Bahnfleth. 1998. Evolution of temperature distributions
in a full-scale stratified chilled water storage tank. ASHRAE Transac-
tions 104(1).
ORNL. 1985. Field performance of residential thermal storage systems.
EPRI EM 4041. Oak Ridge National Laboratories.
Public Works Canada. 1991. Workshop on generic configurations of seasonal
cold storage applications. International Energy Agency, Energy Conser-
vation Through Energy Storage Implementing Agreement (Annex 7).
PWC/RDD/89E (September). Public Works Canada, Ottawa K1A OM2.
Public Works Canada. 1992. Innovative and cost-effective seasonal cold
storage applications: Summary of national state-of-the-art reviews.
International Energy Agency, Energy Conservation Through Energy
Storage Implementing Agreement (Annex 7). PWC/RDD/96E (June).
Public Works Canada, Ottawa K1A OM2.
Ruchti, T.L., K.H. Drees, and G.M. Decious. 1996. Near optimal ice storage
system controller. EPRI International Conference on Sustainable Ther-
mal Energy Storage, pp. 92-98.
Rumbaugh, J., M. Blaha, W. Premerlani, F. Eddy, and W. Lorensen. 1991.
Object-oriented modeling and design. Prentice Hall, Englewood Cliffs,
NJ.
Ruud, M.D., J.W. Mitchell, and S.A. Klein. 1990. Use of building thermal
mass to offset cooling loads. ASHRAE Transactions 96(2):820-30.
Simmonds, P. 1991. The utilization and optimization of a building’s thermal
inertia in minimizing the overall energy use. ASHRAE Transactions 97(2):
1031-42.
Simmonds, P. 1994. A comparison of energy consumption for storage prior-
ity and chiller priority for ice-based thermal storage systems. ASHRAE
Transactions 100(1):1746-53.
Snijders, A.L. 1992. Aquifer seasonal cold storage for space conditioning:
Some cost-effective applications. ASHRAE Transactions 98(1):1015-22.
Thermal Storage 33.23
Stewart, W.E., G.D. Gute, J. Chandrasekharan, and C.K. Saunders. 1995a.
Modelling of the melting process of ice stores in rectangular thermal
energy storage tanks with multiple ice openings. ASHRAE Transactions
101(1).
Stewart, W.E., G.D. Gute, and C.K. Saunders. 1995b. Ice melting and melt
water discharge temperature characteristics of packed ice beds for rect-
angular storage tanks. ASHRAE Transactions 101(1).
Stovall, T.K. 1991. Turbo Refrigerating Company ice storage test report.
ORNL/TM-11657. Oak Ridge National Laboratory, Oak Ridge, TN.
Tamblyn, R.T. 1985. College Park thermal storage experience. ASHRAE
Transactions 91(1B):947-51.
Tran, N., J.F. Kreider, and P. Brothers. 1989. Field measurement of chilled
water storage thermal performance. ASHRAE Transactions 95(1):1106-
12.
Wildin, M.W. 1990. Diffuser design for naturally stratified thermal storage.
ASHRAE Transactions 96(1):1094-1102.
Wildin, M.W. 1991. Flow near the inlet and design parameters for stratified
chilled water storage. ASME 91-HT-27. American Society of Mechani-
cal Engineers, New York.
Wildin, M.W. and C.R. Truman. 1989. Performance of stratified vertical
cylindrical thermal storage tanks—Part I: Scale model tank. ASHRAE
Transactions 95(1):1086-95.
Willis, S. and J. Wilkins. 1993. Mass appeal. Building Services Journal
15(1):25-27.
Yoo, J., M. Wildin, and C.W. Truman. 1986. Initial formation of a ther-
mocline in stratified thermal storage tanks. ASHRAE Transactions
92(2A):280-90.
Sources of certain figures are as follows: Figure 10 courtesy Cryogel, Figure
14 courtesy Transphase Systems, and Figure 16 courtesy Control Electric
Corp.
BIBLIOGRAPHY
Aizawa, J., S. Hamaoka, N. Ino, T. Kuriyama, and M. Ohtsu. 1997. Devel-
opment of cooling system using slurry ice transportation (No. 1)
Dynamic ice making and storage system. Proceedings of International
Symposium Air Conditioning in High Rise Buildings ‘97. I:472-477.
Tongji University Press, Shanghai.
ASHRAE. 1996. The HVAC commissioning process. Guideline 1-1996.
AWWA. 1984. Standard for welded steel tanks for water storage. Standard
D100-84. American Water Works Association, Denver, CO.
AWWA. 1984. Standard for wire-wound circular prestressed-concrete water
tanks. Standard D110-86. American Water Works Association, Denver,
CO.
Ames, D.A. 1990. Thermal storage forum: Eutectic cool storage—Current
developments. ASHRAE Journal 32(4):46-53.
Anderson, E.D., N.W. Hanson, and D.M. Schultz. 1987. Concrete storage
tank construction techniques and quality control. EPRI Seminar Pro-
ceedings: Commercial Cool Storage, State of the Art, EM-5454-SR
(October).
Andersson, O. 1993. Scaling and corrosion, International Energy Agency,
Energy Conservation Through Energy Storage Implementing Agreement
(Annex 6—Environmental and chemical aspects of thermal energy stor-
age in aquifers and research and development of water treatment meth-
ods), Report 38-E.
Arnold, D. 1991. Laboratory performance of an encapsulated-ice store.
ASHRAE Transactions 97(2):1170-78.
Arnold, D. 1994. Dynamic simulation of encapsulated ice stores—Part II:
Model development and validation. ASHRAE Transactions 100(1):1245-
54.
Athienitis, A.K. and T.Y. Chen. 1993. Experimental and theoretical investi-
gation of floor heating with thermal storage. ASHRAE Transactions
99(1):1049-60.
Bellecci, C. and M. Conti. 1993. Transient behaviour analysis of a latent heat
thermal storage module. International Journal of Heat and Mass Trans-
fer 36(15):3851.
Berlund, L.G. 1991. Comfort benefits for summer air conditioning with ice
storage. ASHRAE Transactions 97(1):843-47.
Bhansali, A. and D.C. Hittle. 1990. Estimated energy consumption and oper-
ating cost for ice storage systems with cold air distribution. ASHRAE
Transactions 96(1):418-27.
Brady, T.W. 1994. Achieving energy conservation with ice-based thermal
storage. ASHRAE Transactions 100(1):1735-45.
Cai, L., W.E. Stewart, Jr., and C.W. Sohn. 1993. Turbulent buoyant flows
into a two-dimensional storage tank. International Journal of Heat and
Mass Transfer 36(17):4247-56.
Cao, Y. and A. Faghri. 1992. A study of thermal energy storage systems with
conjugate turbulent forced convection. Journal of Heat Transfer 114(4):
1019.
CBI. 1991. CBI Strata-Therm: Thermally stratified water storage systems.
CBI Brochure ST 0191. Chicago Bridge and Iron Company, Chicago.
Conniff, J.P. 1991. Strategies for reducing peak air-conditioning loads by
using heat storage in the building structure. ASHRAE Transactions
97(1):704-9.
Crane, R.J. and M.J.M. Krane. 1992. The optimum design of stratified ther-
mal energy storage systems—Part II: Completion of the analytical
model, presentation and interpretation of the results. Journal of Energy
Resources Technology 114(3):204.
Dorgan, C.E. and C.B. Dorgan. 1995. Cold air distribution design guide.
TR-105604. EPRI, Palo Alto, CA.
Dorgan, C.E. and C.B. Dorgan. 1995. Case study of an ice storage system
with cold air distribution and heat recovery. TR-105858. EPRI, Palo
Alto, CA.Dorgan, C.E. and J.S. Elleson. 1987. Low temperature air dis-
tribution: Economics, field evaluation, design. EM-5454-SR (October).
EPRI Seminar Proceedings: Commercial Cool Storage, State of the Art.
Dorgan, C.E, C.B. Dorgan, and S. Leight. 1995. Cool storage total building
construction cost benefits—An owner’s and architect’s guide. TR-
104521. EPRI, Palo Alto, CA.
Dorgan, C.E. and J.S. Elleson. 1989. Design of cold air distribution systems
with ice storage. ASHRAE Transactions 95(1):1317-22. Reprinted in
ASHRAE Technical Data Bulletin 5(4):23-28.
Dorgan, C.E. and J.S. Elleson. 1994. ASHRAE design guide for cool ther-
mal storage. ASHRAE Transactions 100(1):33-48.
Dorgan, C.E., J.S. Elleson, S. Dingle, S. Leight and C.B. Dorgan. 1995.
Field evaluation of a eutectic salt storage system. TR-104942. EPRI,
Palo Alto, CA.
Ebeling, J.A. and R.R. Balsbaugh. 1993. Combustion turbine inlet air cool-
ing with thermal energy storage. Turbomachinery International
34(1):30.
Elleson, J.S. 1996. Successful cool storage projects: From planning to oper-
ation. ASHRAE.
Etaion, Y. and E. Erell. 1991. Thermal storage mass in radiative cooling sys-
tems. Building and Environment 26(4):389.
Fiorino, D.P. 1991. Case study of a large, naturally stratified, chilled water
thermal energy storage system. ASHRAE Transactions 97(2):1161-69.
Fiorino, D.P. 1992. Thermal energy storage program for the 1990’s. Energy
Engineering 89(4):23-33.
Gallagher, M.W. 1991. Integrated thermal storage/Life safety systems in tall
buildings. ASHRAE Transactions 97(1):833-38.
Gatley, D.P. 1992. Cool storage ethylene glycol design guide. EPRI TR-
100945. Electric Power Research Institute, Palo Alto, CA.
Goncalves, L.C.C. and S.D. Probert. 1993. Thermal energy storage:
Dynamic performance characteristics of cans each containing a phase-
change material, assembled as a packed bed. Applied Energy 45(2):117.
Gretarsson, S.P., C.O. Pedersen, and R.K. Strand. 1994. Development of a
fundamentally based stratified thermal storage tank model for energy
analysis calculations. ASHRAE Transactions 100(1):1213-20.
Guven, H. and J. Flynn. 1992. Commissioning TES systems. Heating/Pip-
ing/Air Conditioning (January):82-84.
Harmon, J.J. and H.C. Yu. 1989. Design considerations for low-temperature
air distribution systems. ASHRAE Transactions 95(1):1295-99.
Harmon, J.J. and H.C. Yu. 1991. Centrifugal chillers and glycol ice thermal
storage units. ASHRAE Journal 33(12):25-31.
Hensel, E.C. Jr., N.L. Robinson, J. Buntain, J.W. Glover, B.D. Birdsell, and
C.W. Sohn. 1991. Chilled-water thermal storage system performance
monitoring. ASHRAE Transactions 97(2):1151-60.
Holness, G.V.R. 1987. Thermal storage forum: Industrial plants offer oppor-
tunities. ASHRAE Journal 29(5):24-25.
Holness, G.V.R. 1988. Thermal storage retrofit restores dual-temperature
system. ASHRAE Transactions 94(1):1866-78. Reprinted in ASHRAE
Technical Data Bulletin 5(3):51-59.
Hussain, M.A. and M.W. Wildin. 1991. Studies of mixing on the inlet side of
the thermocline in diurnal stratified storage. Proceedings THERMA-
STOCK 1991, Fifth International Conference on Thermal Energy Stor-
age, Scheveningen, Netherlands, May 13-16.
Jekel, T.B., J.W. Mitchell, and S.A. Klein. 1993. Modeling of ice-storage
tanks. ASHRAE Transactions 99(1):1016-24.
33.24 1999 ASHRAE Applications Handbook (SI)
Joyce, W.S. and W.P. Bahnfleth. 1992. Cornell thermal storage project saves
money and electricity. District Heating and Cooling (2):22-29.
Kamel, A.A., M.V. Swami, S. Chandra, and C.W. Sohn. 1991. An experi-
mental study of building-integrated off-peak cooling using thermal and
moisture (“enthalpy”) storage systems. ASHRAE Transactions 97(2):
240-44.
Kamimura, T., S. Hamaoka, N. Ino, T. Kuriyama, and H. Morikawa. 1997.
Development of cooling system using slurry ice transportation (No. 2)
Dynamic ice making and storage system. Proceedings of International
Symposium Air Conditioning in High Rise Buildings ‘97. I:478-483.
Tongji University Press, Shanghai.
Kuriyama, T. and Y. Sawahata. 1997. Development of cooling system using
slurry ice transportation (No. 1) Dynamic ice making and storage system.
Proceedings of International Symposium Air Conditioning in High Rise
Buildings ’97. I:484-489. Tongji University Press, Shanghai.
Kirkpatrick, A.T. and J.S. Elleson. 1997. Cold air distribution system design
guide. ASHRAE, Atlanta.
Kleinbach, E., W. Beckman, and S. Klein. 1993. Performance study of one-
dimensional models for stratified thermal storage tanks. Solar Energy
50(2):155.
Landry, C.M. and C.D. Noble. 1991. Making ice thermal storage first-cost
competitive. ASHRAE Journal 33(5):19-22.
Laybourn, D.R. 1988. Thermal energy storage with encapsulated ice. ASH-
RAE Transactions 94(1):1971-88. Reprinted in ASHRAE Technical
Data Bulletin 5(4):95-102.
Laybourn, D.R. 1990. Encapsulated ice thermal energy storage. AICE Pro-
ceedings, pp. 215-20.
MacCracken, C.D. 1985. Control of brine-type ice storage systems. ASH-
RAE Transactions 91(1B):32-43. Reprinted in ASHRAE Technical Data
Bulletin: Thermal Storage 1985(January):26-36.
Mackie, E.I. and G. Reeves. 1988. Stratified chilled-water storage design
guide. EPRI EM-4852s. Electric Power Research Institute, Palo Alto, CA.
Mackie, E.I. and W.V. Richards. 1992. Design of off-peak cooling systems.
ASHRAE Professional Development Seminar, 1992.
McQuiston, F.C. and J.D. Spitler. 1992. Cooling and heating load calcula-
tion manual, 2nd ed. ASHRAE.
Midkiff, K.C., Y.K. Song, and C.E. Brett. 1991. Thermal performance and
challenges for a seasonal chill energy storage based air-conditioning sys-
tem. ASME 91-HT-29. American Society of Mechanical Engineers,
New York.
Mirth, D.R., S. Ramadhyani, and D.C. Hittle. 1993. Thermal performance of
chilled-water cooling coils operating at low water velocities. ASHRAE
Transactions 99(1):43-53.
Mirza, C. 1992. Proceedings of Workshop on Design and Construction of
Water Wells for ATES, International Energy Agency, Energy Conserva-
tion Through Energy Storage Implementing Agreement (Annex 6—
Environmental and chemical aspects of thermal energy storage in aqui-
fers and research and development of water treatment methods), Report
41-E (August). The Netherlands.
Molson, J.W., E.O. Frind, and C.D. Palmer. 1992. Thermal energy storage in
an unconfined aquifer—II: Model development, validation, and applica-
tion. Water Resources Research 28(10):2857.
Najafi, M. and W.J. Schaetzle. 1991. Cooling and heating with clathrate
thermal energy storage system. ASHRAE Transactions 97(1):177-83.
Nussbaum, O.J. 1990. Using glycol in a closed circuit system. Heating/Pip-
ing/Air Conditioning (January):75-85.
Ott, V.J. and D. Limaye. 1986. Thermal storage air conditioning with clath-
rates and direct contact heat transfer. EPRI Proceedings: International
Load Management Conference, June 1986, Section 47.
Paris, J., M. Falareau, and C. Villeneuve. 1993. Thermal storage by latent heat:
A viable option for energy conservation in buildings. Energy Sources
15(1):85.
Paul, J. 1996. Storage of cold energy with binary ice. Proceedings of the
EPRI International Conference on Sustainable Thermal Energy Storage,
pp. 61-64. Thermal Storage Applications Research Center, Madison, WI.
Peters, D., W. Chadwick, and J. Esformes. 1986. Equipment sizing concepts
for ice storage systems. EPRI Proceedings: International Load Manage-
ment Conference, June 1986, Section 46.
Prusa, J., G.M. Maxwell, and K.J. Timmer. 1991. A Mathematical model for
a phase-change, thermal energy storage system utilizing rectangular con-
tainers. ASHRAE Transactions 97(2):245-61.
Rabl, V.A. 1987. Load management: Issues and opportunities. EM-5454-SR
(October). EPRI Seminar Proceedings: Commercial Cool Storage, State
of the Art. Electric Power Research Institute, Palo Alto, CA.
Rogers, E.C. and B.A. Stefl. 1993. Ethylene glycol: Its use in thermal stor-
age and its impact on the environment. ASHRAE Transactions 99(1):
941-49.
Rudd, A.F. 1993. Phase-change material wallboard for distributed thermal
storage in buildings. ASHRAE Transactions 99(2):339-46.
Ryu, H.W., S.A. Hong, and B.C. Shin. 1991. Heat transfer characteristics of
cool-thermal storage systems. Energy 16(4):727.
Slabodkin, A.L. 1992. Integrating an off-peak cooling system with a fire
suppression system in an existing high-rise office building. ASHRAE
Transactions 98(1):1133-39.
Sodha, M.S., J. Kaur, and R.L. Sawhney. 1992. Effect of storage on thermal
performance of a building. International Journal of Energy Research
16(8):697.
Sohn, C.W., G.L. Cler, and R.J. Kedl. 1990a. Performance of an ice-in-tank
diurnal ice storage cooling system at Fort Stewart, GA. U.S.A. CERL
Technical Report E-90/10. Construction Engineering Research Lab.
Sohn, C.W., G.L. Cler, and R.J. Kedl. 1990b. Ice-on-coil diurnal ice storage
cooling system for a barracks/office/dining hall facility at Yuma Proving
Ground, AZ. CERL Technical Report E-90/13. Construction Engineer-
ing Research Lab.
Sohn, C.W. l991. Field performance of an ice harvester storage cooling sys-
tem. ASHRAE Transactions 97(2):1187-96.
Somasundaram, S., D. Brown, and K. Drost. 1992. Cost evaluation of diur-
nal thermal energy storage for cogeneration applications. Energy Engi-
neering 89(4):8.
Sozen, M., K. Vafai, and L.A. Kennedy. 1992. Thermal charging and dis-
charging of sensible and latent heat storage packed beds. Journal of
Thermophysics and Heat Transfer 5(4):623.
Spethmann, D.H. 1989. Optimal control for cool storage. ASHRAE Trans-
actions 95(1):1189-93. Reprinted in ASHRAE Technical Data Bulletin
5(4):57-61.
Spethmann, D.H. 1993. Application considerations in optimal control of
cool storage. ASHRAE Transactions 99(1).
Stewart, R.E. 1990. Ice formation rate for a thermal storage system. ASH-
RAE Transactions 96(1):400-5.
Stewart, W.E., R.L. Kaupang, C.G. Tharp, R.D. Wendland, and L.A. Stick-
ler. 1993. An approximate numerical model of falling-film iced crystal
growth for cool thermal storage. ASHRAE Transactions 99(2):347-55.
Stovall, T.K. l991a. Baltimore Aircoil Company (BAC) ice storage test re-
port. ORNL/TM-l 1342. Oak Ridge National Laboratory, Oak Ridge,
TN.
Stovall, T.K. l991b. CALMAC ice storage test report. ORNL/TM-11582.
Oak Ridge National Laboratory, Oak Ridge, TN.
Stovall, T.K. and J.J. Tomlinson. 1991. Laboratory performance of a dy-
namic ice storage system. ASHRAE Transactions 97(2):1179-86.
Strand, R.K., C.O. Pedersen, and G.N. Coleman. 1994. Development of
direct and indirect ice-storage models for energy analysis calculations.
ASHRAE Transactions 100(1):1230-44.
Tamblyn, R.T. 1985c. Control concepts for thermal storage. ASHRAE Trans-
actions 91(1B):5-11. Reprinted in ASHRAE Technical Data Bulletin:
Thermal Storage 1985(January):1-6. Also reprinted in ASHRAE Journal
27(5):3l-34.
Tamblyn, R.T. 1990. Optimizing storage savings. Heating/Piping/Air Con-
ditioning (August):43-46.
Wildin, M.W., E.I. Mackie, and W.E. Harrison. 1990. Thermal storage
forum—Stratified thermal storage: A new/old technology. ASHRAE
Journal 32(4):29-39.
Wildin, M.W. and C.R. Truman. 1985a. A summary of experience with strat-
ified chilled water tanks. ASHRAE Transactions 91(1B):956-76. Re-
printed in ASHRAE Technical Data Bulletin: Thermal Storage 1985
(January):104-123.
Wildin, M.W. and C.R. Truman. 1985b. Evaluation of stratified chilled-
water storage techniques. EPRI EM-4352. Electric Power Research
Institute, Palo Alto, CA.
Yoo, H. and E T. Pak. 1993. A theoretical model of the charging process for
stratified thermal storage tanks. Solar Energy 51(6):513.
CHAPTER 34
ENERGY MANAGEMENT
Organization 34.1
Financing a Program 34.3
Implementing a Program 34.3
Building Emergency Energy Use Reduction 34.19
NERGY conservation is the more efficient or effective use of
Eenergy. As fuel costs rise and environmental concerns grow,
more-efficient energy conversion and utilization technologies be-
come cost-effective. However, technology alone cannot produce
sufficient results without a continuing management effort. Energy
management begins with the commitment and support of an orga-
nization’s management team.
Suggestions for developing an energy management program are
shown in Figure 1. First, a team with the right skills is selected to
manage and execute the program. This team establishes objectives,
priorities, and a time frame, sometimes with the help of outside con-
sultants. A historic database can help to evaluate future energy con-
servation opportunities (ECOs). A monitoring system can be set up
to obtain detailed use data (see Chapter 39, Building Energy Moni-
toring). Then, a detailed energy audit, which is discussed later in
this chapter, should be performed. After the ECOs and the estimated
savings have been determined, the team issues a report and adjusts
or fine-tunes the objectives and priorities. A few lower-cost conser-
vation measures that result in substantial savings can be imple-
mented first to show progress. At this stage, it is critical to monitor
and collect data, because energy management programs with writ-
ten proof of progress are often the most successful. Metering can be
installed to monitor energy consumption for each major piece of
equipment and for each consumption area. Charts showing the
progress of everyone in the facility increase awareness of energy
conservation. The program requires regular reports and readjust-
ments of the objectives and priorities, and the implemented ECOs
need to be maintained.
ORGANIZATION
Because energy management is performed in existing facilities,
most of this chapter is devoted to these facilities. Information on
energy conservation in new design can be found in all volumes of
the ASHRAE Handbook and in ASHRAE Standards 90.1 and 90.2.
The area most likely to be overlooked in new design is the ability to
measure and monitor energy consumption and trends for each
energy use category given in Chapter 39.
To be effective, energy management must be given the same
emphasis as management of any other cost/profit center. In this
regard, the functions of top management are as follows:
• Establish the energy cost/profit center.
• Assign management responsibility for the program.
• Hire or assign an energy manager.
• Allocate resources.
• Ensure that the energy management program is clearly communi-
cated to all departments to provide necessary support for achiev-
ing effective results.
• Monitor the cost-effectiveness of the program.
• Clearly set the program goals.
• Encourage ownership of the program at the lowest possible level
in the organization.
• Set up an ongoing reporting and analysis procedure to monitor the
energy management program.
An effective energy management program requires that the man-
ager (supported by a suitable budget) act and be held accountable
for those actions. It is common for a facility to allocate 3 to 10% of
the annual energy cost for the administration of an energy manage-
ment program. The budget should include funds for additional per-
sonnel as needed and for continuing education of the energy
manager and staff.
If it is not possible to add a full-time, first-line manager to the
staff, an existing employee, preferably with a technical background,
should be considered for either a full- or part-time position. This
person must be trained to organize an energy management program.
Energy management should not be an alternate or collateral duty of
an employee who is already fully occupied.
The preparation of this chapter is assigned to TC 9.6, System Energy Utili-
zation.
Fig. 1 Energy Management Program
Select Management and
Staff
Establish Objectives/
Priorities
Assemble Historic Database
Set Up Monitoring System*
Perform Energy Audits
Identify ECOs/Savings
Report
Adjust Objectives/Priorities
Implement ECOs
Establish a Measurement System
Set Up Monitoring/Data Gathering
Report
Adjust Objectives/Priorities
Maintain Measures
*Recommended
34.2 1999 ASHRAE Applications Handbook (SI)
Another option is to hire a professional energy management con-
sultant to design, implement, and maintain energy efficiency im-
provements. Some energy services companies (ESCOs) and other
firms provide energy management services as part of a contract,
with payments based on realized savings.
Figure 2 shows the organizational relationship of effective
energy management. The solid lines indicate normal reporting rela-
tionships within the organization; the dotted lines indicate new rela-
tionships created by energy management. The arrows indicate the
primary directions in which initiatives related to energy conserva-
tion normally flow. This chart shows the ideal organization. In actu-
ality, the functions shown may overlap, especially in smaller
organizations. For example, the assistant principal of a high school
may also serve as energy manager and physical plant director. How-
ever, it is important that all functions be covered.
Energy Manager
The general functions of an energy manager fall into four cate-
gories: technical, policy-related, planning and purchasing, and pub-
lic relations. The energy manager will need assistance with some of
the tasks in the following lists. A list of the specific tasks and plans
for their implementation must be clearly documented.
Technical functions include the following:
1. Conducting energy audits and identifying energy conservation
opportunities (ECOs)
2. Establishing a baseline from which energy-saving improve-
ments can be measured
3. Acting as an in-house technical consultant on new energy
technologies, alternative fuel sources, and energy-efficient
practices
4. Evaluating the energy efficiency of proposed new construction,
building expansion, remodeling, and new equipment purchases
5. Setting performance standards for efficient operation and
maintenance of machinery and facilities
6. Reviewing state-of-the-art energy management hardware
7. Selecting the most appropriate technology
8. Reviewing operation and maintenance
9. Implementing ECOs
10. Establishing an energy accounting program for continuing
analysis of energy usage and the results of ECOs
11. Maintaining the effectiveness of ECOs
12. Measuring energy use in the field whenever possible to verify
design and operation conditions
Policy-related functions include the following:
1. Fulfilling the energy policy established by upper management
2. Monitoring federal and state legislation and regulatory activities,
and recommending policy/response on such issues
3. Representing the organization in energy associations
4. Administering government-mandated reporting programs
Planning and purchasing functions include the following:
1. Monitoring energy supplies and costs to take advantage of fuel-
switching and load management opportunities
2. Ensuring that systems and equipment are purchased based on
economics (not simply on the lowest initial cost), their energy
requirements, and their ability to perform the required functions
3. Maintaining a current understanding of energy conservation,
grant programs, and demand side management (DSM) programs
offered by utilities and agencies
4. Negotiating or advising on major utility contracts
5. Developing contingency plans for supply interruptions or short-
ages
6. Forecasting the organization’s short- and long-term energy re-
quirements and costs
7. Developing short- and long-term energy conservation plans and
budgets
8. Reporting periodically to upper management
Public relations functions include the following:
1. Educating fellow employees on the benefits of efficient energy
use
2. Establishing a system to elicit and evaluate energy conservation
suggestions from employees
3. Recognizing successful energy conservation projects with
awards to plants or employees
4. Setting up a formal system for reporting to upper management
5. Establishing an energy communications network within the
organization, including bulletins, manuals, and conferences
6. Increasing community awareness of the organization’s energy
conservation achievements with press releases and appearances
at civic group meetings
General qualifications of the staff energy manager include (1) a
technical background, preferably in engineering, with experience in
energy-efficient design of building systems and processes; (2) prac-
tical, hands-on experience with systems and equipment; (3) a goal-
oriented management style; (4) the ability to work with people at all
levels, from operations and maintenance personnel to top manage-
ment; and (5) technical report writing and verbal communications
skills.
Desirable educational and professional qualifications of the staff
energy manager include the following:
1. Bachelor of Science or Engineering degree from an accredited
four-year college, preferably in mechanical, electrical, indus-
trial, or chemical engineering
2. Thorough knowledge of the principles and practices of energy
resource planning and conservation
3. Familiarity with the administrative governing organization
4. Ability to analyze and compile technical and statistical infor-
mation and reports with particular regard to energy usage
5. Knowledge of resources and information relating to energy
conservation and planning
6. Ability to motivate people and develop and establish effective
working relationships with other employees
7. Ability to interpret plans and specifications for building facili-
ties
8. Knowledge of the basic types of automatic controls and sys-
tems instrumentation
9. Knowledge of energy-related metering equipment and prac-
tices (see Chapter 39)
10. Knowledge of the organization’s manufacturing processes
11. Knowledge of building systems design and operation and/or
maintenance
12. Interest in and enthusiasm for efficient energy use
13. Ability to present ideas to all levels in the organization
• Designers
• Contractors
• Vendors
Energy
Staff
Physical
Plant
Staff
Other
Staff
Energy
Manager
Physical Other
Plant
Director
First-Line
Managers
Upper
Management
Energy
Consultant
Fig. 2 Organizational Relationships of Effective
Energy Management
34.4 1999 ASHRAE Applications Handbook (SI)
Databases
The compilation of a database of past energy usage and cost is
important in developing an energy management program. Any reli-
able utility data that is applicable should be examined. Utilities can
usually provide demand metered data on computer disks, often with
measurement intervals as short as 15 min. This is preferable to
monthly data because anomalies are more apparent. High consump-
tion at certain times may reveal opportunities for conservation
(Haberl and Komar 1990). If monthly data are used, they should be
analyzed over several years. A base year should be established as a
reference point for future energy conservation and energy cost
avoidance activities. In tabulating such data, the actual dates of
meter readings should be recorded so that energy use can be normal-
ized for differences in the number of days in a period. Any periods
during which consumption was estimated rather than measured
should be noted.
If energy is available for more than one building and/or
department under the authority of the energy manager, each of
these should be tabulated separately. Initial tabulations should
include both energy and cost per unit area. (In an industrial facil-
ity, this may be energy and cost per unit of goods produced.)
Available information on variables that may have affected past
energy use should also be tabulated. These might include heating
or cooling degree-days, percent occupancy for a hotel, quantity
of goods produced in a production facility, or average daily
weather conditions, which can be obtained from the National
Oceanic and Atmospheric Administration (NOAA), National Cli-
matic Data Center Federal Building, Asheville, NC. Because
such variables may not be directly proportional to energy use, it
is best to plot information separately or to superimpose one plot
over another, rather than develop such units as kilojoules per
square metre per degree day. As such data are tabulated, ongoing
energy accounting procedures should be developed for regular
data collection and future uses.
Comparing a building’s energy use with that of many different
buildings is a valuable way to check its relative efficiency. Data on
buildings in all sectors are summarized in DOE/EIA-0246 and
DOE/EIA-0318 for nonresidential buildings and in DOE/EIA-
0321/1 for households. The following tables present the DOE/ EIA
data in a combined format. Table 1 lists physical characteristics of
the buildings surveyed. Table 2 lists measured demand and energy
consumption. Table 3 lists various residential end uses. The EIA
also collects data on household energy consumption, which is sum-
marized in Table 4.
When an energy management program for a new building is
established, the energy use database may consist solely of typical
energy use data for similar buildings, as illustrated in Table 2. This
may be supplemented by energy simulation data for the specific
building if such data were developed during the design of the build-
ing. In addition, a new building and its systems should be properly
commissioned upon completion of construction to ensure proper
operation of all systems, including any energy conservation features.
Refer to ASHRAE Guideline 1, The HVAC Commissioning Process.
All the data presented in these tables are derived from detailed
reports of consumption patterns in buildings. Before using the data,
however, it is important to understand how it was derived. For
example, all the household energy consumption data presented in
Table 4 are average data, and they may not reflect variations in
appliances or fuel situations for different buildings. Therefore,
when using the data, verify the correct use of it with the original EIA
documents. Because these surveys are performed regularly, there
may be newer data.
ASHRAE Standard 105, Standard Methods of Measuring and
Expressing Building Energy Performance, contains information
that allows uniform, consistent expressions of energy consumption
in both proposed and existing buildings. Its use is recommended.
However, the data collected by EIA and presented here are not in
accordance with this standard.
Mazzucchi (1992) lists data elements useful for normalizing
and comparing utility billing information. Metered energy con-
sumption and cost data are also gathered and published by trade
associations that represent building owners. Some trade asso-
ciations include the Building Owners and Managers Association
International (BOMA), the National Restaurant Association (NRA),
and the American Hotel and Motel Association (AH&MA).
The quality of published energy consumption data for buildings
varies because the data are collected for different purposes by peo-
ple with different levels of technical knowledge of buildings. The
data presented here are primarily national data. In some cases, local
energy consumption data may be available from local utility com-
panies or state or provincial energy offices.
At this point in the development of an energy management
program, it is useful to compile a list of previously accomplished
energy conservation measures and the actual energy and/or cost sav-
ings of such measures. Energy and cost savings analysis methods
(MacDonald and Wasserman 1989, Section 2) can be used to calcu-
late savings. These measures and savings should be studied during
subsequent energy audits to determine their effectiveness and the
effort(s) necessary to maintain and/or improve them.
Since most energy management activities are dictated by eco-
nomics, the energy manager must understand the utility rates that
apply to each facility. Special rates are commonly applied for such
variables as time of day, interruptible service, on peak/off peak,
summer/winter, and peak demand. There are more than 1000 elec-
tric rate variations in the United States. The energy manager should
work with local utility companies to develop the most cost-effective
methods of metering and billing and enable energy cost avoidance
to be calculated effectively.
It is common for electric utilities to meter both electric con-
sumption and demand. Demand is the peak rate of consumption,
typically integrated over a 15 or 30 min period. Electric utilities
may also establish a ratchet billing procedure for demand. In a
simplified version of ratchet demand billing, the billing demand is
established as either the actual demand for the month in question
or a percentage of the highest demand during the previous 11
months, whichever is greatest. Figure 3 illustrates a gas-heated,
electrically cooled building with the highest electric demands
Fig. 3 Actual Demand Versus Billing Demand
(85%, 11 Month Ratchet)
34.6 1999 ASHRAE Applications Handbook (SI)
Government owned 553 1122 2025 69 61 650 88 45 35.5
Energy Sources*
Electricity 4343 5303 1217 69 63 465 86 50 30.5
Natural gas 2478 3544 1431 71 64 557 85 50 35.5
Fuel oil 607 1340 2202 58 64 446 93 50 35.5
District heat 110 526 4785 50 91 1161 88 60 36.5
District chilled water 53 234 4431 53 88 1161 116 65 30.5
Propane 589 496 845 64 66 372 93 50 20.5
Wood 126 65 520 119 53 307 139 50 32.5
Coal 37 2127 186 61 650 650 53 20.5
Other 71 107 1505 62 72 372 70 60 38.5
Space Heating Energy Sources*
Electricity 1467 2058 1403 60 66 511 74 50 21.5
Natural gas 2211 2930 1329 73 61 511 85 50 35.5
Fuel oil 504 614 1217 75 61 372 93 50 38.5
District heat 109 521 4775 50 91 1161 88 60 37.5
Propane 301 188 622 0 64 307 139 48 18.5
Wood 103 47 465 118 53 307 139 50 35.5
Other 25 30 1198 68 57 279 70 48 36.5
Primary Space Heating Energy Source
Electricity 1007 1254 1245 61 68 465 70 50 20.5
Natural gas 2106 2676 1273 73 61 511 85 50 35.5
Fuel oil 439 391 892 96 59 372 93 50 39.5
District heat 107 491 4580 50 91 1161 88 60 36.5
Propane 260 144 548 0 62 279 139 48 15.5
Other 61 48 0 0 1050 149 51 37.5
Cooling Energy Source*
Electricity 3293 4437 1347 65 65 465 77 50 28.5
Natural gas 65 122 1867 59 67 883 79 50 40.5
District chilled water 53 234 4404 53 88 1161 116 65 30.5
Water Heating Energy Sources* 0 0 0 0 0
Electricity 1684 2142 1273 63 63 465 74 50 22.5
Natural gas 1577 2309 1468 71 68 557 83 54 35.5
Fuel oil 120 200 1663 86 59 399 81 50 39.5
District heat 54 367 6847 51 97 2555 121 82 30.5
Propane 110 95 855 81 94 325 108 88 27.5
Cooking Energy Sources*
Electricity 487 1138 2341 60 82 511 70 80 23.5
Natural gas 448 1226 2731 61 81 790 74 75 33.5
Propane 123 137 1115 76 84 307 46 84 19.5
Energy End Uses*
Buildings with space heating 4024 5049 1254 67 63 465 83 50 30.5
Buildings with cooling 3381 4639 1375 65 66 465 77 50 28.5
Buildings with water heating 3486 4790 1375 66 66 465 80 50 30.5
Buildings with cooking 828 1924 2323 60 79 650 74 72 28.5
Buildings with manufacturing 204 362 1774 73 53 743 102 48 29.5
Buildings with elec. generator 247 1242 5035 54 90 1161 77 67 30.5
Percent of Floorspace Heated
Not heated 554 411 743 222 51 353 116 36 25.5
1 to 50 555 579 1041 136 49 511 151 45 30.5
51 to 99 633 824 1301 72 69 557 81 55 35.5
100 2836 3647 1282 62 64 465 77 50 28.5
Percent of Floorspace Cooled
Not cooled 1198 821 687 146 49 353 139 41 34.5
1 to 50 930 1396 1505 113 57 650 116 50 35.5
51 to 99 635 1166 1839 60 73 511 70 56 35.5
100 1816 2077 1143 53 68 446 70 50 23.5
Percent Lit When Open
Zero 36 18 483 0 57 167 87 50 16.5
1 to 50 666 558 836 209 62 446 186 50 35.5
51 to 99 745 900 1208 75 61 465 85 49 34.5
100 2814 3764 1338 61 65 465 77 50 26.5
Electricity not used 318 220 697 288 33 372 395 0 35.5
Percent Lit When Closed
Zero 1644 1217 743 96 42 372 110 44 30.5
1 to 50 2109 2853 1356 64 59 511 71 50 30.5
51 to 100 87 178 2044 69 74 557 76 60 30.5
Never closed 421 992 2360 61 168 557 116 168 25.5
Electricity not used 318 220 697 868 33 372 395 0 35.5
Table 1 1995 Commercial Building Characteristics (Continued)
Source: DOE/EIA 0246(95) 1997
Source Table Number 1 1 1 1 1 2 2 2 2
Building Characteristics
Total
Number of
Buildings,
Thousands
Total
Floor
Space,
10
6
m
2
Mean Median
Age of
Building,
Years
Floor
Area per
Bldg, m
2
Floor
Area per
Person, m
2
Hours
Worked
per Week
Floor
Area per
Bldg, m
2
Floor
Area per
Person, m
2
Hours
Worked
per Week
A blank space indicates data are not available, or less that 20 buildings, or error is >50%. A * indicates more than one may apply.
Energy Management 34.7
Heating Equipment*
Heat pumps 394 543 1375 59 63 465 62 48 19.5
Furnaces 1676 1386 827 79 60 446 87 50 34.5
Individual space heaters 1188 1562 1310 74 57 465 105 49 30.5
District heat 115 549 4785 51 91 1161 88 65 35.5
Boilers 610 1556 2555 63 73 836 84 53 39.5
Packaged heating units 1031 1569 1524 67 68 511 70 50 21.5
Other 161 581 3605 52 61 929 121 52 29.5
Cooling Equipment*
Residential central A/C 878 858 975 62 65 465 70 50 30.5
Heat pumps 457 644 1412 60 65 465 65 48 19.5
Individual A/C 862 1161 1342 82 68 418 105 50 40.5
District chilled water 53 234 4431 53 87 1161 116 65 30.5
Central chillers 109 1028 9420 49 87 4181 93 65 28.5
Packaged A/C units 1431 2474 1728 65 69 604 74 52 23.5
Evaporative coolers 186 228 1226 81 66 446 74 56 30.5
Other 18 88 4822 56 74 1747 84 60 39.5
Lighting Equipment Types*
Incandescent 2479 3318 1338 67 65 465 85 50 32.5
Standard fluorescent 3885 5015 1291 67 65 465 83 50 29.5
Compact fluorescent 364 1326 3642 52 85 1050 70 66 23.5
High intensity discharge 393 1511 3846 69 72 1161 99 53 27.5
Halogen 303 898 2973 55 78 743 85 60 28.5
Other 30 51 1737 43 44 186 139 45 32.5
Water Heating Equipment*
Central system 2671 2941 1106 70 65 446 77 50 31.5
Distributed system 742 1532 2062 60 71 883 81 55 25.5
Combination central & distr. 73 317 4311 64 73 929 93 50 26.5
Personal Computers/Terminals
None 2039 1168 576 146 54 325 139 45 31.5
1 to 4 1408 1059 753 91 68 399 84 53 30.5
5 to 9 437 499 1143 76 66 557 56 50 23.5
10 to 19 344 552 1607 74 61 790 52 50 25.5
20 to 49 198 655 3307 76 69 1858 64 50 25.5
50 to 99 81 459 5686 62 71 3716 58 54 29.5
100 to 249 46 482 10489 57 84 6039 56 60 24.5
250 or more 26 586 22380 31 92 13006 33 70 18.5
Energy Related Functions*
Comml food preparation 828 1924 2323 60 79 650 74 72 28.5
Computer room 234 1198 5110 47 72 1514 61 50 19.5
Large hot water activities 243 627 2583 64 99 743 82 85 31.5
Shell Conservation Features*
Roof/ceiling insulation 3380 4307 1273 65 64 465 81 50 26.5
Wall insulation 2372 2944 1245 61 62 465 77 50 21.5
Storm or multiple glazing 1897 2683 1412 63 66 511 76 50 26.5
Tinted, refl., shaded glass 1202 2252 1877 54 66 557 70 50 21.5
Shading or awnings 2271 3457 1524 62 65 557 76 50 28.5
HVAC Conservation Features*
Variable volume system 327 1252 3828 51 76 1161 70 50 23.5
Economizer cycle 461 1538 3335 53 75 929 74 57 21.5
HVAC maintenance 2403 4007 1672 62 68 557 77 51 28.5
Other efficient equipment 196 600 3019 53 66 650 64 55 23.5
Lighting Conservation Features*
Specular reflectors 749 1660 2220 59 69 557 93 50 28.5
Energy efficient ballasts 1363 2636 1932 57 67 557 70 50 25.5
Natural lighting sensors 237 597 2527 58 83 743 82 63 28.5
Occupancy sensors 131 554 4236 48 66 1161 103 50 38.5
Time clock 467 1232 2638 55 73 743 67 55 27.5
Manual dimmer switches 501 1213 2425 61 69 883 102 55 26.5
Other 79 263 3326 59 71 929 64 60 20.5
Energy Conservation Features*
Any conservation feature 4075 5136 1263 68 63 465 84 50 29.5
Building shell 3906 4942 1263 67 63 465 81 50 28.5
HVAC 2529 4149 1644 63 68 557 79 50 28.5
Lighting 2084 3580 1719 61 67 557 81 51 28.5
Off Hour Equipment Reduction*
Heating 3211 3561 1106 69 52 446 81 48 30.5
Cooling 2707 3308 1226 66 54 465 77 50 28.5
Lighting 3753 4175 1115 70 52 465 83 48 30.5
Table 1 1995 Commercial Building Characteristics (Continued)
Source: DOE/EIA 0246(95) 1997
Source Table Number 1 1 1 1 1 2 2 2 2
Building Characteristics
Total
Number of
Buildings,
Thousands
Total
Floor
Space,
10
6
m
2
Mean Median
Age of
Building,
Years
Floor
Area per
Bldg, m
2
Floor
Area per
Person, m
2
Hours
Worked
per Week
Floor
Area per
Bldg, m
2
Floor
Area per
Person, m
2
Hours
Worked
per Week
A blank space indicates data are not available, or less that 20 buildings, or error is >50%. A * indicates more than one may apply.
Energy Management 34.9
Table 2B 1995 Commercial Building Energy Consumption
Consumption shown is on an annual basis. Source: DOE/EIA 0246(95) 1998
Source Table Number 3333333333353535353535353535353737373737
Building Characteristics
Sum Major Fuels, MJ/m
2
Energy End Use: Electricity, MJ/m
2
Natural Gas, MJ/m
2
Light-
ing
Cook-
ing Refr.
Office
Equip Other Total
Space
Heat Cool
Venti-
lation
Water
Heat
Light-
ing
Cook-
ing Refr.
Office
Equip Other Total
Space
Heat
Water
Heat
Cook-
ing Other
All Buildings 232 42 35 65 69 519 23 68 32 9 240 3 36 65.9 42.0 579 325 156 59 40
Building Floor Space
93 to 465 m
2
258 101 118 61 58 726 57 84 35 24 275 12 126 64.7 46.6 1017 646 151 193
465 to 930 m
2
154 49 28 43 33 383 30 52 20 11 165 2 31 45.4 25.0 686 487 111 78
930 to 2323 m
2
167 30 28 49 42 386 22 56 20 7 171 2 30 51.1 27.3 535 359 112 43 22
2323 to 4645 m
2
210 24 28 57 59 470 23 75 24 9 211 2 30 56.8 37.5 500 301 140 32
4645 to 9290 m
2
242 23 24 69 68 522 11 78 36 7 244 2 24 70.4 47.7 493 295 142 28 27
9290 to 13580 m
2
284 35 16 82 101 579 15 70 39 5 291 2 17 84.0 55.6 597 261 229 48 60
18580 to 46450 m
2
311 52 18 97 135 628 12 69 51 6 311 3 18 96.5 57.9 608 187 245 69 104
Over 46450 m
2
325 40 25 79 103 631 9 62 47 6 341 5 26 84.0 52.2 384 112 150 50 72
Principal Building Activity
Education 179 16 11 17 33 326 20 53 18 9 181 2 11 17.0 11.4 480 290 142 18 31
Food sales 385 64 1259 15 84 2097 0 152 50 28 385 10 1259 14.8 69.3 496 276 112 85 22
Food service 420 880 359 30 156 1395 41 220 60 41 420 70 359 29.5 153.3 1791 379 315 1092
Health care 446 127 53 176 391 1027 16 104 82 10 446 3 53 176.0 136.3 1668 512 677 164 315
Lodging 263 75 26 43 85 591 36 91 19 39 265 6 26 43.2 64.7 854 153 584 90 27
Mercantile and service 266 17 10 33 42 457 23 66 28 6 268 2 10 32.9 21.6 527 419 59 23 26
Office 319 12 5 171 59 732 23 100 59 7 319 1 5 172.6 47.7 417 278 102 18 18
Public assembly 249 32 20 27 43 492 31 69 40 10 250 5 20 28.4 37.5 605 451 107 40
Public order and safety 186 2 66 144 437 2 69 26 0 186 2 65.9 81.8 508 228 175
Religious worship 57 7 5 12 133 15 22 10 5 57 2 7 4.5 11.4 326 282 39 6
Warehouse and storage 111 19 50 39 250 9 11 3 2 118 20 53.4 30.7 261 231 19 1 11
Other 303 8 173 408 857 25 98 95 2 304 8 173.7 151.0 961 428 133 380
Vacant 41 2 6 22 150 11 11 5 1 72 5 10.2 34.1 452 362 79
Year Constructed
1919 or before 169 45 15 36 85 320 8 31 19 7 176 3 16 37.5 23.8 581 351 95 59
1920 to 1945 140 20 18 37 47 318 14 41 19 5 151 2 20 40.9 26.1 524 372 97 28 27
1946 to 1959 176 34 31 52 59 404 22 50 24 9 179 2 31 53.4 32.9 686 447 154 45 37
1960 to 1969 232 45 34 60 69 503 20 65 32 10 236 2 34 61.3 40.9 593 298 195 66 36
1970 to 1979 291 36 42 76 85 621 25 78 42 10 293 5 42 76.1 48.8 604 329 169 49 57
1980 to 1989 267 48 34 86 67 618 26 91 37 10 275 5 35 88.6 50.0 455 217 141 73 25
1990 to 1992 326 106 64 90 84 728 25 93 40 9 332 9 65 92.0 63.6 687 273 228 151
1993 to 1995 258 37 84 56 77 677 0 92 39 11 278 7 91 60.2 46.6 562 283 174 58 47
Floors
One 193 49 52 47 42 477 30 67 25 10 203 5 55 48.8 34.1 528 345 93 76 12
Two 208 27 31 52 52 447 19 65 24 10 210 2 31 52.2 32.9 555 352 144 36 23
Three 211 32 16 59 76 445 18 58 26 10 215 2 16 60.2 39.7 581 355 140 39 48
Four to nine 352 53 20 114 150 719 12 79 56 8 354 3 20 114.7 69.3 761 274 304 72 111
Ten or more 336 47 16 123 109 715 19 74 65 5 344 3 17 126.1 63.6 518 168 212 68 69
Census Region and Division
Northeast 201 31 34 51 73 433 18 43 24 8 209 3 36 53.4 36.3 474 260 116 45 52
New England 182 22 22 47 62 365 9 35 18 11 186 3 22 47.7 30.7 583 326 168 40 49
Middle Atlantic 209 34 39 52 76 458 22 47 25 8 218 0 41 54.5 38.6 446 244 103 47 52
Midwest 213 40 27 58 64 457 18 49 30 9 220 3 27 60.2 38.6 781 541 160 48 33
East North Central 198 50 28 52 59 429 17 49 26 9 202 5 30 53.4 37.5 760 511 164 58 27
West North Central 248 20 24 69 72 513 20 51 35 8 259 2 25 72.7 40.9 828 606 152 25
South 242 45 39 67 68 578 24 97 37 11 250 3 40 69.3 46.6 488 231 150 70 36
South Atlantic 252 52 34 75 68 595 25 98 39 12 257 3 35 76.1 48.8 466 193 134 97 42
East South Central 241 25 42 60 70 578 36 89 32 11 254 5 44 63.6 43.2 589 342 175 32 41
West South Central 228 51 43 59 61 554 14 102 39 8 237 3 45 61.3 44.3 439 191 150 72 26
West 268 49 39 82 74 575 27 62 36 8 271 3 40 82.9 43.2 537 233 192 68 45
Mountain 246 32 36 77 61 541 22 67 37 8 249 3 36 77.2 39.7 647 402 171 42 33
Pacific 278 58 41 85 81 593 30 61 35 8 283 5 41 86.3 45.4 481 146 202 81 52
Climate Zones: 45 Year Average
<1110 CDD and >3890 HDD 201 25 26 52 52 411 20 36 22 8 208 2 27 53.4 34.1 801 584 165 32
3055 to 3890 HDD 211 39 34 59 66 452 20 44 28 10 215 3 34 60.2 39.7 730 489 157 47 36
2220 to 3055 HDD 252 37 30 70 84 546 26 60 34 7 262 3 31 72.7 43.2 564 309 137 56 62
Fewer than 2220 HDD 245 50 42 70 69 554 22 77 33 9 250 5 43 71.5 44.3 439 178 162 65 35
>1110 CDD and <2220 HDD 231 52 41 62 60 583 20 115 40 12 242 3 43 65.9 43.2 409 119 164 97 30
Workers (Main Shift)
Fewer than 5 108 10 39 22 26 301 27 32 17 10 120 1 43 25.0 22.7 514 382 103 19
5 to 9 174 32 44 40 47 405 28 51 20 12 174 5 44 39.7 29.5 618 462 93 39 24
10 to 19 203 79 40 53 39 468 27 67 23 12 203 7 40 53.4 34.1 652 417 118 110 7
20 to 49 234 69 49 61 70 526 24 77 25 9 234 5 49 62.5 40.9 588 323 142 89 34
50 to 99 253 33 26 60 59 513 16 77 27 6 256 3 26 61.3 42.0 520 265 194 43 18
100 to 249 303 34 17 92 104 634 16 93 41 9 304 2 17 92.0 57.9 587 283 200 44 60
250 or more 414 52 25 140 156 843 15 93 72 7 416 5 25 139.7 71.5 595 186 228 67 114
Weekly Operating Hours
39 or fewer 41 5 6 10 17 141 15 23 10 3 50 8 13.6 17.0 394 332 48 11
40 to 48 141 12 10 69 33 349 24 49 22 6 142 1 10 69.3 27.3 486 393 67 18 8
49 to 60 208 9 12 85 52 466 23 58 33 6 210 1 12 86.3 35.2 427 323 70 12 22
61 to 84 248 47 30 47 49 493 23 69 31 8 249 3 30 46.6 34.1 450 279 89 61 22
85 to 167 363 134 134 52 77 802 22 101 41 14 366 15 135 53.4 56.8 695 323 160 186 26
Open continuously 390 78 56 90 176 826 23 103 51 19 397 5 57 90.8 77.2 953 295 429 100 128
Ownership and Occupancy
Blank = data not available, or less that 20 buildings, or error is >50%. * = more than one may apply; ** = for demand metered buildings. Med. = Median
34.10 1999 ASHRAE Applications Handbook (SI)
Table 2A 1995 Commercial Building Energy Consumption (Continued)
Consumption shown is on an annual basis. Source: DOE/EIA 0318(95) 1998
Source Table Number 1 1 3 4 10101919212127313333333333
To t a l N o .
Bldgs.,
Thou-
sand
To t a l
Floor
Space,
10
6
m
2
Major Fuels Electricity Nat. Gas
Fuel
Oil,
L/m
2
Distr.
Heat,
MJ/m
2
Energy End Use:
Building Characteristics
MJ/m
2
$/m
2
kWh/
m
2
Med.
kWh/
m
2
Med.
Peak
W/m
2
Load
Factor MJ/m
2
Med.
MJ/m
2
Total
Space
Heat Cool
Venti-
lation
Water
Heat
Nongovernment owned 4025 4338 961 12.59 141 78 60 0.255 538 441 4.5 1163 961 293 67 30 139
Owner occupied 3158 3305 1049 13.02 144 74 60 0.253 575 451 4.5 1257 1049 326 69 31 165
Nonowner occupied 698 901 757 12.38 133 105 62 0.267 397 386 4.1 757 206 67 26 65
Unoccupied 170 132 125 1.72 30 6 17 0.184 579 125 59 1
Government owned 553 1122 1290 13.78 157 83 47 0.246 664 522 5.3 913 1290 468 70 40 225
Federal 76 163 1724 18.62 1724 499 84 78 221
State 99 265 1744 18.08 1744 537 97 56 370
Local 379 694 1015 10.98 1015 434 58 25 170
Space Vacant for at Least 3 Months
Yes 787 1472 803 10.33 128 55 34 0.144 464 368 2.0 588 803 233 60 30 102
No 3791 3988 1112 13.67 150 82 62 0.171 598 454 6.1 1209 1112 365 70 32 177
Energy Sources*
Electricity 4343 5303 1057 13.13 144 78 58 0.164 563 451 4.9 1038 1057 337 69 32 161
Natural gas 2478 3544 1170 13.56 141 80 55 0.166 564 451 2.9 914 1170 392 70 33 187
Fuel oil 607 1340 1364 15.07 171 54 47 0.178 663 325 4.9 823 1364 385 77 47 262
District heat 110 526 2110 20.13 203 110 54 0.223 688 134 1.2 1037 2110 731 57 64 472
District chilled water 53 234 2439 21.64 236 110 43 0.228 871 273 0.8 1286 2439 772 18 90 538
Propane 589 496 834 12.38 132 64 62 0.177 634 478 11.4 834 227 65 27 216
Other 213 217 1257 12.49 117 55 47 0.145 477 418 4.9 1257 517 55 26
Energy End Uses*
Buildings with space heating 4024 5049 1096 13.45 149 83 60 0.169 564 452 4.9 1039
Buildings with cooling 3381 4639 1120 13.99 157 97 62 0.180 561 435 4.1 1047
Buildings with water heating 3486 4790 1121 13.89 153 94 63 0.176 572 454 4.5 1006
Buildings with cooking 828 1924 1374 16.47 191 145 88 0.200 676 661 3.7 984
Buildings with manufacturing 204 362 895 11.09 127 68 41 0.155 481 542 6.1
Buildings with elec. generation 247 1242 1449 16.79 203 131 54 0.223 618 463 2.4 849
Space Heating Energy Sources*
Electricity 1467 2058 978 13.78 74 0.179 978 221 91 35 133
Natural gas 2211 2930 1115 12.92 591 453 1115 418 67 31 165
Fuel oil 504 614 1241 13.13 9.8 1241 493 53 31 235
District heat 109 521 2099 20.13 1041 2099 737 57 64 467
Propane 188 725 13.02 725 110 64 26 98
Other 135 98 828 9.80 828 219 49 24 123
Electricity 174 117 74 0.266
Electricity main 189 139 86 0.264
Electricity secondary 151 75 55 0.268
Other excluding electricity 130 72 52 0.248
Buildings without space heating 69 19 24 0.230
Primary Space Heating Energy Source
Electricity 1007 1254 846 13.78 189 139 86 0.162 315 1.2 846 97 108 36 99
Natural gas 2106 2676 1119 12.81 131 79 53 0.160 619 468 0.8 1119 432 65 30 162
Fuel oil 439 391 824 10.01 70 44 42 0.173 134 74 13.4 824 408 32 14 150
District heat 107 491 2097 20.34 206 110 54 0.223 640 89 1.2 1057 2097 728 57 64 463
Propane 260 144 521 12.27 133 61 72 0.197 459 521 56 24 25
Other 61 48 358 5.81 74 19 33 0.248 505 358 64 15 45
Cooling Energy Source*
Electricity 3293 4437 1078 13.89 155 96 62 0.256 1078 320 82 34 160
Natural gas 65 122 1900 19.05 977 726 1900 584 92 60 285
District chilled water 53 234 2439 21.64 2439 772 18 90 538
Water Heating Energy Sources*
Electricity 1684 2142 816 12.49 156 100 63 0.267 816 237 77 33 36
Natural gas 1577 2309 1265 14.10 673 516 1265 411 76 33 246
Fuel oil 120 200 1070 11.63 15.1 1070 370 51 15 351
District heat 54 367 2191 20.56 1133 2191 667 60 64 587
Propane 110 95 836 16.68 836 129 98 32 52
Cooking Energy Sources*
Electricity 487 1138 1387 17.01 214 169 103 0.336 1387 300 101 47 235
Natural gas 448 1226 1462 16.47 671 752 1462 323 92 40 302
Propane 123 137 957 17.87 957 191 110 35 110
Percent of Floorspace Heated
Not heated 554 411 191 4.41 69 19 24 0.230 87 191 19 7
1 to 50 555 579 451 7.00 74 51 30 0.205 257 284 4.1 451 157 30 12 27
51 to 99 633 824 1030 14.21 157 79 57 0.269 500 435 4.5 604 1030 301 77 35 141
100 2836 3647 1214 14.32 158 95 66 0.260 620 479 4.9 1114 1214 400 77 36 198
Percent of Floorspace Cooled
Not cooled 1198 821 512 5.92 58 29 27 0.218 512 273 6 77
1 to 50 930 1396 789 8.50 75 56 35 0.225 789 399 32 11 106
51 to 99 635 1166 1231 15.82 183 105 64 0.272 1231 304 92 45 203
100 1816 2077 1279 16.79 196 128 75 0.272 1279 318 104 48 196
Percent Lit When Open
Zero 36 18 20 14 0.158
1 to 50 666 558 581 7.64 66 53 39 0.213 581 283 28 12 73
51 to 99 745 900 1036 13.02 133 81 62 0.263 1036 336 62 31 169
100 2814 3764 1150 14.32 160 91 62 0.261 1150 350 78 36 175
Electricity not used 318 220 123 1.08 3 7 0.152 123 85 1 15
Percent Lit When Closed
Blank
=
data not available, or less that 20 buildings, or error is >50%.
*=
more than one may apply;
** =
for demand metered bu
ildings. Med. = Median
Energy Management 34.11
Table 2B 1995 Commercial Building Energy Consumption (Continued)
Consumption shown is on an annual basis. Source: DOE/EIA 0246(95) 1998
Source Table Number 3333333333353535353535353535353737373737
Building Characteristics
Sum Major Fuels, MJ/m
2
Energy End Use: Electricity, MJ/m
2
Natural Gas, MJ/m
2
Light-
ing
Cook-
ing Refr.
Office
Equip Other Total
Space
Heat Cool
Venti-
lation
Water
Heat
Light-
ing
Cook-
ing Refr.
Office
Equip Other Total
Space
Heat
Water
Heat
Cook-
ing Other
Nongovernment owned
Owner occupied 229 51 43 64 70 520 23 68 32 10 233 5 44 63.6 42.0 591 315 167 70 39
Nonowner occupied 218 33 28 67 50 480 24 66 26 8 223 2 28 68.1 35.2 408 265 75 49
Unoccupied 1 2 12 110 10 3 52 0 3 5.7 28.4
Government owned 276 26 20 74 89 566 19 69 41 9 282 3 20 74.9 46.6 682 405 179 35 61
Federal 468 19 19 169 165 969 14 85 82 8 489 0 20 177.2 86.3 677 296 165 30
State 383 37 23 98 139 773 0 92 57 11 388 3 23 99.9 61.3 807 347 268 56 136
Local 191 24 20 42 52 395 15 58 25 8 194 2 20 42.0 31.8 644 438 154 30 23
Space Vacant for at Least 3 Months
Yes 208 26 14 61 68 461 15 61 32 6 225 2 15 67.0 39.7 477 268 119 40 50
No 241 48 43 66 69 538 25 70 32 10 244 5 43 65.9 43.2 614 345 167 66 36
Energy Sources*
Electricity 240 43 36 66 72 519 23 68 32 9 240 3 36 65.9 42.0 579 325 154 59 40
Natural gas 243 62 35 64 84 509 12 68 33 7 244 3 35 64.7 43.2 579 325 156 59 40
Fuel oil 299 47 23 92 133 617 12 73 48 8 301 3 23 92.0 57.9 681 267 250 67 98
District heat 379 41 24 124 217 732 3 51 64 10 380 3 24 123.8 71.5 706 194 90
District chilled water 458 55 28 151 330 847 3 17 90 9 458 5 28 151.0 86.3 895 132 210 98 455
Propane 199 22 52 43 76 476 24 65 27 14 199 9 52 43.2 43.2 651 353 184 42 72
Other 204 33 18 48 422 10 56 27 9 213 3 19 50.0 32.9 489 229 127 45
Energy End Uses*
Buildings with space heating
Buildings with cooling
Buildings with water heating
Buildings with cooking
Buildings with manufacturing
Buildings with elec. generation
Space Heating Energy Sources*
Electricity 26649407569
Natural gas 232 48 34 62 58
Fuel oil 231 30 18 64 86
District heat 379 40 24 124 206
Propane 20717874374
Other 173 30 25 37
Electricity
Electricity main
Electricity secondary
Other excluding electricity
Buildings without space heating
Primary Space Heating Energy Source
Electricity 26755457861
Natural gas 231 48 34 61 57
Fuel oil 124 14 14 30 42
District heat 384 37 24 126 210
Propane 192 98 36 64
Other 117 9201628
Cooling Energy Source*
Electricity 25249397070
Natural gas 410 72 31 104 261
District chilled water 458 55 28 151 330
Water Heating Energy Sources*
Electricity 246 26 34 72 53
Natural gas 252 69 43 62 70
Fuel oil 146 17 19 34 65
District heat 374 50 26 122 240
Propane 261 31 90
Cooking Energy Sources*
Electricity 359 100 74 73 99
Natural gas 300 177 64 58 107
Propane 266 28 111 30 75
Percent of Floorspace Heated
Not heated 79 20 18 26 246 28 9 3 119 1 31 26.1 27.3
1 to 50 115 16 26 36 32 267 18 28 12 5 117 1 26 36.3 23.8 263 194 33 26
51 to 99 265 44 40 68 58 564 28 75 35 10 266 3 40 68.1 38.6 513 298 131 58 26
100 260 50 37 74 83 569 23 75 36 10 261 5 37 73.8 46.6 636 351 176 62 47
Percent of Floorspace Cooled
Not cooled 90 7 12 22 26 210 22 7 8 109 1 16 27.3 20.4 609 457 111 18
1 to 50 134 11 17 34 44 273 15 32 11 34 134 1 17 34.1 22.7 541 419 85 14 22
51 to 99 315 57 40 83 91 659 19 89 45 9 315 5 40 82.9 54.5 561 254 189 72 48
100 309 68 53 91 91 706 28 102 48 14 309 6 53 90.8 54.5 613 275 194 92 52
Percent Lit When Open
Zero
1 to 50 82 11 24 28 40 235 25 28 12 5 82 1 24 28.4 29.5 414 304 81 16
51 to 99 218 39 30 69 82 483 19 61 31 9 218 2 30 69.3 42.0 571 321 146 50 52
100 273 50 40 73 75 579 23 76 36 10 273 5 40 72.7 44.3 606 328 169 68 41
Electricity not used 2 3 7 2 7 10.2 22.7
Percent Lit When Closed
Blank
=
data not available, or less that 20 buildings, or error is >50%.
*=
more than one may apply;
** =
for demand metered bu
ildings. Med.
=
Median
34.12 1999 ASHRAE Applications Handbook (SI)
Table 2A 1995 Commercial Building Energy Consumption (Continued)
Consumption shown is on an annual basis. Source: DOE/EIA 0318(95) 1998
Source Table Number 1 1 3 4 10101919212127313333333333
To t a l N o .
Bldgs.,
Thou-
sand
To t a l
Floor
Space,
10
6
m
2
Major Fuels Electricity Nat. Gas
Fuel
Oil,
L/m
2
Distr.
Heat,
MJ/m
2
Energy End Use:
Building Characteristics
MJ/m
2
$/m
2
kWh/
m
2
Med.
kWh/
m
2
Med.
Peak
W/m
2
Load
Factor MJ/m
2
Med.
MJ/m
2
Total
Space
Heat Cool
Venti-
lation
Water
Heat
Zero 1644 1217 652 8.50 82 51 45 0.217 652 317 36 18 51
1 to 50 2109 2853 975 13.02 138 105 65 0.263 975 342 69 31 110
51 to 100 87 178 1233 17.33 233 95 43 0.260 1233 199 115 51 153
Never closed 421 992 1804 19.38 229 137 62 0.374 1804 385 110 51 452
Electricity not used 318 220 123 1.08 3 7 0.152 123 85 1
Energy Conservation Features
Any conservation feature 4075 5136 1080 13.35
Building shell 3906 4942 1096 13.56
HVAC 2529 4149 1175 14.42
Lighting 2084 3580 1182 14.64
Heating Equipment*
Heat pumps 972 169 102 33 181
Furnaces 876 366 52 23 84
Individual space heaters 993 352 61 28 134
District heat 2043 700 56 62 445
Boilers 1282 457 73 35 251
Packaged heating units 985 229 92 32 124
Other 1217 246 94 55 179
Cooling Equipment*
Residential central A/C 1163 386 82 32 174
Heat pumps 982 183 102 34 166
Individual A/C 1091 409 62 19 221
District chilled water 2439 772 18 90 538
Central chillers 1511 329 114 65 298
Packaged A/C units 1102 295 90 36 146
Evaporative coolers 1167 245 74 39 243
Other 1263 321 67 43 161
Lighting Equipment Types*
Incandescant 1117 344 72 33 201
Standard flourescent 1095 346 73 34 167
Compact flourescent 1389 340 95 49 259
High intensity discharge 1169 351 74 36 199
Halogen 1289 379 81 43 233
Other 983 141 101 53 126
Water Heating Equipment*
Central system 1236 407 74 35 213
Distributed system 848 231 75 30 85
Combination central and distr. 1372 374 77 43 307
Personal Computers/Terminals
None 602 271 30 14 83
1 to 4 919 341 56 22 107
5 to 9 1104 412 77 24 134
10 to 19 1069 371 72 23 192
20 to 49 1040 324 81 28 173
50 to 99 1117 318 86 33 181
100 to 249 1280 317 91 50 237
250 or more 1683 338 106 86 277
Commercial Refrigeration*
Any equipment 1385 309 98 44 242
Walk in units 1518 299 109 49 270
Cases and cabinets 1408 312 101 44 248
None 812 341 50 24 104
Shell Conservation Features*
Roof/ceiling insulation 1122 346 75 34 176
Wall insulation 1105 305 79 35 183
Storm or multiple glazing 1209 374 75 36 206
Tinted, refl., shaded glass 1214 308 89 45 192
Shading or awnings 1151 338 77 37 187
HVAC Conservation Features*
Variable volume system 1455 320 97 60 274
Economizer cycle 1448 377 97 52 261
HVAC maintenance 1188 360 79 37 193
Other efficient equipment 1365 335 92 51 245
Lighting Conservation Features*
Specular reflectors 1229 360 81 40 198
Energy efficient ballasts 1248 349 85 42 203
Natural lighting sensors 1330 393 93 39 231
Occupancy sensors 1375 335 84 50 249
Time clock 1170 253 97 47 187
Manual dimmer switches 1427 375 95 52 252
Other 1328 345 95 49 208
Off Hour Equipment Reduction*
Heating 896 337 60 28 100
Cooling 910 321 68 31 100
Lighting 897 332 61 28 95
Blank = data not available, or less that 20 buildings, or error is >50%. * = more than one may apply; ** = for demand metered buildings. Med. = Median
Energy Management 34.13
Table 2B 1995 Commercial Building Energy Consumption (Continued)
Consumption shown is on an annual basis. Source: DOE/EIA 0246(95) 1998
Source Table Number 3333333333353535353535353535353737373737
Building Characteristics
Sum Major Fuels, MJ/m
2
Energy End Use: Electricity, MJ/m
2
Natural Gas, MJ/m
2
Light-
ing
Cook-
ing Refr.
Office
Equip Other Total
Space
Heat Cool
Venti-
lation
Water
Heat
Light-
ing
Cook-
ing Refr.
Office
Equip Other Total
Space
Heat
Water
Heat
Cook-
ing Other
Zero 122 9 16 44 40 294 26 35 18 6 122 1 16 44.3 26.1 467 382 53 12 19
1 to 50 226 45 35 69 49 497 20 68 31 8 226 5 35 69.3 36.3 489 325 90 60 15
51 to 100 453 57 74 69 835 25 115 51 8 453 7 74 39.7 463 191 162 70
Never closed 397 79 57 91 179 826 24 103 51 19 397 5 57 90.8 78.4 952 295 428 100 128
Electricity not used 2 3 7 7 10.2 22.7
Energy Conservation Features
Any conservation feature
Building shell
HVAC
Lighting
Heating Equipment*
Heat pumps 262 35 27 83 78 623 44 102 33 16 263 3 27 84.0 27.3 539 148 285 61 44
Furnaces 184 36 49 42 40 412 18 51 23 8 185 5 49 43.2 31.8 522 388 85 40 9
Individual space heaters 229 25 33 65 64 503 33 60 28 9 231 3 34 64.7 39.7 543 354 131 30 28
District heat 378 44 24 123 208 728 3 50 62 9 379 3 24 122.6 70.4 681 89 175 98 320
Boilers 254 41 18 73 81 519 11 69 35 28 257 2 18 72.7 46.6 747 422 244 44 36
Packaged heating units 263 69 50 67 58 591 28 91 32 10 265 5 50 67.0 43.2 478 240 139 84 16
Other 367 41 28 106 101 755 33 92 55 9 367 3 28 106.7 60.2 463 192 167 56 49
Cooling Equipment*
Residential central A/C 236 66 52 61 73 531 14 81 32 9 237 5 52 61.3 38.6 681 396 166 81 37
Heat pumps 266 36 32 86 75 636 43 102 34 15 266 6 32 86.3 50.0 503 161 244 59 39
Individual A/C 187 44 27 44 75 412 19 61 19 10 189 3 27 45.4 36.3 682 379 207 56 41
District chilled water 458 55 28 151 330 847 3 17 90 9 458 5 28 151.0 86.3 895 132 210 98 455
Central chillers 386 52 22 119 127 799 18 104 65 9 386 3 22 119.2 71.5 686 270 278 64 74
Packaged A/C units 279 58 47 76 73 613 23 87 36 9 280 5 47 76.1 46.6 525 277 144 70 32
Evaporative coolers 258 98 59 73 78 585 17 74 39 6 259 6 60 72.7 52.2 702 262 290 120 31
Other 361 51 56 108 94 704 11 67 43 7 361 6 56 107.9 46.6 460 251 106 0 47
Lighting Equipment Types*
Incandescant 245 53 33 62 74 519 19 69 33 9 245 3 33 62.5 42.0
Standard flourescent 249 45 37 69 74 538 23 70 34 9 249 3 37 69.3 43.2
Compact flourescent 337 65 35 94 117 698 18 90 49 9 337 6 35 94.3 60.2
High intensity discharge 287 41 27 72 83 568 17 70 36 7 287 3 27 71.5 47.7
Halogen 300 51 28 79 94 613 19 77 43 8 300 5 28 79.5 53.4
Other 354 30 0 61 94 661 15 98 53 6 354 5 23 61.3 46.6
Water Heating Equipment*
Central system 252 55 47 72 81 563 23 72 36 20 253 5 47 72.7 46.6 679 375 190 69 45
Distributed system 243 33 24 65 64 513 24 74 31 12 243 2 24 64.7 37.5 390 223 87 45 33
Combination central and distr. 316 56 31 79 90 627 20 75 43 7 316 5 31 79.5 50.0 638 276 250 66 47
Personal Computers/Terminals
None 97 28 31 15 34 268 19 34 16 8 110 2 35 17.0 27.3
1 to 4 181 69 66 32 48 437 31 56 22 11 181 5 66 31.8 35.2
5 to 9 235 58 50 56 58 539 30 76 24 15 236 8 50 55.6 43.2
10 to 19 235 28 27 68 53 499 26 72 23 8 236 2 27 69.3 36.3
20 to 49 245 30 24 67 68 516 16 81 28 9 248 2 24 68.1 39.7
50 to 99 279 30 16 82 91 570 15 83 33 8 280 2 16 82.9 51.1
100 to 249 332 35 26 94 98 672 19 86 50 7 332 2 26 94.3 55.6
250 or more 459 48 19 184 165 944 18 98 86 8 460 5 19 185.1 67.0
Commercial Refrigeration*
Any equipment 328 108 79 68 110 725 26 95 44 12 330 9 79 68.1 60.2
Walk in units 368 131 97 74 123 815 26 106 49 14 370 11 97 74.9 68.1
Cases and cabinets 335 114 81 65 109 735 27 98 44 14 336 10 82 65.9 59.1
None 174 2 8 62 44 390 20 50 25 7 182 9 65.9 30.7
Shell Conservation Features*
Roof/ceiling insulation 254 47 40 73 76 561 23 74 35 10 258 5 40 72.7 45.4 602 333 166 62 41
Wall insulation 258 50 40 77 78 577 22 77 35 11 259 5 41 77.2 48.8 563 284 173 66 40
Storm or multiple glazing 265 58 36 78 83 581 23 74 36 11 267 5 36 78.4 48.8 658 344 194 76 44
Tinted, refl., shaded glass 301 58 35 94 91 654 24 86 45 9 302 5 35 94.3 52.2 566 259 178 76 52
Shading or awnings 263 50 30 81 86 570 23 75 37 10 265 3 30 81.8 46.6 591 296 173 67 55
HVAC Conservation Features*
Variable volume system 368 66 31 117 124 770 22 92 60 9 369 5 31 118.1 65.9 678 265 250 86 76
Economizer cycle 338 67 35 107 115 725 20 92 52 9 341 6 36 106.7 61.3 646 285 210 82 68
HVAC maintenance 271 50 34 78 84 584 20 77 37 10 273 5 34 78.4 47.7 603 318 174 65 47
Other efficient equipment 328 56 35 102 119 694 20 86 51 8 328 3 35 102.2 60.2 620 263 210 69 77
Lighting Conservation Features*
Specular reflectors 296 52 33 81 89 612 18 78 40 9 296 5 33 80.6 51.1
Energy efficient ballasts 302 50 39 89 91 645 24 82 42 10 302 5 39 88.6 52.2
Natural lighting sensors 318 50 39 70 98 644 22 91 39 9 318 3 39 70.4 52.2
Occupancy sensors 321 65 37 110 124 682 14 78 50 8 321 3 37 110.2 59.1
Time clock 330 48 35 90 83 675 18 93 47 7 330 3 35 89.7 51.1
Manual dimmer switches 334 82 28 100 109 704 20 92 52 9 334 5 28 99.9 62.5
Other 347 37 35 114 95 731 19 94 49 7 347 5 35 113.6 60.2
Off Hour Equipment Reduction*
Heating 202 36 26 59 45 441 22 59 28 7 203 3 26 60.2 31.8 470 325 81 48 17
Cooling 212 39 27 64 47 467 19 67 31 7 213 3 27 63.6 32.9 466 315 83 51 17
Lighting 206 35 31 62 47 454 23 60 28 7 206 3 31 62.5 34.1 481 333 83 49 17
Blank = data not available, or less that 20 buildings, or error is >50%. * = more than one may apply; ** = for demand metered buildings. Med. = Median
34.16 1999 ASHRAE Applications Handbook (SI)
to different levels of analysis during an energy analysis of a partic-
ular building.
In the complete development of an energy management pro-
gram, Level II audits should be performed on all facilities, although
Level I audits are useful in establishing the program. Figure 4 illus-
trates Level II energy audit input procedures in which the following
data are collected:
• General building data
• Historic energy consumption data
• Energy systems data
The collected data is used to calculate an energy use profile that
includes all end-use categories. From the energy use profiles, it is
possible to develop and evaluate energy conservation opportunities.
In conducting an energy audit, a thorough systems approach pro-
duces the best results. This approach has been described as starting
at the end rather than at the beginning. As an example of this
approach, consider a factory with steam boilers in constant opera-
tion. An expedient (and often cost-effective) approach would be to
measure the combustion efficiency of each boiler and to improve
boiler efficiency. Beginning at the end would require observing all
or most of the end uses of steam in the plant. It is possible that this
would result in the discovery of considerable quantities of steam
being wasted by venting to the atmosphere, venting through defec-
tive steam traps, uninsulated lines, and passing through unused heat
exchangers. Elimination of such end-use waste could produce
greater savings than those easily and quickly developed by improv-
ing boiler efficiency. When using this approach, care must be taken
to make cost-effective use of the energy auditor’s time. It may not be
cost-effective to track down every end use.
When conducting an energy audit, it is important to become
familiar with operating and maintenance procedures and person-
nel. The energy manager can then recommend, through the
appropriate departmental channels, energy-saving operating and
maintenance procedures. The energy manager should determine,
through continued personal observation, the effectiveness of the
recommendations.
Stewart et al. (1984) tabulated 139 different energy audit input
procedures and forms for 10 different building types, each using 62
factors. They discuss features of selected audit forms that can help
in developing or obtaining an audit procedure.
To calculate the energy cost avoidance of various energy conser-
vation opportunities, it is helpful to develop an energy cost distribu-
tion chart similar to that shown for a hospital in Figure 5.
Preliminary information of this nature can be developed from
monthly utility data by calculating end-use energy profiles (Spiel-
vogel 1984).
Analysis of electrical operating costs starts with the recording
of data from the bills on a form similar to that in Table 5. By divid-
ing the consumption by the days between readings, the average
daily consumption can be calculated. This consumption should be
plotted to detect errors in meter readings or reading dates and to
detect consumption variances (see Figure 6). For this example, 312
kWh/day is chosen as the “base electrical consumption” to cover
year-round electrical needs such as lighting, business machines,
domestic hot water, terminal reheat, security, and safety lighting.
At this point, consumptions or spans that appear to be in error
should be reexamined and corrected as necessary. If the reading
date for the 10Nov bill in Table 5 was 05Nov, the curve in Figure 6
would be more continuous. On the basis of a 05Nov reading, the
minimum daily consumption of 312 kWh on the continuous curve
(Figure 6) occurred in the February billing.
To start the analysis, the monthly base consumption is calculated
(base daily consumption times billing days) and is subtracted from
COLLECTED DATA
CALCULATED DATA
GENERAL BUILDING ENERGY CONSUMPTION ENERGY SYSTEMS
END USE DATA
DATA
DATA
Space
Heating
Space
Cooling
Air
Distribution
Water
Distribution
Domestic
Svc. Water
Heating
Domestic
Svc. Water
Distribution
Lighting
Receptacles
Office
Equipment
Computers
Kitchens
Laundries
Industrial
Systems
Conveying
Systems
Energy
Recovery
Systems
Solar
Systems
ANNUAL ENERGY
USE PROFILES
TOTAL ANNUAL
ENERGY USE
Envelope
Systems
HVAC
Systems
Domestic
Svc. Water
System
RECOVERED ENERGY
Lighting
Systems
Connected
Equipment
Special
Systems
Process
Systems
Conveying
Systems
Energy
Recovery
Systems
Solar
Systems
LOCATION
INSIDE
OUTSIDE
CONDITIONS
CONDITIONS
BUILDING TYPE
ASSEMBLY
EDUCATION
HISTORICAL
ENERGY
CONSUMPTION
DATA
SIZE/SHAPE
AREA
VOLUME
PERIMETER
AGE
Fig. 4 Energy Audit Input Procedures
DATA
FOOD SALES/
SERVICE
HEALTH CARE
HOUSING
LODGING
MANUFACTURING
OFFICE
PARKING GARAGE
PUBLIC ORDER
RETAIL
WAREHOUSE
ENERGY
SOURCES
COAL
ELECTRICITY
FUEL OIL
LPG
NATURAL GAS
SOLAR
STEAM
WOOD
Fig. 5 Energy Cost Distribution
34.18 1999 ASHRAE Applications Handbook (SI)
provides the energy manager with the information to apply energy
management principles optimally. Ideally, each energy end use in
Figure 4 would be metered separately. See also Chapter 39, Build-
ing Energy Monitoring.
Energy Conservation Opportunities
It is possible to quantitatively evaluate various energy conserva-
tion opportunities (ECOs) from end-use energy profiles. Important
considerations in this process are as follows:
• System interaction
• Utility rate structure
•Payback
• Installation requirements
• Life of the measure
• Maintainability
• Impact on building operation and appearance
Accurate energy savings calculations can be made only if system
interaction is allowed for and fully understood. Annual simulation
models may be necessary to accurately estimate the interactions
between various ECOs. The calculated remaining energy use should
be verified against a separately calculated zero-based energy target.
Further, the actual energy cost avoidance may not be propor-
tional to the energy saved, depending on the method of billing for
energy used. Using average costs per unit of energy in calculating
the energy cost avoidance of a particular measure is likely to result
in incorrect values.
Figure 7 is a list of potential ECOs. A discussion of 118 ECOs
can be found in PNL (1990).
In addition, previously implemented energy conservation mea-
sures should be evaluated—first, to ensure that they have remained
effective, and second, to consider revising them to reflect changes in
technology, building use, and/or energy cost.
Prioritize Resources
Once a list of ECOs is established, it should be evaluated, prior-
itized, and implemented. In establishing priorities, the capital cost,
cost-effectiveness, and resources available must be considered. Fac-
tors involved in evaluating the desirability of a particular energy
conservation retrofit measure are as follows:
• Rate of return (simple payback, life-cycle cost)
• Total savings (energy, cost avoidance)
• Initial cost (required investment)
• Other benefits (safety, comfort, improved system reliability, and
improved productivity)
• Liabilities (increased maintenance costs and potential obsolescence)
• Risk of failure (confidence in predicted savings, rate of increase
in energy costs, maintenance complications, and success of others
with the same measures)
To reduce the risk of failure, documented performance of ECOs
in similar situations should be obtained and evaluated. One com-
mon problem is that energy consumption for individual end uses is
overestimated, and the predicted savings are not achieved. When
doubt exists about the energy consumption, temporary measure-
ments should be made and evaluated. Also, some owners are reluc-
tant to implement ECOs because of past experiences with energy
projects. The causes of past failures should be analyzed carefully to
minimize the possibility of their reoccurrence.
The resources available to accomplish an energy conservation
retrofit opportunity should include the following:
• Management attention, commitment, and follow-through
• Skills
•Manpower
• Investment capital
ECOs may be financed with the following:
• Profit/investment
•Loans
• Rearrangement of budget priorities
• Energy savings
• Shared savings plans with outside firms and investors
• Utility incentives
• Grant programs
• Tax credits, deductions, etc.
• Donations
When all of these considerations are weighed and a prioritized list
of recommendations is developed, a report should be prepared for
management. Each recommendation should include the following:
• Present condition of the system or equipment to be modified
• Recommended action
• Who should accomplish the action
• Necessary documentation or follow-up required
• Potential interferences to successful completion of the
recommendation
Boilers Outside Air Ventilation
Boiler Auxiliaries Ventilation Layout
Condensate Systems Envelope Infiltration
Water Treatment Weatherstripping
Fuel Acquisition Caulking
Fuel Systems Vestibules
Chillers Elevator Shafts
Chiller Auxiliaries Space Insulation
Steam Distribution Vapor Barrier
Hydronic Systems Glazing
Pumps Infrared Reflection
Piping Insulation Windows
Steam Traps Window Treatment
Domestic Water Heating Shading
Lavatory Fixtures Vegetation
Water Coolers Trombe Walls
Fire Protection Systems Thermal Shutters
Swimming Pools Surface Color
Cooling Towers Roof Covering
Condensing Units Lamps
City Water Cooling Fixtures
Air Handling Units Ballasts
Coils Switch Design
Outside Air Control Photo Controls
Balancing Interior Color
Air Volume Control Demand Limiting
Shutdown Current Leakage
Air Purging Power Factor
Minimizing Reheat Transformers
Air Heat Recovery Power Distribution
Filters Cooking Practices
Dampers Hoods
Humidification Refrigeration
Duct Resistance Dishwashing
System Air Leakage Laundry
Diffusers Vending Machines
System Interaction Chiller Heat Recovery
System Reconfiguration Heat Storage
Space Segregation Time-of-Day Rates
Equipment Relocation Computer Controls
Fan-Coil Units Cogeneration
Heat Pumps Active Solar Systems
Radiators Staff Training
System Infiltration Occupant Indoctrination
Relief Air Documentation
Space Heaters Management Structure
Controls Financial Practices
Thermostats Building Geometry
Setback Space Planning
Instrumentation
Fig. 7 Potential Energy Conservation Opportunities
34.20 1999 ASHRAE Applications Handbook (SI)
4. Experiment with the plan developed, record energy consumption
and demand reduction data, and revise the plan as necessary.
Much of the experimentation may be done on weekends to min-
imize disruptive effects.
5. Meet with the local utility company(s) to review the plan.
In the emergency planning process, some measures can be
implemented permanently. Depending on the level of energy emer-
gency and the building priority, the following actions may be con-
sidered in developing the plan for emergency energy reduction in
the building:
• Change operating hours
• Move personnel into other building areas (consolidation)
• Shut off nonessential equipment
Thermal Envelope
• Use all existing blinds, draperies, and window coverings during
summer
• Install interior window insulation
• Caulk and seal around unused exterior doors and windows
• Install solar shading devices in summer
• Seal all unused vents and ducts to outside
Heating, Ventilating, and Air-Conditioning Systems and Equipment
• Modify controls or control set points to raise and lower tempera-
ture and humidity as necessary
• Shut off or isolate all nonessential equipment
• Tune up equipment
• Lower thermostat set points in winter
• Raise chilled water temperature
• Lower hot water temperature (Note: Keep hot water temperature
higher than 63°C if a gas boiler is used.)
• Reduce the level of reheat or eliminate it in winter
• Reduce or eliminate ventilation and exhaust airflow
• Raise thermostat set points in summer
• Reduce the amount of recooling in summer
Lighting Systems
• Remove lamps or reduce lamp wattage
• Use task lighting where appropriate
• Move building functions to exterior or daylight areas
• Turn off electric lights in areas with adequate natural light
• Lower luminaire height where appropriate
• Wash all lamps and luminaires
• Replace fluorescent ballasts with high-efficiency or multilevel
ballasts
• Revise building cleaning and security procedures to minimize
lighting periods
• Consolidate parking and turn off unused parking security lighting
Special Equipment
• Take transformers off-line during periods of nonuse
• Shut off or regulate the use of vertical transportation systems
• Shut off unused or unnecessary equipment, such as photocopiers,
music systems, and computers
• Reduce or turn off hot water supply
Building Operation Demand Reduction
• Sequence or interlock heating or air-conditioning systems
• Disconnect or turn off all nonessential loads
• Turn off some lights
• Preheat or precool prior to the emergency period
REFERENCES
ASHRAE. 1984. Standard methods of measuring and expressing building
energy performance. ANSI/ASHRAE Standard 105-1984 (RA 90).
ASHRAE. 1996. The HVAC commissioning process. Guideline 1-1996.
DOE/EIA. 1995. Household energy consumption and expenditures 1993. Part
1: National Data. DOE/EIA-0321/1(93).
DOE/EIA. 1997. Nonresidential buildings energy consumption survey: Char-
acteristics of commercial buildings 1995. DOE/EIA-0246(95).
DOE/EIA. 1998. Nonresidential buildings energy consumption survey: Commer-
cial buildings consumption and expenditures 1995. DOE/EIA-0318(95).
Fels. M. 1986. Energy and buildings, Vol. 9, Nos. 1 and 2, Special issue
devoted to the Princeton Scorekeeping Method (PRISM).
Haberl, J.S. and P.S. Komor. 1990a. Improving energy audits—How daily and
hourly consumption data can help, Part 1. ASHRAE Journal 90(8):26-33.
Haberl, J.S. and P.S. Komor. 1990b. Improving energy audits—How daily and
hourly consumption data can help, Part 2. ASHRAE Journal 90(9):26-36.
MacDonald, J.M. and D.M. Wasserman. 1989. Investigation of metered data
analysis methods for commercial and related buildings. ORNL/CON-
279. Oak Ridge National Laboratories, Oak Ridge, TN.
Mazzucchi, R.P. 1992. A guide for analyzing and reporting building charac-
teristics and energy use in commercial buildings. ASHRAE Transactions
98(1):1067-80.
PNL (Pacific Northwest Laboratories). 1990. Architect’s and engineer’s guide
to energy conservation in existing buildings. Vol. 2, Chapter 1. DOE/RL/
01830 P-H4.
Spielvogel, L.G. 1984. One approach to energy use evaluation. ASHRAE Trans-
actions 90(1B):424-35.
Stewart, R., S. Stewart, and R. Joy. 1984. Energy audit input procedures and
forms. ASHRAE Transactions 90(1A):350-62.
Turner, W.C. 1993. Energy management handbook. John C. Wiley and Sons,
New York.
CHAPTER 1
OWNING AND OPERATING COSTS
Owning Costs 35.1
Operating Costs 35.2
Maintenance Costs 35.4
Impact of Refrigerant Phaseouts 35.5
Other Issues 35.5
Economic Analysis Techniques 35.6
Symbols 35.11
WNING and operating cost information for the HVAC system
Oshould be part of the investment plan of a facility. This infor-
mation can be used for preparing annual budgets, managing assets,
and selecting design options. Table 1 shows a representative form
that summarizes these costs.
A properly engineered system must also be economical. Eco-
nomics are difficult to assess because of the complexities surround-
ing the effective management of money and the inherent difficulty
of predicting future operating and maintenance expenses. Complex
tax structures and the time value of money can affect the final engi-
neering decision. This does not imply the use of either the cheapest
or the most expensive system; instead, it demands an intelligent
analysis of the financial objectives and requirements of the owner.
Certain tangible and intangible costs or benefits must also be
considered when assessing owning and operating costs. Local codes
may require highly skilled or certified operators for specific types of
equipment. This could be a significant cost over the life of the sys-
tem. Similarly, such intangible items as aesthetics, acoustics, com-
fort, safety, security, flexibility, and environmental impact may be
important to a particular building or facility.
OWNING COSTS
The following elements must be established to calculate annual
owning costs: (1) initial cost, (2) analysis or study period, (3) inter-
est or discount rate, and (4) other periodic costs such as insurance,
property taxes, refurbishment, or disposal fees. Once established,
these elements are coupled with operating costs to develop an eco-
nomic analysis, which may be a simple payback evaluation or an in-
depth analysis such as outlined in the section on Economic Analysis
Techniques.
Initial Cost
Major decisions affecting annual owning and operating costs for
the life of the building must generally be made prior to the comple-
tion of contract drawings and specifications. To achieve the best
performance and economics, comparisons between alternate meth-
ods of solving the engineering problems peculiar to each project
must be made in the early stages of design. Oversimplified esti-
mates can lead to substantial errors in evaluating the system.
A thorough understanding of the installation costs and accessory
requirements must be established. Detailed lists of materials, con-
trols, space and structural requirements, services, installation labor,
and so forth can be prepared to increase the accuracy in preliminary
cost estimates. A reasonable estimate of the capital cost of compo-
nents may be derived from cost records of recent installations of
comparable design or from quotations submitted by manufacturers
and contractors. Table 2 shows a representative checklist for initial
costs.
The preparation of this chapter is assigned to TC 1.8, Owning and Operating
Costs.
Table 1 Owning and Operating Cost Data and Summary
OWNING COSTS
I. Initial Cost of System _______
I1. Periodic Costs
A. Income taxes _______
B. Property taxes _______
C. Insurance _______
D. Rent _______
E. Other periodic costs _______
Total Periodic Costs _______
III. Replacement Cost _______
IV. Salvage Value _______
Total Owning Costs _______
OPERATING COSTS
V. Annual Utility, Fuel, Water, etc., Costs
A. Utilities
1. Electricity _______
2. Natural gas _______
3. Water/Sewer _______
4. Purchased steam _______
5. Purchased hot/chilled water _______
B. Fuels
1. Propane _______
2. Fuel oil _______
3. Diesel _______
4. Coal _______
C. On-site generation of electricity _______
D. Other utility, fuel, water, etc., costs _______
Total _______
VI. Annual Maintenance Allowances/Costs
A. In-house labor _______
B. Contracted maintenance service _______
C. In-house materials _______
D. Other maintenance allowances/costs _______
Total
_______
VII.Annual Administration Costs _______
Total Annual Operating Costs _______
TOTAL ANNUAL OWNING AND OPERATING COSTS _______
Owning and Operating Costs 1.3
Electrical Energy
Fundamental changes in the purchase of electrical energy are
occurring in the United States, which is opening access to and even-
tually deregulating the electric energy industry. Individual electric
utility rates and regulations may vary widely during this period of
deregulation. Consequently, electrical energy providers and brokers
or marketers need to be contacted to determine the most competitive
supplier. Contract conditions need to be reviewed carefully to be
sure that the service will suit the purchaser’s requirements.
The total cost of electrical energy is usually a combination of
several components: energy consumption charges, fuel adjustment
charges, special allowances or other adjustments, and demand
charges.
Energy Consumption Charges. Most utility rates have step rate
schedules for consumption, and the cost of the last unit of energy
consumed may be substantially different from that of the first. The
last unit may be cheaper than the first because the fixed costs to the
utility may already have been recovered from earlier consumption
costs. Alternatively, the last unit of energy may be sold at a higher
rate to encourage conservation.
To reflect time-varying operating costs, some utilities charge dif-
ferent rates for consumption according to the time of use and sea-
son; typically, costs rise toward the peak period of use. This may
justify the cost of shifting the load to off-peak periods.
Fuel Adjustment Charge. Due to substantial variations in fuel
prices, electric utilities may apply a fuel adjustment charge to
recover costs. This adjustment may not be reflected in the rate
schedule. The fuel adjustment is usually a charge per unit of energy
and may be positive or negative depending on how much of the
actual fuel cost is recovered in the energy consumption rate.
Power plants with multiple generating units that use different
fuels typically have the greatest effect on this charge (especially
during peak periods, when more expensive units must be brought
on-line). Although this fuel adjustment charge can vary monthly,
the utility should be able to estimate an average annual or seasonal
fuel adjustment for calculations.
Allowances or Adjustments. Special allowances may be avail-
able for customers who can receive power at higher voltages or for
those who own transformers or similar equipment. Special rates
may be available for specific interruptible loads such as domestic
water heaters.
Certain facility electrical systems may produce a low power fac-
tor, which means that the utility must supply more current on an
intermittent basis, thus increasing their costs. These costs may be
passed on as an adjustment to the utility bill if the power factor is
below a level established by the utility. The power factor is the ratio
of active (real) kilowatt power to apparent (reactive) kVA power.
When calculating power bills, utilities should be asked to pro-
vide detailed cost estimates for various consumption levels. The
final calculation should include any applicable special rates, allow-
ances, taxes, and fuel adjustment charges.
Demand Charges. Electric rates may also have demand charges
based on the customer’s peak kilowatt demand. While consumption
charges typically cover the utility’s operating costs, demand charges
typically cover the owning costs.
Demand charges may be formulated in a variety of ways:
1. Straight charge—cost per kilowatt per month, charged for the
peak demand of the month.
2. Excess charge—cost per kilowatt above a base demand (e.g.,
50 kW), which may be established each month.
Table 3 Estimates of Service Lives of Various System Components
a
Equipment Item
Median
Years Equipment Item
Median
Years Equipment Item
Median
Years
Air conditioners Air terminals Air-cooled condensers 20
Window unit 10 Diffusers, grilles, and registers 27 Evaporative condensers 20
Residential single or split package 15 Induction and fan-coil units 20 Insulation
Commercial through-the-wall 15 VAV and double-duct boxes 20 Molded 20
Water-cooled package 15 Air washers 17 Blanket 24
Heat pumps Ductwork 30 Pumps
Residential air-to-air 15
b
Dampers 20 Base-mounted 20
Commercial air-to-air 15 Fans Pipe-mounted 10
Commercial water-to-air 19 Centrifugal 25 Sump and well 10
Roof-top air conditioners Axial 20 Condensate 15
Single-zone 15 Propeller 15 Reciprocating engines 20
Multizone 15 Ventilating roof-mounted 20 Steam turbines 30
Boilers, hot water (steam) Coils Electric motors 18
Steel water-tube 24 (30) DX, water, or steam 20 Motor starters 17
Steel fire-tube 25 (25) Electric 15 Electric transformers 30
Cast iron 35 (30) Heat exchangers Controls
Electric 15 Shell-and-tube 24 Pneumatic 20
Burners 21 Reciprocating compressors 20 Electric 16
Furnaces Package chillers Electronic 15
Gas- or oil-fired 18 Reciprocating 20 Valve actuators
Unit heaters Centrifugal 23 Hydraulic 15
Gas or electric 13 Absorption 23 Pneumatic 20
Hot water or steam 20 Cooling towers Self-contained 10
Radiant heaters Galvanized metal 20
Electric 10 Wood 20
Hot water or steam 25 Ceramic 34
Source: Data obtained from a survey of the United States by ASHRAE Technical Committee TC 1.8 (Akalin 1978).
a
See Lovvorn and Hiller (1985) and Easton Consultants (1986) for further information.
b
Data updated by TC 1.8 in 1986.
Owning and Operating Costs 1.7
(uniform annualized costs); or (3) in terms of periodic cash flows
(e.g., monthly or annual cash flows). Each method provides a
slightly different insight. The present value method allows easy
comparison of alternatives over the analysis period chosen. The
uniform annualized costs method allows comparison of average
annual costs of different options. The cash flow method allows
comparison of actual cash flows rather than average cash flows; it
can identify periods of overall positive and negative cash flow,
which is helpful for cash management.
Economic analysis should consider details of both positive and
negative costs over the analysis period, such as varying inflation
rates, capital and interest costs, salvage costs, replacement costs,
interest deductions, depreciation allowances, taxes, tax credits,
mortgage payments, and all other costs associated with a particular
system. See the section on Symbols for definitions of variables.
Present Value (Present Worth) Analysis. All sophisticated
economic analysis methods use the basic principles of present value
analysis to account for the time value of money. Therefore, a good
understanding of these principles is important.
The total present value (present worth) for any analysis is deter-
mined by summing the present worths of all individual items under
consideration, both future single payment items and series of equal
future payments. The scenario with the highest present value is the
preferred alternative.
Single Payment Present Value Analysis. The cost or value of
money is a function of the available interest rate and inflation rate.
The future value F of a present sum of money P over n periods with
compound interest rate i per period is
(1)
Conversely, the present value or present worth P of a future sum of
money F is given by
(2)
or
(3)
where the single payment present worth factor is
defined as
(4)
Example 3. Calculate the value in 10 years at 10% per year interest of a
system presently valued at $10 000.
Example 4. Using the present worth factor for 10% per year interest and
an analysis period of 10 years, calculate the present value of a future
sum of money valued at $10 000. (Stated another way, determine what
sum of money must be invested today at 10% per year interest to yield
$10 000 10 years from now.)
Series of Equal Payments. The present worth factor for a series
of future equal payments (e.g., operating costs) is given by
(5)
The present value P of those future equal payments (PMT) is then
the product of the present worth factor and the payment (i.e., P =
PWF(i,n)
sgl
× PMT).
The future equal payments to repay a present value of money is
determined by the capital recovery factor (CRF), which is the recip-
rocal of the present worth factor for a series of equal payments:
(6)
(7)
The CRF is often used to describe periodic uniform mortgage or
loan payments. Table 5 gives abbreviated annual CRF values for
several values of analysis period n and annual interest rate i . Some
of the values of Table 5 are plotted versus time in Figure 1.
Note that when payment periods other than annual are to be stud-
ied, the interest rate must be expressed per appropriate period. For
example, if monthly payments or return on investment are being
analyzed, then interest must be expressed per month, not per year,
and n must be expressed in months, not years.
Example 5. Determine the present value of an annual operating cost of
$1000 per year over 10 years, assuming 10% per year interest rate.
FP1 i+()
n
=
PF1 i+()
n
⁄=
PFPWF in(, )
sgl
×=
PWF in(, )
sgl
PWF in(, )
sgl
11i+()
n
⁄=
FP1 i+
()
n
$10 000 1 0.1+
()
10
$25,937.42== =
PFPWF in
(, )
sgl
×
=
P $10 000 1 1 0.1+
()
10
⁄×
=
$3855.43=
PWF in(, )
ser
1 i+()
n
1–
i 1 i+()
n
=
CRF PMT P⁄=
CRF in(, )
i 1 i+()
n
1 i+()
n
1–
i
11i+()
n–
–
==
PWF in
(, )
ser
10.1+
()
10
1–
[]
0.1 1 0.1+
()
10
[]⁄
6.14==
P $1000 6.14
()
$6140==
Table 5 Annual Capital Recovery Factors
Rate of Return or Interest Rate, % per Year
Years3.54.56 8 1012152025
2 0.52640 0.53400 0.54544 0.56077 0.57619 0.59170 0.61512 0.65455 0.69444
4 0.27225 0.27874 0.28859 0.30192 0.31547
0.32923 0.35027 0.38629 0.42344
6 0.18767 0.19388 0.20336 0.21632 0.22961
0.24323 0.26424 0.30071 0.33882
8 0.14548 0.15161 0.16104 0.17401 0.18744
0.20130 0.22285 0.26061 0.30040
10 0.12024 0.12638 0.13587 0.14903 0.16275
0.17698 0.19925 0.23852 0.28007
12 0.10348 0.10967 0.11928 0.13270 0.14676 0.16144 0.18448 0.22526 0.26845
14 0.09157 0.09782 0.10758 0.12130 0.13575
0.15087 0.17469 0.21689 0.26150
16 0.08268 0.08902 0.09895 0.11298 0.12782
0.14339 0.16795 0.21144 0.25724
18 0.07582 0.08224 0.09236 0.10670 0.12193
0.13794 0.16319 0.20781 0.25459
20 0.07036 0.07688 0.08718 0.10185 0.11746
0.13388 0.15976 0.20536 0.25292
25 0.06067 0.06744 0.07823 0.09368 0.11017 0.12750 0.15470 0.20212 0.25095
30 0.05437 0.06139 0.07265 0.08883 0.10608
0.12414 0.15230 0.20085 0.25031
35 0.05000 0.05727 0.06897 0.08580 0.10369
0.12232 0.15113 0.20034 0.25010
40 0.04683 0.05434 0.06646 0.08386 0.10226
0.12130 0.15056 0.20014 0.25006