Advances in Haptics Part 11 pptx
Bạn đang xem bản rút gọn của tài liệu. Xem và tải ngay bản đầy đủ của tài liệu tại đây (1.55 MB, 45 trang )
AdvancesinHaptics442
the visuomotor closed loop is consistent with previous studies on spatial positioning, in
which the motor command, in conjunction with internal models of both hand and visual
feedback, has been demonstrated to be useful for anticipating the resulting load force and
the position of the object (van Beers et al., 1999; Wolpert & Ghahramani, 2000; Wolpert et al.,
1995). The discrepancy between the studies of Vogels and Shi et al. may come from the
different spatial setups. In the latter study, the visual and haptic spaces were collocated in a
single space and multisensory events were generated in a natural way, permitting
sensorimotor and visual feedback to provide additional sources of information for
discerning temporal order.
In summary, these results indicate that the temporal perception of visual-haptic events can be
influenced by additional information such as sensorimotor and visual feedback. A similar
influence of the perception-action closed loop has also been found in haptic-audio asynchrony
detection, and action-to-visual-feedback-delay detection (Adelstein, Begault et al., 2003;
Adelstein, Lee et al., 2003). Thus, for the design of telepresence systems, this body of work
strongly suggests that the perception-action loop should be taken into account when making
considerations as to human operator’s capacity for multimodal simultaneity perception.
3.2 Influences of packet loss on visual-haptic simultaneity
In multimodal telepresence system, crossmodal temporal perception is not only influenced by
the perception-action loop, but also by inevitable communication delays and disturbances.
Telepresence systems operating over large geographical distances are subject to packet loss
and network communication delays, so that physically ‘synchronous’ events may be turned
into ‘asynchronous’ incidents. Packet loss is a common issue in communication network
using the DHCP service. Phenomenally, packet loss in video streams reduces image quality
and interrupts video continuity. However, how packet loss influences the perception of
visual-haptic simultaneity is, as yet, largely unknown. With regard to visual-packet loss, the
current authors (Shi et al., 2009) recently examined this issue in a series of experiments. The
task in these experiments was similar to the temporal-discrimination task used by Shi et al.
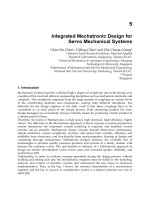
(2008, see Figure 1), while adding frame-based packet loss to the visual feedback. The packet
loss in the experiments was generated by a 2-state Gilbert-Elliot model (Elliot, 1963; Gilbert,
1960). This model can be wholly described by two transition probabilities between packet
loss state (L) and packet no-loss state (N):
ln
P
,
and
nl
P
,
(See Figure 3). With two probabilities,
two important features of the packet loss process, namely: the mean loss rate
p
r and the
mean burst length
t
l , can be easily calculated (Eq. 7 and 8).
Fig. 3. Illustration of the 2-state Gilbert-Elliot model. ‘N’ and ‘L’ denote the states of ‘No
packet loss’ and ‘Packet loss’, respectively.
nlln
ln
p
PP
P
r
,,
,
,
(7)
nl
t
P
l
,
1
.
(8)
In Experiment 1 of Shi et al. (2009), four different mean packet loss rates (
p
r
= 0, 0.1, 0.2 and
0.3), with a constant mean burst length of 33 ms, were examined. The 33-ms burst length
was chosen as it is slightly above the critical flicker fusion (CFF) rate, thereby ensuring that,
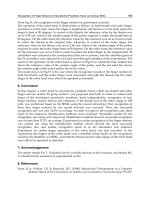
on average, the packet loss was perceivable to the observers. The results demonstrated that
visual-haptic simultaneity was influenced by the visual-packet loss rate: with increasing loss
rate, the PSS was linearly shifted towards visual delay and away from haptic delay,
indicating that observers tended to judge a video stream with packet loss as a delayed video
stream. On average, the visual delay increased by 25 ms for each 10%-increment in visual-
packet loss. Furthermore, the JND was found to increase when the packet loss rate
increased, indicating that the simultaneity judgments became more difficult with higher
packet loss rates. In part, these shifts in visual-haptic temporal perception were due to the
packet loss disturbing the perception of the visual collision (i.e., the visual collision was
‘blacked-out’). More interestingly, however, both trends, in PSSs and JNDs, remained the
same even when these parameters were re-estimated based on only those trials on which
visual-haptic collision events remained intact (i.e., on which the packet loss did not occur at
the visual collision; see Figure 4). Shi and colleagues concluded from these results that
visual-haptic simultaneity is influenced by prior exposure to packet loss, more precisely:
when the perceptual system adapts to visual feedback degraded by packet loss, the internal
estimation of forthcoming crossmodal simultaneity is biased towards visual delay. A similar
adaptation effect has also been found in a study concerned with the recalibration of
audiovisual asynchrony (Fujisaki et al., 2004). In this study, after exposure to asynchronous
audiovisual events for several minutes, observers displayed a shift in their subjective-
simultaneity responses toward the particular asynchrony to which they adapted. Our study
showed that such recalibration processes can take place even more rapidly: packet loss just
prior to the collision already influenced the visual-haptic simultaneity judgment within that
trial.
0 0.1 0.2 0.3
10
20
30
40
50
60
70
80
90
100
110
Packet loss rate
PSS (ms)
0 0.1 0.2 0.3
30
35
40
45
50
55
60
65
70
75
80
Packet loss rate
JND (ms)
(a) (b)
Fig. 4. (a) PSSs and (b) JNDs as a function of the visual-packet loss rate in Experiment 1 of
Shi et al. (2009). The mean values were estimated based on only those trials on which the
packet loss did not ‘mask’ the visual collision.
Temporalperceptionofvisual-hapticeventsinmultimodaltelepresencesystem 443
the visuomotor closed loop is consistent with previous studies on spatial positioning, in
which the motor command, in conjunction with internal models of both hand and visual
feedback, has been demonstrated to be useful for anticipating the resulting load force and
the position of the object (van Beers et al., 1999; Wolpert & Ghahramani, 2000; Wolpert et al.,
1995). The discrepancy between the studies of Vogels and Shi et al. may come from the
different spatial setups. In the latter study, the visual and haptic spaces were collocated in a
single space and multisensory events were generated in a natural way, permitting
sensorimotor and visual feedback to provide additional sources of information for
discerning temporal order.
In summary, these results indicate that the temporal perception of visual-haptic events can be
influenced by additional information such as sensorimotor and visual feedback. A similar
influence of the perception-action closed loop has also been found in haptic-audio asynchrony
detection, and action-to-visual-feedback-delay detection (Adelstein, Begault et al., 2003;
Adelstein, Lee et al., 2003). Thus, for the design of telepresence systems, this body of work
strongly suggests that the perception-action loop should be taken into account when making
considerations as to human operator’s capacity for multimodal simultaneity perception.
3.2 Influences of packet loss on visual-haptic simultaneity
In multimodal telepresence system, crossmodal temporal perception is not only influenced by
the perception-action loop, but also by inevitable communication delays and disturbances.
Telepresence systems operating over large geographical distances are subject to packet loss
and network communication delays, so that physically ‘synchronous’ events may be turned
into ‘asynchronous’ incidents. Packet loss is a common issue in communication network
using the DHCP service. Phenomenally, packet loss in video streams reduces image quality
and interrupts video continuity. However, how packet loss influences the perception of
visual-haptic simultaneity is, as yet, largely unknown. With regard to visual-packet loss, the
current authors (Shi et al., 2009) recently examined this issue in a series of experiments. The
task in these experiments was similar to the temporal-discrimination task used by Shi et al.
(2008, see Figure 1), while adding frame-based packet loss to the visual feedback. The packet
loss in the experiments was generated by a 2-state Gilbert-Elliot model (Elliot, 1963; Gilbert,
1960). This model can be wholly described by two transition probabilities between packet
loss state (L) and packet no-loss state (N):
ln
P
,
and
nl
P
,
(See Figure 3). With two probabilities,
two important features of the packet loss process, namely: the mean loss rate
p
r and the
mean burst length
t
l , can be easily calculated (Eq. 7 and 8).
Fig. 3. Illustration of the 2-state Gilbert-Elliot model. ‘N’ and ‘L’ denote the states of ‘No
packet loss’ and ‘Packet loss’, respectively.
nlln
ln
p
PP
P
r
,,
,
,
(7)
nl
t
P
l
,
1
.
(8)
In Experiment 1 of Shi et al. (2009), four different mean packet loss rates (
p
r
= 0, 0.1, 0.2 and
0.3), with a constant mean burst length of 33 ms, were examined. The 33-ms burst length
was chosen as it is slightly above the critical flicker fusion (CFF) rate, thereby ensuring that,
on average, the packet loss was perceivable to the observers. The results demonstrated that
visual-haptic simultaneity was influenced by the visual-packet loss rate: with increasing loss
rate, the PSS was linearly shifted towards visual delay and away from haptic delay,
indicating that observers tended to judge a video stream with packet loss as a delayed video
stream. On average, the visual delay increased by 25 ms for each 10%-increment in visual-
packet loss. Furthermore, the JND was found to increase when the packet loss rate
increased, indicating that the simultaneity judgments became more difficult with higher
packet loss rates. In part, these shifts in visual-haptic temporal perception were due to the
packet loss disturbing the perception of the visual collision (i.e., the visual collision was
‘blacked-out’). More interestingly, however, both trends, in PSSs and JNDs, remained the
same even when these parameters were re-estimated based on only those trials on which
visual-haptic collision events remained intact (i.e., on which the packet loss did not occur at
the visual collision; see Figure 4). Shi and colleagues concluded from these results that
visual-haptic simultaneity is influenced by prior exposure to packet loss, more precisely:
when the perceptual system adapts to visual feedback degraded by packet loss, the internal
estimation of forthcoming crossmodal simultaneity is biased towards visual delay. A similar
adaptation effect has also been found in a study concerned with the recalibration of
audiovisual asynchrony (Fujisaki et al., 2004). In this study, after exposure to asynchronous
audiovisual events for several minutes, observers displayed a shift in their subjective-
simultaneity responses toward the particular asynchrony to which they adapted. Our study
showed that such recalibration processes can take place even more rapidly: packet loss just
prior to the collision already influenced the visual-haptic simultaneity judgment within that
trial.
0 0.1 0.2 0.3
10
20
30
40
50
60
70
80
90
100
110
Packet loss rate
PSS (ms)
0 0.1 0.2 0.3
30
35
40
45
50
55
60
65
70
75
80
Packet loss rate
JND (ms)
(a) (b)
Fig. 4. (a) PSSs and (b) JNDs as a function of the visual-packet loss rate in Experiment 1 of
Shi et al. (2009). The mean values were estimated based on only those trials on which the
packet loss did not ‘mask’ the visual collision.
AdvancesinHaptics444
3.3 Influences of prior information on visual-haptic simultaneity
The study of Shi et al. (2009) suggests that the perceptual system may use past information,
such as from visual feedback, to predict the forthcoming events. However, how rapidly past
information can be used for this prediction is still an open question. From the perspective of
system design, the update rate of the internal temporal percept is an important factor, since
it describes the temporal resolution of the dynamic adjustment of crossmodal simultaneity.
Thus, to further examine the update rate of prior information on crossmodal temporal
perception, we conducted a new experiment on visual-haptic temporal discrimination with
packet loss in the visual feedback. In this experiment, we kept the packet loss rate constant
at 0.2 for the initial movement prior to the collision event. The experimental design and task
were similar to Shi et al. (2009). On a typical trial, the observer moved his/her finger from
the left to the right (or vice versa) and made a collision with the ‘wall’. When the visual
moving object (represented by a small dot, which was controlled by the observer’s index
finger) approached the wall, visual-packet loss was ‘switched off’ at certain distances before
reaching the wall (i.e., from the respective distance onwards, there was no longer a chance
of a packet loss occurring). Four different switch-off distances (i.e., distance from the
position of the moving object to the wall at the moment packet loss was switched off) were
examined in the experiment: 5, 30, 60 mm, and the whole movement trajectory (in the latter
condition, there was no packet loss at any distance; see Figure 5).
d
Force Feedback First
Moving Across First
dd
Force Feedback First
Moving Across First
Force Feedback First
Moving Across First
Initial
Position
Wall
End
Position
Moving dot
Switch-off interval
t
dd
Force Feedback First
Moving Across First
Force Feedback First
Moving Across First
dd
Force Feedback First
Moving Across First
Force Feedback First
Moving Across First
Initial
Position
Wall
End
Position
Moving dot
Switch-off interval
t
Fig. 5. Schematic illustration of a trial sequence. The movement trajectory is denoted by the
long red arrow. The dashed line of the trajectory denotes visual feedback with packet loss,
and the solid line visual feedback without packet loss. The packet loss switch-off distance is
denoted by d.
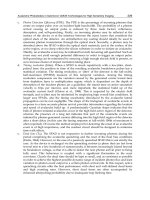
The mean PSSs were 106.8, 87.3, and 80.1 ms for switch-off distance of 5, 30, and 60 mm,
respectively; the mean PSS for the no-packet-loss condition was 79.5 ms. A repeated-
measures ANOVA revealed the effect of switch-off distance to be significant, F(3,30) = 4.68,
p<0.01. A further contrast tested showed the PSS to decrease linearly with increasing switch-
off distance, F(1,10)=5.82, p<0.05. The fact that, with increasing switch-off distance, the PSS
approached the level achieved in the no-packet-loss condition suggests that ‘no-packet-loss’
information between the switch-off and the collision led to a gradual updating of the
internal prediction of the forthcoming visual event. To estimate the internal update rate, we
converted the switch-off distances into switch-off time intervals using observers’ movement
speeds; these intervals were, on average, 14 ms, 85 ms, and 172 ms for 5-mm, 30-mm, and
60-mm distances, respectively. The relationship between PSS and switch-off time interval is
shown in Figure 6. The 95% confidence intervals revealed that the PSS was significantly
larger, relative to the (no-packet-loss) baseline, at a switch-off interval of 87 ms (30-mm
distance), while the PSS at a switch-off interval of 172 ms (60-mm distance) was no different
from the baseline. This means that a complete update with prior visual feedback took
between 85 and 172 ms. In other words, the internal update rate was in-between 6 to 12 Hz.
In summary, the above results demonstrate that prior information does not immediately
impact on the internal representation. The internal processing requires some time to update
and adapt to changes of the external world. The time required by the internal processing is
in the range of a hundred or so milliseconds, which may relate to the short-duration
working memory involved in crossmodal temporal processing. In the design of telepresence
systems, it would be advisable to use this update rate for the implementation of assistive
functions.
0 50 100 150 200
75
80
85
90
95
100
105
110
115
5 mm
30 mm
60 mm
no packet loss
Switch−off interval (ms)
PSS (ms)
Fig. 6. PSS as a function of the switch-off time interval. The switch-off time intervals were
estimated from the movement velocity. Error bars indicate 95% confidence intervals, which
were estimated from 1000-sample bootstrapping.
4. Process model of crossmodal temporal perception
The studies discussed above showed that crossmodal simultaneity in an explorative
environment is not only influenced by crossmodal temporal inconsistency, but also by many
other sources of information, such as the visuomotor movement, the quality of the feedback
signal, prior adaptation, etc. A recent study by Adelstein and colleagues (Adelstein, Lee et
al., 2003) on head tracking latency also suggested that in virtual environments (with a head-
mounted display), observers might use ‘image slip’ rather than the explicit time delay
between input head motion and its displayed consequences to detect the asynchrony.
Similarly, it has been found previously in audio-visual simultaneity judgments that, in
relatively large environments, the brain may take sound velocity and distance information
into account in the simultaneity perception of audio-visual events (Sugita & Suzuki, 2003).
All available evidence converges on the view that the CNS may use additional information
Temporalperceptionofvisual-hapticeventsinmultimodaltelepresencesystem 445
3.3 Influences of prior information on visual-haptic simultaneity
The study of Shi et al. (2009) suggests that the perceptual system may use past information,
such as from visual feedback, to predict the forthcoming events. However, how rapidly past
information can be used for this prediction is still an open question. From the perspective of
system design, the update rate of the internal temporal percept is an important factor, since
it describes the temporal resolution of the dynamic adjustment of crossmodal simultaneity.
Thus, to further examine the update rate of prior information on crossmodal temporal
perception, we conducted a new experiment on visual-haptic temporal discrimination with
packet loss in the visual feedback. In this experiment, we kept the packet loss rate constant
at 0.2 for the initial movement prior to the collision event. The experimental design and task
were similar to Shi et al. (2009). On a typical trial, the observer moved his/her finger from
the left to the right (or vice versa) and made a collision with the ‘wall’. When the visual
moving object (represented by a small dot, which was controlled by the observer’s index
finger) approached the wall, visual-packet loss was ‘switched off’ at certain distances before
reaching the wall (i.e., from the respective distance onwards, there was no longer a chance
of a packet loss occurring). Four different switch-off distances (i.e., distance from the
position of the moving object to the wall at the moment packet loss was switched off) were
examined in the experiment: 5, 30, 60 mm, and the whole movement trajectory (in the latter
condition, there was no packet loss at any distance; see Figure 5).
d
Force Feedback First
Moving Across First
dd
Force Feedback First
Moving Across First
Force Feedback First
Moving Across First
Initial
Position
Wall
End
Position
Moving dot
Switch-off interval
t
dd
Force Feedback First
Moving Across First
Force Feedback First
Moving Across First
dd
Force Feedback First
Moving Across First
Force Feedback First
Moving Across First
Initial
Position
Wall
End
Position
Moving dot
Switch-off interval
t
Fig. 5. Schematic illustration of a trial sequence. The movement trajectory is denoted by the
long red arrow. The dashed line of the trajectory denotes visual feedback with packet loss,
and the solid line visual feedback without packet loss. The packet loss switch-off distance is
denoted by d.
The mean PSSs were 106.8, 87.3, and 80.1 ms for switch-off distance of 5, 30, and 60 mm,
respectively; the mean PSS for the no-packet-loss condition was 79.5 ms. A repeated-
measures ANOVA revealed the effect of switch-off distance to be significant, F(3,30) = 4.68,
p<0.01. A further contrast tested showed the PSS to decrease linearly with increasing switch-
off distance, F(1,10)=5.82, p<0.05. The fact that, with increasing switch-off distance, the PSS
approached the level achieved in the no-packet-loss condition suggests that ‘no-packet-loss’
information between the switch-off and the collision led to a gradual updating of the
internal prediction of the forthcoming visual event. To estimate the internal update rate, we
converted the switch-off distances into switch-off time intervals using observers’ movement
speeds; these intervals were, on average, 14 ms, 85 ms, and 172 ms for 5-mm, 30-mm, and
60-mm distances, respectively. The relationship between PSS and switch-off time interval is
shown in Figure 6. The 95% confidence intervals revealed that the PSS was significantly
larger, relative to the (no-packet-loss) baseline, at a switch-off interval of 87 ms (30-mm
distance), while the PSS at a switch-off interval of 172 ms (60-mm distance) was no different
from the baseline. This means that a complete update with prior visual feedback took
between 85 and 172 ms. In other words, the internal update rate was in-between 6 to 12 Hz.
In summary, the above results demonstrate that prior information does not immediately
impact on the internal representation. The internal processing requires some time to update
and adapt to changes of the external world. The time required by the internal processing is
in the range of a hundred or so milliseconds, which may relate to the short-duration
working memory involved in crossmodal temporal processing. In the design of telepresence
systems, it would be advisable to use this update rate for the implementation of assistive
functions.
0 50 100 150 200
75
80
85
90
95
100
105
110
115
5 mm
30 mm
60 mm
no packet loss
Switch−off interval (ms)
PSS (ms)
Fig. 6. PSS as a function of the switch-off time interval. The switch-off time intervals were
estimated from the movement velocity. Error bars indicate 95% confidence intervals, which
were estimated from 1000-sample bootstrapping.
4. Process model of crossmodal temporal perception
The studies discussed above showed that crossmodal simultaneity in an explorative
environment is not only influenced by crossmodal temporal inconsistency, but also by many
other sources of information, such as the visuomotor movement, the quality of the feedback
signal, prior adaptation, etc. A recent study by Adelstein and colleagues (Adelstein, Lee et
al., 2003) on head tracking latency also suggested that in virtual environments (with a head-
mounted display), observers might use ‘image slip’ rather than the explicit time delay
between input head motion and its displayed consequences to detect the asynchrony.
Similarly, it has been found previously in audio-visual simultaneity judgments that, in
relatively large environments, the brain may take sound velocity and distance information
into account in the simultaneity perception of audio-visual events (Sugita & Suzuki, 2003).
All available evidence converges on the view that the CNS may use additional information
AdvancesinHaptics446
to predict, or infer, the external forthcoming events. Predicting the next states has been
shown to be useful for compensating for the slow speed of updating in the visuomotor
control system (Wolpert, 1997; Wolpert et al., 1995). This capacity for prediction has been
attributed to an internal model that is assumed to underlie the nervous system’s remarkable
ability to adapt to unknown or underdetermined changes in the environment (Tin & Poon,
2005).
Inspired by this idea of an internal model for the sensorimotor system, we suggest that
dynamic multisensory temporal perception can be described in an analogous way. Figure 6
illustrates such an internal model of multisensory temporal perception. When there are only
individual (unrelated) multisensory inputs, the CNS may use the resolution in the
individual sensory channels to estimate the onset (or offset) time of events and from this
determine crossmodal simultaneity. However, such passive forward estimation may suffer
from differences in the neural latencies among different modalities. For example, a auditory
event is usually perceived as ‘earlier’ than a synchronous visual event (Dixon & Spitz, 1980).
When additional information is available, such as sensorimotor information, visual-motion
trajectories, or visuo-proprioceptive discrepancies, the CNS may use this information to
make a fine prediction and provide for crossmodal compensation in anticipating the
forthcoming events. Using this model, one can easily explain the small PSS found in the
visuo-motor closed-loop condition in Shi et al. (2008). The visuo-motor closed-loop helps the
CNS to make a fine prediction of the forthcoming visual events, thus partially compensating
for the delay inherent in the visual processing. The prediction mechanism can also be
applied to account for the results of the packet loss experiments (Shi et al., 2009). The visual-
feedback signal was disturbed by the packet loss, which made the video stream appear
stagnant from time to time. Such prior ‘delay’ information is used by the CNS for predicting
the timing of the forthcoming visual-haptic events. As a result, the PSS was shifted towards
visual delay. Note, however, that the use of prior information by the CNS to adjust the
crossmodal temporal representation is not immediate: the experiment outlined above (in
section 3.3) suggests that the update rate of using prior information is only of the order of 6-
12 Hz.
Fig. 6. Internal model of multisensory temporal perception.
5. Conclusion
In summary, we have provided an overview of studies concerned with visual-haptic
simultaneity perception in multimodal telepresence system. It is clear that the perception of
visual-haptic simultaneity is dynamic. In general, visual events are perceived as ‘later’ than
physically synchronous haptic events. The visual-haptic simultaneity window (indicated by
the PSS and JND parameters) may vary from dozens to hundreds of milliseconds. In
interactive virtual environments such as telepresence systems, the crossmodal simultaneity
window is influenced by other sources of information, such as sensorimotor feedback,
packet loss in the feedback signal, and prior adaptation. Packet loss in visual feedback can
bias visual-haptic judgments towards visual delay and such biases may influence even the
perception of intact (visual-collision) events. In addition, prior information may also
influence crossmodal simultaneity, however, this information is effectively taken into
account only after one hundred milliseconds or so. Finally, based on the range of empirical
evidence reviewed, we proposed that multisensory temporal perception involves an internal
process model. The results, and the proposed framework model, can be used to derive
guidelines for the design of the multimodal telepresence systems, concerning the
crossmodal temporal perception of the human operator.
6. References
Adelstein, B. D., Begault, D. R., Anderson, M. R., & Wenzel, E. M. (2003) Sensitivity to
haptic-audio asynchrony, Proceedings of the 5th international conference on Multimodal
interfaces (pp. 73-76). Vancouver, British Columbia, Canada.
Adelstein, B. D., Lee, T. G., & Ellis, S. R. (2003) Head Tracking Latency in Virtual
Environments: Psychophysics and a Model, Human Factors and Ergonomics Society
Annual Meeting Proceedings (pp. 2083-2087): Human Factors and Ergonomics
Society.
Ballantyne, G. H. (2002) Robotic surgery, telerobotic surgery, telepresence, and
telementoring. Review of early clinical results. Surgical Endoscopy 16(10), 1389-1402.
Collett, D. (2002) Modelling Binary Data (2 ed.): Chapman & Hall/CRC.
Dixon, N. F., & Spitz, L. (1980) The detection of auditory visual desynchrony, Perception
(Vol. 9, pp. 719-721).
Draper, J. V., Kaber, D. B., & Usher, J. M. (1998) Telepresence. Human Factors 40(3), 354-375.
Elliot, E. O. (1963) A Model of the Switched Telephone Network for Data Communications,
Bell System Technical Journal (Vol. 44, pp. 89-109).
Ferrell, W. R. (1966) Delayed force feedback, Human Factors (Vol. 8, pp. 449-455).
Fujisaki, W., Shimojo, S., Kashino, M., & Nishida, S. (2004) Recalibration of audiovisual
simultaneity. Nature Neuroscience 7(7), 773-778.
Gilbert, E. N. (1960) Capacity of a burst-noise channel, Bell System Technical Journal (Vol. 39,
pp. 1253-1265).
Held, R. (1993) Telepresence, time delay and adaptation. In S. R. Ellis, M. K. Kaiser & A. J.
Grunwald (Eds.), Pictorial communication in virtual and real environments (pp. 232-
246): Taylor and Francis.
Heller, M. A., & Myers, D. S. (1983) Active and passive tactual recognition of form. Journal of
General Psychology 108(2d Half), 225-229.
Temporalperceptionofvisual-hapticeventsinmultimodaltelepresencesystem 447
to predict, or infer, the external forthcoming events. Predicting the next states has been
shown to be useful for compensating for the slow speed of updating in the visuomotor
control system (Wolpert, 1997; Wolpert et al., 1995). This capacity for prediction has been
attributed to an internal model that is assumed to underlie the nervous system’s remarkable
ability to adapt to unknown or underdetermined changes in the environment (Tin & Poon,
2005).
Inspired by this idea of an internal model for the sensorimotor system, we suggest that
dynamic multisensory temporal perception can be described in an analogous way. Figure 6
illustrates such an internal model of multisensory temporal perception. When there are only
individual (unrelated) multisensory inputs, the CNS may use the resolution in the
individual sensory channels to estimate the onset (or offset) time of events and from this
determine crossmodal simultaneity. However, such passive forward estimation may suffer
from differences in the neural latencies among different modalities. For example, a auditory
event is usually perceived as ‘earlier’ than a synchronous visual event (Dixon & Spitz, 1980).
When additional information is available, such as sensorimotor information, visual-motion
trajectories, or visuo-proprioceptive discrepancies, the CNS may use this information to
make a fine prediction and provide for crossmodal compensation in anticipating the
forthcoming events. Using this model, one can easily explain the small PSS found in the
visuo-motor closed-loop condition in Shi et al. (2008). The visuo-motor closed-loop helps the
CNS to make a fine prediction of the forthcoming visual events, thus partially compensating
for the delay inherent in the visual processing. The prediction mechanism can also be
applied to account for the results of the packet loss experiments (Shi et al., 2009). The visual-
feedback signal was disturbed by the packet loss, which made the video stream appear
stagnant from time to time. Such prior ‘delay’ information is used by the CNS for predicting
the timing of the forthcoming visual-haptic events. As a result, the PSS was shifted towards
visual delay. Note, however, that the use of prior information by the CNS to adjust the
crossmodal temporal representation is not immediate: the experiment outlined above (in
section 3.3) suggests that the update rate of using prior information is only of the order of 6-
12 Hz.
Fig. 6. Internal model of multisensory temporal perception.
5. Conclusion
In summary, we have provided an overview of studies concerned with visual-haptic
simultaneity perception in multimodal telepresence system. It is clear that the perception of
visual-haptic simultaneity is dynamic. In general, visual events are perceived as ‘later’ than
physically synchronous haptic events. The visual-haptic simultaneity window (indicated by
the PSS and JND parameters) may vary from dozens to hundreds of milliseconds. In
interactive virtual environments such as telepresence systems, the crossmodal simultaneity
window is influenced by other sources of information, such as sensorimotor feedback,
packet loss in the feedback signal, and prior adaptation. Packet loss in visual feedback can
bias visual-haptic judgments towards visual delay and such biases may influence even the
perception of intact (visual-collision) events. In addition, prior information may also
influence crossmodal simultaneity, however, this information is effectively taken into
account only after one hundred milliseconds or so. Finally, based on the range of empirical
evidence reviewed, we proposed that multisensory temporal perception involves an internal
process model. The results, and the proposed framework model, can be used to derive
guidelines for the design of the multimodal telepresence systems, concerning the
crossmodal temporal perception of the human operator.
6. References
Adelstein, B. D., Begault, D. R., Anderson, M. R., & Wenzel, E. M. (2003) Sensitivity to
haptic-audio asynchrony, Proceedings of the 5th international conference on Multimodal
interfaces (pp. 73-76). Vancouver, British Columbia, Canada.
Adelstein, B. D., Lee, T. G., & Ellis, S. R. (2003) Head Tracking Latency in Virtual
Environments: Psychophysics and a Model, Human Factors and Ergonomics Society
Annual Meeting Proceedings (pp. 2083-2087): Human Factors and Ergonomics
Society.
Ballantyne, G. H. (2002) Robotic surgery, telerobotic surgery, telepresence, and
telementoring. Review of early clinical results. Surgical Endoscopy 16(10), 1389-1402.
Collett, D. (2002) Modelling Binary Data (2 ed.): Chapman & Hall/CRC.
Dixon, N. F., & Spitz, L. (1980) The detection of auditory visual desynchrony, Perception
(Vol. 9, pp. 719-721).
Draper, J. V., Kaber, D. B., & Usher, J. M. (1998) Telepresence. Human Factors 40(3), 354-375.
Elliot, E. O. (1963) A Model of the Switched Telephone Network for Data Communications,
Bell System Technical Journal (Vol. 44, pp. 89-109).
Ferrell, W. R. (1966) Delayed force feedback, Human Factors (Vol. 8, pp. 449-455).
Fujisaki, W., Shimojo, S., Kashino, M., & Nishida, S. (2004) Recalibration of audiovisual
simultaneity. Nature Neuroscience 7(7), 773-778.
Gilbert, E. N. (1960) Capacity of a burst-noise channel, Bell System Technical Journal (Vol. 39,
pp. 1253-1265).
Held, R. (1993) Telepresence, time delay and adaptation. In S. R. Ellis, M. K. Kaiser & A. J.
Grunwald (Eds.), Pictorial communication in virtual and real environments (pp. 232-
246): Taylor and Francis.
Heller, M. A., & Myers, D. S. (1983) Active and passive tactual recognition of form. Journal of
General Psychology 108(2d Half), 225-229.
AdvancesinHaptics448
Hirzinger, G., Brunner, B., Dietrich, J., & Heindl, J. (1993) Sensor-based space robotics-
ROTEX and its telerobotic features, IEEE Transactions on Robotics and Automation
(Vol. 9, pp. 649-663).
Jay, C., Glencross, M., & Hubbold, R. (2007) Modeling the effects of delayed haptic and
visual feedback in a collaborative virtual environment, ACM Transactions on
Computer-Human Interaction (Vol. 14, Article 8, 1-31)
Keele, S. W. (1986) Motor control. In K. R. Boff, L. Kaufman & J. P. Thomas (Eds.), Handbook
of perception and human performance, Cognitive processes and performance (Vol. II, pp.
30-60): Wiley.
Kim, T., Zimmerman, P. M., Wade, M. J., & Weiss, C. A. (2005) The effect of delayed visual
feedback on telerobotic surgery. Surgical Endoscopy 19(5), 683-686.
Levitin, D. J., Maclean, K., Mathews, M., & Chu, L. (2000) The perception of cross-modal
simultaneity, International Journal of Computing and Anticipatory Systems (pp. 323-
329).
Mackenzie, S. I., & Ware, C. (1993) Lag as a determinant of human performance in
interactive systems, CHI '93: Proceedings of the INTERACT '93 and CHI '93 conference
on Human factors in computing systems (pp. 488-493). New York, NY, USA: ACM.
Moutoussis, K., & Zeki, S. (1997) Functional segregation and temporal hierarchy of the
visual perceptive systems. Proceedings of the Royal Society B: Biological Sciences
264(1387), 1407-1414.
Noë, A. (2005) Action in Perception. Cambridge: MIT Press.
Peer, A., Hirche, S., Weber, C., Krause, I., Buss, M., Miossec, S., et al. (2008) Intercontinental
cooperative telemanipulation between German and Japan, Proceedings of the
IEEE/RSJ International Conferences on Intelligent Robots and Systems (pp. 2715-2716).
Sheridan, T. B., & Ferrell, W. R. (1963) Remote Manipulative Control with Transmission
Delay, IEEE Transactions on Human Factors in Electronics (Vol. 4, pp. 25-29).
Shi, Z., Hirche, S., Schneider, W., & Muller, H. J. (2008) Influence of visuomotor action on
visual-haptic simultaneous perception: A psychophysical study, 2008 Symposium on
Haptic Interfaces for Virtual Environment and Teleoperator Systems (pp. 65-70).
Shi, Z., Zou, H., Rank, M., Chen, L., Hirche, S., & Müller, H. J. (2009) Effects of packet loss
and latency on temporal discrimination of visual-haptic events. IEEE Transactions
on Haptics, in press.
Spence, C., Shore, D. I., & Klein, R. M. (2001) Multisensory prior entry, Journal of
Experimental Psychology: General (Vol. 130, pp. 799-832).
Stone, J. V., Hunkin, N. M., Porrill, J., Wood, R., Keeler, V., Beanland, M., et al. (2001) When
is now? Perception of simultaneity, Proceedings of the Royal Society B: Biological
Sciences (Vol. 268, pp. 31-38).
Sugita, Y., & Suzuki, Y. (2003) Audiovisual perception: Implicit estimation of sound-arrival
time. Nature 421(6926), 911.
Tin, C., & Poon, C. S. (2005) Internal models in sensorimotor integration: perspectives from
adaptive control theory. Journal of Neural Engineering 2(3), S147-163.
van Beers, R. J., Sittig, A. C., & Gon, J. J. (1999) Integration of proprioceptive and visual
position-information: An experimentally supported model. Journal of
Neurophysiology 81(3), 1355-1364.
van Erp, J. B. F., & Werkhoven, P. J. (2004) Vibro-tactile and visual asynchronies: Sensitivity
and consistency, Perception (Vol. 33, pp. 103-111).
Vatakis, A., & Spence, C. (2006) Evaluating the influence of frame rate on the temporal
aspects of audiovisual speech perception, Neuroscience Letters (Vol. 405, pp. 132-
136).
Vogels, I. M. (2004) Detection of temporal delays in visual-haptic interfaces. Human Factors
46(1), 118-134.
Wexler, M., & Klam, F. (2001) Movement prediction and movement production. Journal of
Experimental Psychology: Human Perception and Performance 27(1), 48-64.
Witney, A. G., Goodbody, S. J., & Wolpert, D. M. (1999) Predictive motor learning of
temporal delays. Journal of Neurophysiology 82(5), 2039-2048.
Wolpert, D. M. (1997) Computational approaches to motor control. Trends in Cognitive
Sciences 1(6), 209-216.
Wolpert, D. M., & Ghahramani, Z. (2000) Computational principles of movement
neuroscience. Nature Neuroscience 3 Suppl, 1212-1217.
Wolpert, D. M., Ghahramani, Z., & Jordan, M. I. (1995) An internal model for sensorimotor
integration. Science 269(5232), 1880-1882.
Temporalperceptionofvisual-hapticeventsinmultimodaltelepresencesystem 449
Hirzinger, G., Brunner, B., Dietrich, J., & Heindl, J. (1993) Sensor-based space robotics-
ROTEX and its telerobotic features, IEEE Transactions on Robotics and Automation
(Vol. 9, pp. 649-663).
Jay, C., Glencross, M., & Hubbold, R. (2007) Modeling the effects of delayed haptic and
visual feedback in a collaborative virtual environment, ACM Transactions on
Computer-Human Interaction (Vol. 14, Article 8, 1-31)
Keele, S. W. (1986) Motor control. In K. R. Boff, L. Kaufman & J. P. Thomas (Eds.), Handbook
of perception and human performance, Cognitive processes and performance (Vol. II, pp.
30-60): Wiley.
Kim, T., Zimmerman, P. M., Wade, M. J., & Weiss, C. A. (2005) The effect of delayed visual
feedback on telerobotic surgery. Surgical Endoscopy 19(5), 683-686.
Levitin, D. J., Maclean, K., Mathews, M., & Chu, L. (2000) The perception of cross-modal
simultaneity, International Journal of Computing and Anticipatory Systems (pp. 323-
329).
Mackenzie, S. I., & Ware, C. (1993) Lag as a determinant of human performance in
interactive systems, CHI '93: Proceedings of the INTERACT '93 and CHI '93 conference
on Human factors in computing systems (pp. 488-493). New York, NY, USA: ACM.
Moutoussis, K., & Zeki, S. (1997) Functional segregation and temporal hierarchy of the
visual perceptive systems. Proceedings of the Royal Society B: Biological Sciences
264(1387), 1407-1414.
Noë, A. (2005) Action in Perception. Cambridge: MIT Press.
Peer, A., Hirche, S., Weber, C., Krause, I., Buss, M., Miossec, S., et al. (2008) Intercontinental
cooperative telemanipulation between German and Japan, Proceedings of the
IEEE/RSJ International Conferences on Intelligent Robots and Systems (pp. 2715-2716).
Sheridan, T. B., & Ferrell, W. R. (1963) Remote Manipulative Control with Transmission
Delay, IEEE Transactions on Human Factors in Electronics (Vol. 4, pp. 25-29).
Shi, Z., Hirche, S., Schneider, W., & Muller, H. J. (2008) Influence of visuomotor action on
visual-haptic simultaneous perception: A psychophysical study, 2008 Symposium on
Haptic Interfaces for Virtual Environment and Teleoperator Systems (pp. 65-70).
Shi, Z., Zou, H., Rank, M., Chen, L., Hirche, S., & Müller, H. J. (2009) Effects of packet loss
and latency on temporal discrimination of visual-haptic events. IEEE Transactions
on Haptics, in press.
Spence, C., Shore, D. I., & Klein, R. M. (2001) Multisensory prior entry, Journal of
Experimental Psychology: General (Vol. 130, pp. 799-832).
Stone, J. V., Hunkin, N. M., Porrill, J., Wood, R., Keeler, V., Beanland, M., et al. (2001) When
is now? Perception of simultaneity, Proceedings of the Royal Society B: Biological
Sciences (Vol. 268, pp. 31-38).
Sugita, Y., & Suzuki, Y. (2003) Audiovisual perception: Implicit estimation of sound-arrival
time. Nature 421(6926), 911.
Tin, C., & Poon, C. S. (2005) Internal models in sensorimotor integration: perspectives from
adaptive control theory. Journal of Neural Engineering 2(3), S147-163.
van Beers, R. J., Sittig, A. C., & Gon, J. J. (1999) Integration of proprioceptive and visual
position-information: An experimentally supported model. Journal of
Neurophysiology 81(3), 1355-1364.
van Erp, J. B. F., & Werkhoven, P. J. (2004) Vibro-tactile and visual asynchronies: Sensitivity
and consistency, Perception (Vol. 33, pp. 103-111).
Vatakis, A., & Spence, C. (2006) Evaluating the influence of frame rate on the temporal
aspects of audiovisual speech perception, Neuroscience Letters (Vol. 405, pp. 132-
136).
Vogels, I. M. (2004) Detection of temporal delays in visual-haptic interfaces. Human Factors
46(1), 118-134.
Wexler, M., & Klam, F. (2001) Movement prediction and movement production. Journal of
Experimental Psychology: Human Perception and Performance 27(1), 48-64.
Witney, A. G., Goodbody, S. J., & Wolpert, D. M. (1999) Predictive motor learning of
temporal delays. Journal of Neurophysiology 82(5), 2039-2048.
Wolpert, D. M. (1997) Computational approaches to motor control. Trends in Cognitive
Sciences 1(6), 209-216.
Wolpert, D. M., & Ghahramani, Z. (2000) Computational principles of movement
neuroscience. Nature Neuroscience 3 Suppl, 1212-1217.
Wolpert, D. M., Ghahramani, Z., & Jordan, M. I. (1995) An internal model for sensorimotor
integration. Science 269(5232), 1880-1882.
AdvancesinHaptics450
OntheInuenceofHandDynamics
onMotionPlanningofReachingMovementsinHapticEnvironments 451
On the Inuence of Hand Dynamics on Motion Planning of Reaching
MovementsinHapticEnvironments
IgorGoncharenko,MikhailSvinin,ShigeyukiHosoeandSvenForstmann
X
On the Influence of Hand Dynamics
on Motion Planning of Reaching
Movements in Haptic Environments
Igor Goncharenko, Mikhail Svinin, Shigeyuki Hosoe and Sven Forstmann
3D Incorporated, the Institute of Physical and Chemical Research (RIKEN)
Japan
Abstract
The paper presents an analysis of human reaching movements in the manipulation of
flexible objects. Two models, the minimum hand jerk and the minimum driving hand force-
change, are used for modelling and verification of experimental data. The data are collected
with the haptic system supporting dynamic simulation of the flexible object in real time. We
describe some initial experimental results and analyze the applicability of the models. It is
found that even for short-term movements human motion planning strategy can depend on
arm inertia and configuration. This conclusion is based on the experimental evidence of the
multi-phased hand velocity profiles that can be well captured by the minimum driving hand
force-change criterion. To support the latest observation, an experiment with reinforcement
learning was conducted.
1. Introduction
Recently, reproducing of human-like motions has become a focus of attention in many
research fields such as human motor control and perception, humanoid robotics, robotic
rehabilitation and assistance (Pollick et al., 2005; Tsuji et al., 2002; Amirabdollahian et al.,
2002). In a bio-mimetic analogy, the human arm can be considered as a chain of rigid bodies
actuated by driving mechanisms (muscles) and controlled by a computer (central nervous
system, CNS), which might by instructive for the design of control systems for advanced
manipulators. However, little is known about actual motion strategies planned by the CNS.
Human motion planning models available in the literature are mostly remained
phenomenological and descriptive – they rely on bulky experimental measurements done
with motion capturing systems, encephalographs, feedback force devices, etc. On the other
hand, the models based on optimal control methods are very attractive because they take
into account trajectory formation, boundary conditions, and dynamic properties of the arm
and environment. In addition, minimized performance indexes may have a natural
interpretation related to human behaviour.
24
AdvancesinHaptics452
When humans make rest-to-rest movements in free space, there is, in principle, an infinite
choice of trajectories. However, many studies have shown that human subjects tend to
choose unique trajectories with invariant features. First, hand paths in rest-to-rest
movements tend to be straight (or, slightly curved) and smooth. Second, the velocity profile
of the hand trajectory is bell-shaped (Morasso, 1981; Abend et al., 1982). It is well established
that for unconstrained reaching movements, the trajectory of human hand can be predicted
with reasonable accuracy by the minimum hand jerk criterion (MJC) (Flash & Hogan, 1985).
More generally, in the optimization approaches, the trajectory is predicted by minimizing,
over the movement time T an integral performance index
subject to zero boundary
conditions imposed on start and end points, corresponding to the rest-to-rest states. The
performance index can be formulated in the joint space, in the task space normally
associated with the human hand, or in the task space of object coordinates.
When movement is constrained by a 3D curve (door opening is a typical example of
constrained movement), there is no uncertainty in spatial trajectory, but the temporal hand
velocity profile becomes an important indicative of human hand control. Haptic
technologies afford great opportunities for studying human motion planning because
virtually any constraints and dynamic environments can be probed for verifying optimality
criteria. For example, in studying multi-mass object transport using a PHANToM -based
haptic interface (Svinin et al., 2006a; Svinin et al., 2006b), it was shown that the MJC models
hand movement much better than the lowest order polynomial model that is common in
control of robotic and mechatronic systems with flexible elements. This led to the conclusion
that the CNS plans reaching movements in the hand space coordinates rather than in the
object space. It was speculated that the trajectories of the human arm in comfortable
reaching movements can be predicted without taking into account the inertial properties of
the arm, which gave a good reason to believe that the arm dynamics are already “prewired”
in the CNS while the object dynamics (the novel environment) are acquired by learning. In
(Goncharenko et al., 2006) different curvature types of 3D constraints were considered for
the tasks of rest-to-rest rigid body movement and bimanual crank rotation. Among several
performance indexes, only two criteria were confirmed to be the best candidates for the
description of motion control in the tasks: MJC and the minimum force change criterion
(MFCC).
Roughly speaking, the MFCC is a dynamic version of the MJC. While the latter ignores
inertial properties of the human arm, the former takes them into account. Both these criteria
give very close results for the hand velocity profiles if the stiffness of the haptic device is
high enough, or, if the transported object is relatively lightweight. In general, however, the
theoretical predictions by these criteria can be very different (Svinin et al., 2006c). It is
therefore important to design experiments that would help to distinguish between the two
criteria and demonstrate the correct choice of one of them. This constitutes the main goal of
this paper: to demonstrate experimentally that the hand mass-inertia properties and
configuration cannot be ignored in prediction of human motion planning in highly dynamic
environment.
This chapter is organized as follows. The next section formulates the MJC and MFCC for the
task of a rest-to-rest transport of a flexible object and introduces a concept of dynamically
equivalent configurations. Sections 3 and 4 describe primary experiments with a haptic
system for two dynamic configurations. Section 5 describes experiments with reinforcement
learning, and the last section concludes the chapter.
2. Optimality criteria for the task of rest-to-rest mass transport
A model of rest-to-rest movements is shown in Figure 1. The object is connected to the hand
by a virtual spring of initial zero length. In the initial configuration, the positions of the hand
and the object coincide. A human subject is asked to make reaching movement of length L
and time T and stop the object without excitation of oscillations. For this task, the MJC and
its dynamic constraint are:
2
3 3
0
, (1)
1
/
2
( ) 0, (2)
T
o o o h
MJC h
m
d x dt dt
x k x x
where x
h
is the coordinate of the human hand, x
o
is the object coordinate, m
o
is the mass of
the object, and k is the stiffness of the spring. Defining the natural frequency
/
o o
k m
and expressing x
h
through x
o
using (2), criterion (1) can be rewritten as:
2
0
(5) 2 (3)
4
1
. (3)
2
T
MJC o o o
o
x x dt
Fig. 1. Model of reaching movement in dynamic environment
The boundary conditions corresponded to rest-to-rest states under the dynamic constraint
(2) for both, hand and object, can be also expressed only through x
o
:
(0) 0, (0) 0, (0) 0, (0) 0, (0) 0,
( ) , ( ) 0, ( ) 0, ( ) 0, ( ) 0.
o o o o o
o o o o o
x x x x x
x T L x T x T x T x T
The solution of the problem (1,2) can be represented as a combination of 5-th order
polynomial and trigonometric terms as was proven in (Svinin et al., 2006a; Svinin et al.,
2006b) .
It was also shown that the hand velocity profile, corresponding to this solution, can have
either one phase (bell-shaped) or two phases while the object velocity is always single
phased. For example, in Figure 2 the hand velocity for the MJC is shown by thick black line
OntheInuenceofHandDynamics
onMotionPlanningofReachingMovementsinHapticEnvironments 453
When humans make rest-to-rest movements in free space, there is, in principle, an infinite
choice of trajectories. However, many studies have shown that human subjects tend to
choose unique trajectories with invariant features. First, hand paths in rest-to-rest
movements tend to be straight (or, slightly curved) and smooth. Second, the velocity profile
of the hand trajectory is bell-shaped (Morasso, 1981; Abend et al., 1982). It is well established
that for unconstrained reaching movements, the trajectory of human hand can be predicted
with reasonable accuracy by the minimum hand jerk criterion (MJC) (Flash & Hogan, 1985).
More generally, in the optimization approaches, the trajectory is predicted by minimizing,
over the movement time T an integral performance index
subject to zero boundary
conditions imposed on start and end points, corresponding to the rest-to-rest states. The
performance index can be formulated in the joint space, in the task space normally
associated with the human hand, or in the task space of object coordinates.
When movement is constrained by a 3D curve (door opening is a typical example of
constrained movement), there is no uncertainty in spatial trajectory, but the temporal hand
velocity profile becomes an important indicative of human hand control. Haptic
technologies afford great opportunities for studying human motion planning because
virtually any constraints and dynamic environments can be probed for verifying optimality
criteria. For example, in studying multi-mass object transport using a PHANToM -based
haptic interface (Svinin et al., 2006a; Svinin et al., 2006b), it was shown that the MJC models
hand movement much better than the lowest order polynomial model that is common in
control of robotic and mechatronic systems with flexible elements. This led to the conclusion
that the CNS plans reaching movements in the hand space coordinates rather than in the
object space. It was speculated that the trajectories of the human arm in comfortable
reaching movements can be predicted without taking into account the inertial properties of
the arm, which gave a good reason to believe that the arm dynamics are already “prewired”
in the CNS while the object dynamics (the novel environment) are acquired by learning. In
(Goncharenko et al., 2006) different curvature types of 3D constraints were considered for
the tasks of rest-to-rest rigid body movement and bimanual crank rotation. Among several
performance indexes, only two criteria were confirmed to be the best candidates for the
description of motion control in the tasks: MJC and the minimum force change criterion
(MFCC).
Roughly speaking, the MFCC is a dynamic version of the MJC. While the latter ignores
inertial properties of the human arm, the former takes them into account. Both these criteria
give very close results for the hand velocity profiles if the stiffness of the haptic device is
high enough, or, if the transported object is relatively lightweight. In general, however, the
theoretical predictions by these criteria can be very different (Svinin et al., 2006c). It is
therefore important to design experiments that would help to distinguish between the two
criteria and demonstrate the correct choice of one of them. This constitutes the main goal of
this paper: to demonstrate experimentally that the hand mass-inertia properties and
configuration cannot be ignored in prediction of human motion planning in highly dynamic
environment.
This chapter is organized as follows. The next section formulates the MJC and MFCC for the
task of a rest-to-rest transport of a flexible object and introduces a concept of dynamically
equivalent configurations. Sections 3 and 4 describe primary experiments with a haptic
system for two dynamic configurations. Section 5 describes experiments with reinforcement
learning, and the last section concludes the chapter.
2. Optimality criteria for the task of rest-to-rest mass transport
A model of rest-to-rest movements is shown in Figure 1. The object is connected to the hand
by a virtual spring of initial zero length. In the initial configuration, the positions of the hand
and the object coincide. A human subject is asked to make reaching movement of length L
and time T and stop the object without excitation of oscillations. For this task, the MJC and
its dynamic constraint are:
2
3 3
0
, (1)
1
/
2
( ) 0, (2)
T
o o o h
MJC h
m
d x dt dt
x k x x
where x
h
is the coordinate of the human hand, x
o
is the object coordinate, m
o
is the mass of
the object, and k is the stiffness of the spring. Defining the natural frequency
/
o o
k m
and expressing x
h
through x
o
using (2), criterion (1) can be rewritten as:
2
0
(5) 2 (3)
4
1
. (3)
2
T
MJC o o o
o
x x dt
Fig. 1. Model of reaching movement in dynamic environment
The boundary conditions corresponded to rest-to-rest states under the dynamic constraint
(2) for both, hand and object, can be also expressed only through x
o
:
(0) 0, (0) 0, (0) 0, (0) 0, (0) 0,
( ) , ( ) 0, ( ) 0, ( ) 0, ( ) 0.
o o o o o
o o o o o
x x x x x
x T L x T x T x T x T
The solution of the problem (1,2) can be represented as a combination of 5-th order
polynomial and trigonometric terms as was proven in (Svinin et al., 2006a; Svinin et al.,
2006b) .
It was also shown that the hand velocity profile, corresponding to this solution, can have
either one phase (bell-shaped) or two phases while the object velocity is always single
phased. For example, in Figure 2 the hand velocity for the MJC is shown by thick black line
AdvancesinHaptics454
and the object velocity by thin black line. The graphs are given for T=1.15s, k=150N/m, m
o
=
3.2kg, L=0.2m.
0
.2
0
.4
0
.6
0
.8
1
t
0.1
0.2
0.3
0.4
v
Fig. 2. Velocity profiles for MJC and MFCC
Unlike the MJC, the MFCC takes into account the hand dynamics:
2
0
, (4)
1
2
( ) , (5)
T
h h o h
MFCC
m
f dt
x k x x f
where m
h
is the mass of the hand and f stands for the driving hand force. Again, we can
rewrite the criterion (4) to the form similar to (3), taking into account (2), (5), and defining
the natural frequency
1
o
, and the mass ratio
= m
o
/ m
h
. Then,
2
2
(5) 2 (3)
0
(6)
1
.
2
MFCC
T
h o
o o
m m
k
x x dt
From (6) and (3) it can be seen that the MFCC converges to the MJC when
<<1. However,
for non-infinitesimal
, additional parameter m
h
influences on the solution for (6)
significantly. Namely, there can be more than two phases in the hand velocity profile. In
Figure 2 hand velocity for MFCC is shown by the thick grey line, and the object velocity is
given by the thin grey line (T=1.15s, k=150N/m, m
o
=3.2kg, m
h
=0.8kg, L=0.2m). Complete
solution and theoretical properties of the MFCC are given in (Svinin et al., 2006c). The
portrait of the phase transition for the MFCC is shown in Figure 3, where the numbers
inside the areas correspond to the number of phases.
In this figure, point A corresponds to the parameters used to calculate profiles shown in
Figure 2 (
T=17.6,
= m
o
/m
h
=4).
Note that one point on the non-dimensional phase diagram can correspond to two different
sets of physical parameters. In this connection we can define dynamically equivalent systems as
systems correspondent to the same point on the phase transition diagram. Define
T
.
Assume that we have two sets of parameters. One set
1 1 1 1
( , , , )
h o o
m m k T is characterized
by
1 1 1
/
o h
m m
,
1 1 1 1 1
(1 ) /
o o
T k m
and the other set
2 2 2 2
( , , , )
h o o
m m k T is
characterized by
2 2 2
/
o h
m m
,
2 2 2 2 2
(1 ) /
o o
T k m
. Two systems are
dynamically equivalent if
1 2
and
1 2
, which gives
1 2 1 2
1 2
1 2 1 2
,
o o o o
h h o o
m m k k
T T
m m m m
.
Fig. 3. Diagram of phase transition of the hand velocity profiles for MFCC
3. Experiment plan and setup configuration
It is interesting that for fixed m
h
, T, and L velocity profiles yielding solutions for (3) and (6)
are exactly the same for various m
o
and k, which maintain constant
and
o
. Then, to make
conclusion in favour of either the MJC or the MFCC for each subject, we may select two
different parameter sets, which are dynamically equivalent to the parameters used for hand
velocity calculations. The profiles depicted in Figure 2 are clearly two-phased (MJC) and
three-phased (MFCC), and their magnitudes are significantly different. Of course, we cannot
expect that each subject’s “effective” hand mass is close to 0.8kg. Because of the ergonomic
of experimental layout forearm mass can partially contribute to the “effective” mass.
Standard anthropometric mass of human forearm is 1.48kg (Chandler et al., 1976), however,
the uncertainty in m
h
can vary from 0.5 to 1.5 kg, or even more if arm joints are not fixed. To
avoid this confusion, we completed two experimental series for each subject using the
concept of dynamically equivalent systems in the following manner.
Step 1. As a zero-guess, we assume m
h
=0.8kg and set other parameters as T=1.15s, k=150
N/m, m
o
=3.2 kg, L=0.2m. When a subject completes a long series of trials, we compare his
average hand velocity profile with ones shown in Figure 2. If the average profile is three-
phased and closely matched to the MFCC curve, we conclude that the MFCC criteria is
preferable, and the hand mass is very close to 0.8 kg. Otherwise, the next step is completed.
OntheInuenceofHandDynamics
onMotionPlanningofReachingMovementsinHapticEnvironments 455
and the object velocity by thin black line. The graphs are given for T=1.15s, k=150N/m, m
o
=
3.2kg, L=0.2m.
0
.2
0
.4
0
.6
0
.8
1
t
0.1
0.2
0.3
0.4
v
Fig. 2. Velocity profiles for MJC and MFCC
Unlike the MJC, the MFCC takes into account the hand dynamics:
2
0
, (4)
1
2
( ) , (5)
T
h h o h
MFCC
m
f dt
x k x x f
where m
h
is the mass of the hand and f stands for the driving hand force. Again, we can
rewrite the criterion (4) to the form similar to (3), taking into account (2), (5), and defining
the natural frequency
1
o
, and the mass ratio
= m
o
/ m
h
. Then,
2
2
(5) 2 (3)
0
(6)
1
.
2
MFCC
T
h o
o o
m m
k
x x dt
From (6) and (3) it can be seen that the MFCC converges to the MJC when
<<1. However,
for non-infinitesimal
, additional parameter m
h
influences on the solution for (6)
significantly. Namely, there can be more than two phases in the hand velocity profile. In
Figure 2 hand velocity for MFCC is shown by the thick grey line, and the object velocity is
given by the thin grey line (T=1.15s, k=150N/m, m
o
=3.2kg, m
h
=0.8kg, L=0.2m). Complete
solution and theoretical properties of the MFCC are given in (Svinin et al., 2006c). The
portrait of the phase transition for the MFCC is shown in Figure 3, where the numbers
inside the areas correspond to the number of phases.
In this figure, point A corresponds to the parameters used to calculate profiles shown in
Figure 2 (
T=17.6,
= m
o
/m
h
=4).
Note that one point on the non-dimensional phase diagram can correspond to two different
sets of physical parameters. In this connection we can define dynamically equivalent systems as
systems correspondent to the same point on the phase transition diagram. Define
T
.
Assume that we have two sets of parameters. One set
1 1 1 1
( , , , )
h o o
m m k T is characterized
by
1 1 1
/
o h
m m
,
1 1 1 1 1
(1 ) /
o o
T k m
and the other set
2 2 2 2
( , , , )
h o o
m m k T is
characterized by
2 2 2
/
o h
m m
,
2 2 2 2 2
(1 ) /
o o
T k m
. Two systems are
dynamically equivalent if
1 2
and
1 2
, which gives
1 2 1 2
1 2
1 2 1 2
,
o o o o
h h o o
m m k k
T T
m m m m
.
Fig. 3. Diagram of phase transition of the hand velocity profiles for MFCC
3. Experiment plan and setup configuration
It is interesting that for fixed m
h
, T, and L velocity profiles yielding solutions for (3) and (6)
are exactly the same for various m
o
and k, which maintain constant
and
o
. Then, to make
conclusion in favour of either the MJC or the MFCC for each subject, we may select two
different parameter sets, which are dynamically equivalent to the parameters used for hand
velocity calculations. The profiles depicted in Figure 2 are clearly two-phased (MJC) and
three-phased (MFCC), and their magnitudes are significantly different. Of course, we cannot
expect that each subject’s “effective” hand mass is close to 0.8kg. Because of the ergonomic
of experimental layout forearm mass can partially contribute to the “effective” mass.
Standard anthropometric mass of human forearm is 1.48kg (Chandler et al., 1976), however,
the uncertainty in m
h
can vary from 0.5 to 1.5 kg, or even more if arm joints are not fixed. To
avoid this confusion, we completed two experimental series for each subject using the
concept of dynamically equivalent systems in the following manner.
Step 1. As a zero-guess, we assume m
h
=0.8kg and set other parameters as T=1.15s, k=150
N/m, m
o
=3.2 kg, L=0.2m. When a subject completes a long series of trials, we compare his
average hand velocity profile with ones shown in Figure 2. If the average profile is three-
phased and closely matched to the MFCC curve, we conclude that the MFCC criteria is
preferable, and the hand mass is very close to 0.8 kg. Otherwise, the next step is completed.
AdvancesinHaptics456
Step 2. Using a curve matching procedure, we estimate new “effective” m
h
, recalculate new
dynamically equivalent parameters k and m
o
, and ask the subject to repeat the experimental
trials. Hand mass and velocities are analyzed again after completing the series.
To analyze human movements, we reconfigure our experimental setup (Figure 4) previously
used for multi-mass object movement analysis (Goncharenko et al., 2006). In the setup, a
haptic device (1.5/3DOF PHANToM, maximum exertable force 8.5N) was connected to a
computer (dual core 3.0 GHz CPU).
Fig. 4. Experimental setup
Five naïve right-handed male subjects were selected to participate in the experiment. The
subjects were instructed to move a virtual flexible object “connected” to the human hand by
the PHANToM stylus. The hand & object system was at rest at the start point. The subjects
were requested to move the object and smoothly stop both the hand and the object at a
target point. The subject made these rest-to-rest movements along a straight line (in the
direction from left to right) in the horizontal plane using the PHANToM stylus. The
travelling distance was set as L = 0.2m. The object dynamics were simulated using the 4th-
order Runge-Kutta method with fixed time step Δt = 0.001s correspondent to the
PHANToM cycle. The data regarding the position, velocity of the hand and the simulated
object were recorded at 100 Hz. (Stylus position and velocity are measured by the
hardware.) PHANToM feedback forces and object acceleration were recorded as well. The
subjects were requested to produce the specified reaching movement in a natural way, on
their own pace, trying to make as many successful trials as possible. To count successful
trials we introduced the following set of tolerances: object and hand final position
0.2±0.005m, object and hand final velocity 0±0.05 m/s, object final acceleration 0±0.16 m/s
2
,
hand start velocity 0±0.05m/s, trial total time 1±0.2s. The reaching task is successful when
the simulation and hardware-measured data obey all the above tolerances, then haptic
interaction is stopped and an audio signal prompts the users to proceed with the next trial.
Unlike in our previous experiments with multi-mass objects (Svinin et al., 2006a), the time
tolerance is very narrow because the solutions of tasks (1), (4) are sensitive to T. To prompt
the subjects that they are within the time window, we implemented additional visual
feedback in the system (a colored semaphore). Taking into account that the initial hand
speed tolerance is not relevant to the target point, the described task was expected to be
difficult and sport-like, without high success rate. In order to collect statistically
representative datasets, the subjects were asked to complete 2000 trials each, equally split in
two days, but with different object configurations.
4. Preliminary experimental results
When all the subjects completed the first series of 1000 trials on Day 1, parameters m
h
, m
o
, k,
were changed, the setup was reconfigured, and the subjects had to complete new 1000-trial
series with new configuration on Day 2. In our previous experiments (Svinin et al., 2006a) a
stable growth of motor learning progress (trial success rate) was observed. In this difficult
task with the narrow tolerance windows, total success rate was low, about 15% or lower, but
still sufficient for statistical analysis (Table 1.). On the average, the second configuration was
more difficult for the subjects. There were no obvious learning progress trends inside
individual series as well: all the subjects shortly catch their own control strategy after
approximately 100-200 first trials, and then the success rate remains various, locally
oscillating around 10-15% (see Figure 5 as an example). Sometimes the successful trials
followed one-by-one, and sometimes the subjects lost their control strategy for a long
period. After 500 trials the subjects took breaks of about 15-20min.
Table 1. Motor learning rate (success, %)
Fig. 5. Individual learning history (subject S3, Day 1)
Reaching time for successful trials varied within the time tolerance window (from 0.8s to
1.2s) on the average was shifted, but very close to 1.15s for each subject (Table 2). It makes it
possible to correctly map each individual trial profile to the unified time interval of 1.15s.
Subject Day 1 (1000 trials) Day 2 (1000 trials)
S1 272 (27.2%) 71 (7.1%)
S2 149 (14.9%) 42 (4.2%)
S3 119 (11.9%) 72 (7.2%)
S4 280 (28.0%) 178 (17.8%)
S5 105 (10.5%) 120 (12.0%)
OntheInuenceofHandDynamics
onMotionPlanningofReachingMovementsinHapticEnvironments 457
Step 2. Using a curve matching procedure, we estimate new “effective” m
h
, recalculate new
dynamically equivalent parameters k and m
o
, and ask the subject to repeat the experimental
trials. Hand mass and velocities are analyzed again after completing the series.
To analyze human movements, we reconfigure our experimental setup (Figure 4) previously
used for multi-mass object movement analysis (Goncharenko et al., 2006). In the setup, a
haptic device (1.5/3DOF PHANToM, maximum exertable force 8.5N) was connected to a
computer (dual core 3.0 GHz CPU).
Fig. 4. Experimental setup
Five naïve right-handed male subjects were selected to participate in the experiment. The
subjects were instructed to move a virtual flexible object “connected” to the human hand by
the PHANToM stylus. The hand & object system was at rest at the start point. The subjects
were requested to move the object and smoothly stop both the hand and the object at a
target point. The subject made these rest-to-rest movements along a straight line (in the
direction from left to right) in the horizontal plane using the PHANToM stylus. The
travelling distance was set as L = 0.2m. The object dynamics were simulated using the 4th-
order Runge-Kutta method with fixed time step Δt = 0.001s correspondent to the
PHANToM cycle. The data regarding the position, velocity of the hand and the simulated
object were recorded at 100 Hz. (Stylus position and velocity are measured by the
hardware.) PHANToM feedback forces and object acceleration were recorded as well. The
subjects were requested to produce the specified reaching movement in a natural way, on
their own pace, trying to make as many successful trials as possible. To count successful
trials we introduced the following set of tolerances: object and hand final position
0.2±0.005m, object and hand final velocity 0±0.05 m/s, object final acceleration 0±0.16 m/s
2
,
hand start velocity 0±0.05m/s, trial total time 1±0.2s. The reaching task is successful when
the simulation and hardware-measured data obey all the above tolerances, then haptic
interaction is stopped and an audio signal prompts the users to proceed with the next trial.
Unlike in our previous experiments with multi-mass objects (Svinin et al., 2006a), the time
tolerance is very narrow because the solutions of tasks (1), (4) are sensitive to T. To prompt
the subjects that they are within the time window, we implemented additional visual
feedback in the system (a colored semaphore). Taking into account that the initial hand
speed tolerance is not relevant to the target point, the described task was expected to be
difficult and sport-like, without high success rate. In order to collect statistically
representative datasets, the subjects were asked to complete 2000 trials each, equally split in
two days, but with different object configurations.
4. Preliminary experimental results
When all the subjects completed the first series of 1000 trials on Day 1, parameters m
h
, m
o
, k,
were changed, the setup was reconfigured, and the subjects had to complete new 1000-trial
series with new configuration on Day 2. In our previous experiments (Svinin et al., 2006a) a
stable growth of motor learning progress (trial success rate) was observed. In this difficult
task with the narrow tolerance windows, total success rate was low, about 15% or lower, but
still sufficient for statistical analysis (Table 1.). On the average, the second configuration was
more difficult for the subjects. There were no obvious learning progress trends inside
individual series as well: all the subjects shortly catch their own control strategy after
approximately 100-200 first trials, and then the success rate remains various, locally
oscillating around 10-15% (see Figure 5 as an example). Sometimes the successful trials
followed one-by-one, and sometimes the subjects lost their control strategy for a long
period. After 500 trials the subjects took breaks of about 15-20min.
Table 1. Motor learning rate (success, %)
Fig. 5. Individual learning history (subject S3, Day 1)
Reaching time for successful trials varied within the time tolerance window (from 0.8s to
1.2s) on the average was shifted, but very close to 1.15s for each subject (Table 2). It makes it
possible to correctly map each individual trial profile to the unified time interval of 1.15s.
Subject Day 1 (1000 trials) Day 2 (1000 trials)
S1 272 (27.2%) 71 (7.1%)
S2 149 (14.9%) 42 (4.2%)
S3 119 (11.9%) 72 (7.2%)
S4 280 (28.0%) 178 (17.8%)
S5 105 (10.5%) 120 (12.0%)
AdvancesinHaptics458
Table 2. Reaching time
We re-estimated new hand mass
*
h
m after Day 1 and Day2, using the following curve
matching criterion (integral RMS):
2
*
1 1
(7)
1
arg min ( , ) ( )
h
M N
h pr i h j i
m
j i
m v t m v t
M
where N is the number of measurements in each successful trial, M is the number of
successful trials,
,
pr j
v v are predicted and experimental hand velocities. Therefore,
different dynamic configurations (m
h
, m
o
, k) were used on Day1 and Day2 (Table 3).
Table 3. System configuration parameters for individual subjects
Initially, the subjects were not instructed to fix elbow or shoulder joints. It is interesting, that
only subject S5 found his own comfortable arm configuration – he fixed his elbow joint in
both experimental days, while other subjects did not fixed. It can partially explain the fact
that the estimated hand masses are higher for subjects S1-S4 after Day 1 (Table 3).
After Day 1 subjects S1-S4 demonstrated slightly left-skewed two-phased hand velocity
profiles with the maximal magnitude less than 30 cm/s. The profile form cannot be
explained quantitatively neither by MJC, nor by the MHCC for the hand mass m
h
=0.8 kg.
However, matching criterion (7) formally, one can find optimal m
h
for MHCC which is
significantly different (after Day 1 and Day 2) from the initallly supposed hand mass.
Moreover, the matching error is lower for the MHCC than for MJC. Figure 6 (left) shows
that the error by the MJC is 0.057 while the error by the MHCC is 0.04 at the optimal
“effective” hand mass 1.4kg. In the right part of the Figure 6 the gray thick line shows
average experimental hand velocity profile, and two black thick lines depict the profiles
predicted by the MJC (two-phased) and the MHCC (three-phased) for m
h
=0.8 kg. Finding
Subject Day 1 Day 2
Average RMS Average RMS
S1 1.08s 0.051s 1.17s 0.028s
S2 1.16s 0.027s 1.17s 0.021s
S3 1.12s 0.050s 1.15s 0.034s
S4 1.13s 0.036s 1.16s 0.026s
S5 1.14s 0.038s 1.15s 0.032s
Initial
configuration
(m
h
, m
o
, k)
Configuration
after Day 1
(m
h
, m
o
, k)
Hand mass
estimated
after Day 2
S1 0.8, 3.2, 150 1.3, 5.1, 239 1.5
S2 0.8, 3.2, 150 1.4, 5.4, 253 2.1
S3 0.8, 3.2, 150 1.1, 4.4, 206 1.4
S4 0.8, 3.2, 150 1.1, 4.4, 206 2.3
S5 0.8, 3.2, 150 0.9, 3.6, 169 0.9
the optimal “effective” hand masses and using the principle of dynamically equivalent
systems, the haptic simulator was reconfigured after Day 1 as ahown in Table 3, and the
experiments were repeated on Day 2. Nevertheless, the experimental hand velocity profiles
remained two-phased for subjects S1-S4, with the magnitude less than 30cm/s. The second
estimation by criterion (7) showed that there is an uncertainty in the “effective” hand masses
for subjects S1-S4.
Fig. 6. Matching error and hand velocity profiles for subject S2 (after Day 1)
At the same time, statisticaly representative results for subject S5 (with fixed elbow joint) are
strongly in favour of the MFCC. Figure 7 shows the experimental and predicted by the
MHCC (at m
h
=0.9 kg) hand velocities for subject S5. Thick grey and black lines are the
average experimental and predicted profiles, and the thin grey lines depict last 30 successful
trials on each experimental day. Matching by the criterion (7) showed that the re-estimated
“effective” hand mass (0.9kg) is very close to the initial estimation (0.8kg).
Fig. 7. Hand velocity profiles for subject S5 (left - after Day 1, right – after Day 2)
The only difference between subjects S5 and S1-S4 is that S5 fixed his elbow joint placing the
elbow on a stand. Obviously, different muscle groups worked for S5 and S1-S4, and physical
limits of S1-S4 could not allow them to reach velocity higher than 30cm/s. Also, the
significant difference between hand masses estimated after Day 1 and 2 for S1-S4 means that
modelling of the “effective” hand mass via a point mass is dubious for the case of arm
configuration without joint fixation.
0.2 0.4 0.6 0.8 1
t
-0.1
0.1
0.2
0.3
0.4
v
h
0.2 0.4 0.6 0.8 1
t
0.1
0.2
0.3
0.4
v
h
1.2 1.4 1.6 1.8 2
m
h
0.0425
0.045
0.0475
0.0525
0.055
0.0575
Error
0
.2
0
.4
0
.6
0
.8 1
t
0.05
0.1
0.15
0.2
0.25
0.3
v
h
OntheInuenceofHandDynamics
onMotionPlanningofReachingMovementsinHapticEnvironments 459
Table 2. Reaching time
We re-estimated new hand mass
*
h
m after Day 1 and Day2, using the following curve
matching criterion (integral RMS):
2
*
1 1
(7)
1
arg min ( , ) ( )
h
M N
h pr i h j i
m
j i
m v t m v t
M
where N is the number of measurements in each successful trial, M is the number of
successful trials,
,
pr j
v v are predicted and experimental hand velocities. Therefore,
different dynamic configurations (m
h
, m
o
, k) were used on Day1 and Day2 (Table 3).
Table 3. System configuration parameters for individual subjects
Initially, the subjects were not instructed to fix elbow or shoulder joints. It is interesting, that
only subject S5 found his own comfortable arm configuration – he fixed his elbow joint in
both experimental days, while other subjects did not fixed. It can partially explain the fact
that the estimated hand masses are higher for subjects S1-S4 after Day 1 (Table 3).
After Day 1 subjects S1-S4 demonstrated slightly left-skewed two-phased hand velocity
profiles with the maximal magnitude less than 30 cm/s. The profile form cannot be
explained quantitatively neither by MJC, nor by the MHCC for the hand mass m
h
=0.8 kg.
However, matching criterion (7) formally, one can find optimal m
h
for MHCC which is
significantly different (after Day 1 and Day 2) from the initallly supposed hand mass.
Moreover, the matching error is lower for the MHCC than for MJC. Figure 6 (left) shows
that the error by the MJC is 0.057 while the error by the MHCC is 0.04 at the optimal
“effective” hand mass 1.4kg. In the right part of the Figure 6 the gray thick line shows
average experimental hand velocity profile, and two black thick lines depict the profiles
predicted by the MJC (two-phased) and the MHCC (three-phased) for m
h
=0.8 kg. Finding
Subject Day 1 Day 2
Average RMS Average RMS
S1 1.08s 0.051s 1.17s 0.028s
S2 1.16s 0.027s 1.17s 0.021s
S3 1.12s 0.050s 1.15s 0.034s
S4 1.13s 0.036s 1.16s 0.026s
S5 1.14s 0.038s 1.15s 0.032s
Initial
configuration
(m
h
, m
o
, k)
Configuration
after Day 1
(m
h
, m
o
, k)
Hand mass
estimated
after Day 2
S1 0.8, 3.2, 150 1.3, 5.1, 239 1.5
S2 0.8, 3.2, 150 1.4, 5.4, 253 2.1
S3 0.8, 3.2, 150 1.1, 4.4, 206 1.4
S4 0.8, 3.2, 150 1.1, 4.4, 206 2.3
S5 0.8, 3.2, 150 0.9, 3.6, 169 0.9
the optimal “effective” hand masses and using the principle of dynamically equivalent
systems, the haptic simulator was reconfigured after Day 1 as ahown in Table 3, and the
experiments were repeated on Day 2. Nevertheless, the experimental hand velocity profiles
remained two-phased for subjects S1-S4, with the magnitude less than 30cm/s. The second
estimation by criterion (7) showed that there is an uncertainty in the “effective” hand masses
for subjects S1-S4.
Fig. 6. Matching error and hand velocity profiles for subject S2 (after Day 1)
At the same time, statisticaly representative results for subject S5 (with fixed elbow joint) are
strongly in favour of the MFCC. Figure 7 shows the experimental and predicted by the
MHCC (at m
h
=0.9 kg) hand velocities for subject S5. Thick grey and black lines are the
average experimental and predicted profiles, and the thin grey lines depict last 30 successful
trials on each experimental day. Matching by the criterion (7) showed that the re-estimated
“effective” hand mass (0.9kg) is very close to the initial estimation (0.8kg).
Fig. 7. Hand velocity profiles for subject S5 (left - after Day 1, right – after Day 2)
The only difference between subjects S5 and S1-S4 is that S5 fixed his elbow joint placing the
elbow on a stand. Obviously, different muscle groups worked for S5 and S1-S4, and physical
limits of S1-S4 could not allow them to reach velocity higher than 30cm/s. Also, the
significant difference between hand masses estimated after Day 1 and 2 for S1-S4 means that
modelling of the “effective” hand mass via a point mass is dubious for the case of arm
configuration without joint fixation.
0.2 0.4 0.6 0.8 1
t
-0.1
0.1
0.2
0.3
0.4
v
h
0.2 0.4 0.6 0.8 1
t
0.1
0.2
0.3
0.4
v
h
1.2 1.4 1.6 1.8 2
m
h
0.0425
0.045
0.0475
0.0525
0.055
0.0575
Error
0
.2
0
.4
0
.6
0
.8 1
t
0.05
0.1
0.15
0.2
0.25
0.3
v
h
AdvancesinHaptics460
5. Reinforcement learning and arm configuration
After the course of preliminary experiments it was decided to ask one subject from the
group S1-S4 to repeat experiments in order to check if the three-phased hand velocity
profiles can be achieved after reinforcement learning. In the reinforcement learning task, the
haptic system was repeatedly used in the following teaching mode: it was programmed to
drag the subject’s hand close to the average trajectory of subject S5. In this case the subject’s
hand passively followed the driving PHANToM stylus. The teaching mode was supposed to
provide motor learning of movement of subject S5.
Subject S3 participated in the experiment on Day 3. First, he completed 1000 trials in the
teaching mode (Task A) and then, after 20min break, he was asked to reproduce 1000 times
(Task B) the learnt movement in the standard simulator’s mode (mass-spring transport)
described in the previous sections. In both series, his elbow joint was not fixed. Figure 8
shows the average hand velocity profiles of the subject for this experiment. The black line is
the average profile of S3 after Day 1, and the light grey line (two-phased, left-skewed) is the
average profile of Task B (after reinforcement learning). Even the subject said that he
remembered the desired movement in teaching mode, it can be seen from Figure 8 that the
profile of Task B is not tree-phased. Moreover, he found the desired movement less
comfortable than his previous self-leant control strategy.
Fig. 8. Hand velocity profiles for subject S3 before and after reinforcement learning
Finally, the subject was asked to complete Task A and Task B with his fixed joint placed on a
stand. In this case he found the desired movement much more comfortable and the average
hand velocity profile was very close to the profile predicted by the MHCC (Figure 8, three-
phased profile). The “effective” hand mass estimated by (7) was 0.85kg.
6. Conclusions
An analysis of human reaching movements in the task of mass transport is presented. Two
models, the minimum hand jerk (MJC) and the minimum driving hand force-change
(MFCC), are used for modelling and verification of experimental data. The data were
collected with a haptic system supporting object dynamics simulation in real time. The
importance of the research is that the knowledge of human control strategies may be useful
and hopefully beneficial for the design of human-like control algorithms for advanced
robotic systems. Perhaps, the main contribution of the paper is that it was demonstrated that
human motion planning strategies cannot be captured only by the minimum jerk criterion
without taking into account the configuration of the human arm and its inertia. For many
reaching tasks the MJC and the MFCC give similar predicted hand motion velocities, and it
is important to distinguish between the criteria.
First, we theoretically predicted (with the MJC and the MFCC) a special configuration of the
mass-spring system, when the expected hand velocity profiles may differ significantly in
terms of magnitudes and phase numbers. With the experiments, it was demonstrated that
human arm configuration and ergonomics are important factors for correct theoretical
predictions of the hand velocity profiles. Statistically representative results for the case of
arm configuration with fixed elbow joint are strongly in favour of the MFCC criterion.
Therefore, the hand mass/inertia properties and ergonomics cannot be ignored for hand
motion planning in highly dynamic environment. For these skilful tasks a subject forms a
unique natural hand velocity profile. Reinforcement learning, “programmed” by another
skilful person’s profiles, may not provide comfortable control strategies for the subject.
In the future research, it would be worthwhile to analyze the movements for different types
of experimental scenarios. Also, it would be interesting to explain our experimental results
without arm joint fixation by replacing the equations (2), (5) by models of the arm with two
links and joints, including the joint stiffness and viscosity and the dynamics of the the
hardware. Also, we found that many of the experimental profiles were slightly skewed to
the left. In this respect, studying non-zero boundary conditions (partially, non-zero hand
acceleration) of the optimization problems could clarify these effects.
7. References
Abend, W.; Bizzi, E. & Morasso, P. (1982). Human arm trajectory formation, Brain, Vol. 105,
No. 2, (Jun 1982) pp. 331–348, ISSN: 0006-8950.
Amirabdollahian, F.; Loureiro, R. & Harwin, W. (2002). Minimum jerk trajectory control for
rehabilitation and haptic applications, Proceedings of IEEE International Conference on
Robotics and Automation, pp. 3380–3385, ISBN 0-7803-7273-5, Washington D.C., May
11–15, 2002, IEEE.
Chandler, R.; Clauser, C.; McConville, J.; Reynolds, H. & Young, J. (1976). Investigation of
inertial properties of the human body, Technical report AMRL-TR-74-137, AD-A016-
485, DOT-HS-801-430, Wright Patterson Air Force Base, Ohio, USA, 1976,
Washington, DC: US DOT.
Flash, T. & Hogan, N. (1985). The coordination of arm movements: an experimentally
confirmed mathematical model, Journal of Neuroscience, Vol. 5, No. 7, (Jul 1985) pp.
1688–1703, ISSN: 0270-6474.
Goncharenko, I.; Svinin, M.; Kanou, Y. & Hosoe, S. (2006). Predictability of rest-to-rest
movements in haptic environments with 3d constraints, Journal of Robotics and
Mechatronics, Vol. 18, No. 4, (Aug 2006) pp. 458-466, ISSN : 0915-3942.
Morasso. P. (1981). Spatial control of arm movements, Experimental Brain Research, Vol. 42,
No. 2, (Apr 1981) pp. 223–227, ISSN: 0014-4819.
OntheInuenceofHandDynamics
onMotionPlanningofReachingMovementsinHapticEnvironments 461
5. Reinforcement learning and arm configuration
After the course of preliminary experiments it was decided to ask one subject from the
group S1-S4 to repeat experiments in order to check if the three-phased hand velocity
profiles can be achieved after reinforcement learning. In the reinforcement learning task, the
haptic system was repeatedly used in the following teaching mode: it was programmed to
drag the subject’s hand close to the average trajectory of subject S5. In this case the subject’s
hand passively followed the driving PHANToM stylus. The teaching mode was supposed to
provide motor learning of movement of subject S5.
Subject S3 participated in the experiment on Day 3. First, he completed 1000 trials in the
teaching mode (Task A) and then, after 20min break, he was asked to reproduce 1000 times
(Task B) the learnt movement in the standard simulator’s mode (mass-spring transport)
described in the previous sections. In both series, his elbow joint was not fixed. Figure 8
shows the average hand velocity profiles of the subject for this experiment. The black line is
the average profile of S3 after Day 1, and the light grey line (two-phased, left-skewed) is the
average profile of Task B (after reinforcement learning). Even the subject said that he
remembered the desired movement in teaching mode, it can be seen from Figure 8 that the
profile of Task B is not tree-phased. Moreover, he found the desired movement less
comfortable than his previous self-leant control strategy.
Fig. 8. Hand velocity profiles for subject S3 before and after reinforcement learning
Finally, the subject was asked to complete Task A and Task B with his fixed joint placed on a
stand. In this case he found the desired movement much more comfortable and the average
hand velocity profile was very close to the profile predicted by the MHCC (Figure 8, three-
phased profile). The “effective” hand mass estimated by (7) was 0.85kg.
6. Conclusions
An analysis of human reaching movements in the task of mass transport is presented. Two
models, the minimum hand jerk (MJC) and the minimum driving hand force-change
(MFCC), are used for modelling and verification of experimental data. The data were
collected with a haptic system supporting object dynamics simulation in real time. The
importance of the research is that the knowledge of human control strategies may be useful
and hopefully beneficial for the design of human-like control algorithms for advanced
robotic systems. Perhaps, the main contribution of the paper is that it was demonstrated that
human motion planning strategies cannot be captured only by the minimum jerk criterion
without taking into account the configuration of the human arm and its inertia. For many
reaching tasks the MJC and the MFCC give similar predicted hand motion velocities, and it
is important to distinguish between the criteria.
First, we theoretically predicted (with the MJC and the MFCC) a special configuration of the
mass-spring system, when the expected hand velocity profiles may differ significantly in
terms of magnitudes and phase numbers. With the experiments, it was demonstrated that
human arm configuration and ergonomics are important factors for correct theoretical
predictions of the hand velocity profiles. Statistically representative results for the case of
arm configuration with fixed elbow joint are strongly in favour of the MFCC criterion.
Therefore, the hand mass/inertia properties and ergonomics cannot be ignored for hand
motion planning in highly dynamic environment. For these skilful tasks a subject forms a
unique natural hand velocity profile. Reinforcement learning, “programmed” by another
skilful person’s profiles, may not provide comfortable control strategies for the subject.
In the future research, it would be worthwhile to analyze the movements for different types
of experimental scenarios. Also, it would be interesting to explain our experimental results
without arm joint fixation by replacing the equations (2), (5) by models of the arm with two
links and joints, including the joint stiffness and viscosity and the dynamics of the the
hardware. Also, we found that many of the experimental profiles were slightly skewed to
the left. In this respect, studying non-zero boundary conditions (partially, non-zero hand
acceleration) of the optimization problems could clarify these effects.
7. References
Abend, W.; Bizzi, E. & Morasso, P. (1982). Human arm trajectory formation, Brain, Vol. 105,
No. 2, (Jun 1982) pp. 331–348, ISSN: 0006-8950.
Amirabdollahian, F.; Loureiro, R. & Harwin, W. (2002). Minimum jerk trajectory control for
rehabilitation and haptic applications, Proceedings of IEEE International Conference on
Robotics and Automation, pp. 3380–3385, ISBN 0-7803-7273-5, Washington D.C., May
11–15, 2002, IEEE.
Chandler, R.; Clauser, C.; McConville, J.; Reynolds, H. & Young, J. (1976). Investigation of
inertial properties of the human body, Technical report AMRL-TR-74-137, AD-A016-
485, DOT-HS-801-430, Wright Patterson Air Force Base, Ohio, USA, 1976,
Washington, DC: US DOT.
Flash, T. & Hogan, N. (1985). The coordination of arm movements: an experimentally
confirmed mathematical model, Journal of Neuroscience, Vol. 5, No. 7, (Jul 1985) pp.
1688–1703, ISSN: 0270-6474.
Goncharenko, I.; Svinin, M.; Kanou, Y. & Hosoe, S. (2006). Predictability of rest-to-rest
movements in haptic environments with 3d constraints, Journal of Robotics and
Mechatronics, Vol. 18, No. 4, (Aug 2006) pp. 458-466, ISSN : 0915-3942.
Morasso. P. (1981). Spatial control of arm movements, Experimental Brain Research, Vol. 42,
No. 2, (Apr 1981) pp. 223–227, ISSN: 0014-4819.
AdvancesinHaptics462
Pollick, F. ; Hale, J. & Tzoneva-Hadjigeorgieva, M. (2005). Perception of humanoid
movements, International Journal of Humanoid Robotics, Vol. 2, No. 3, (Sep 2005) pp.
277–300, ISSN: 0219-8436.
Svinin, M.; Goncharenko, I.; Luo, Z W. & Hosoe, S. (2006a). Reaching movements in
dynamic environments: how do we move flexible objects?, IEEE Transactions on
Robotics, Vol. 22, No. 4, (August 2006) pp. 724-739, ISSN: 1552-3098.
Svinin, M.; Goncharenko, I. & Hosoe, S. (2006b). Motion planning of human-like movements
in the manipulation of flexible objects, In: Advances in Robot Control: from Everyday
Physics to Human-Like Movement, Kawamura, S. & Svinin, M. (Eds.), Springer, pp.
263-292, ISBN: 978-3-540-37346-9.
Svinin, M.; Goncharenko, I.; Luo, Z W. & Hosoe, S. (2006c). Modeling of human-like
reaching movements in the manipulation of flexible objects, Proceedings of IEEE/RSJ
International Conference on Intelligent Robots and Systems (IROS 2006), pp. 549-555,
ISBN: 1-4244-0258-1, Beijing, China, Oct 9-15, 2006, IEEE.
Tsuji, T.; Tanaka Y.; Morasso, P.; Sanguineti, V. & Kaneko, M. (2002). Biomimetic trajectory
generation of robots via artificial potential field with time base generator, IEEE
Transactions on Systems, Man, and Cybernetics. C: Applications and Reviews, Vol. 32,
No. 4, (Nov 2002) pp. 426–439, ISSN: 1094-6977.
Haptictouchandhandability 463
Haptictouchandhandability
MiriamIttyerah
X
Haptic touch and hand ability
Miriam Ittyerah
Department of Psychology
Christ University
Bangalore- 560029, India.
Several studies have compared visual perception, tactile (haptic) perception, and visual-
haptic perception of stimuli. Often, performance in tasks involving unimodal visual
perception exceeds performance in both unimodal haptic and cross-modal tasks. However
unimodal haptic comparisons of natural three-dimensional shapes could be as good as
visual-haptic and haptic-visual comparisons. Therefore vision and touch may have
functionally overlapping, though not equivalent, representations of 3-D space.
The present manuscript argues that vision and touch cannot be equated because the sensitivity
and the processes involved in the attainment of information differ between the modalities.
Further, vision is useful for haptics only so long as it provides relevant information. The hand
is an important source of information in haptic touch. Evidence shows that though one may
have a hand preference, the ability of the non preferred hand cannot be undermined as
compared to that of the preferred hand. Research indicates that the hands do not differ in
tactile ability, and the seemingly lower performance of the non preferred hand is a
consequence of its spatial orientation during performance and not an absence of ability.
Haptic touch and hand ability
Several studies have compared visual perception, tactile (haptic) perception, and visual-
haptic perception of stimuli (e.g. Easton, Greene, & Srinivas, 1997; Millar, 1981; Abravanel
1971; Lobb, 1965; Rudel & Teuber, 1964). Often, performance in tasks involving unimodal
visual perception exceeds performance in both unimodal haptic and cross-modal tasks. But
not always: Norman, Norman, Clayton, Lianekhammy, and Zielke (2004), for example,
found that unimodal haptic comparisons of natural three-dimensional shapes could be as
good as visual-haptic and haptic-visual comparisons. Norman et al inferred that vision and
touch have functionally overlapping, though not equivalent, representations of 3-D space.
Underlying much of the research comparing unimodal visual and tactile perception to cross-
modal visual-tactile perception is a long-standing theoretical issue: Do perceivers ‘naturally’
recognize common features of objects perceived through vision and through touch? Or,
alternatively, do accurate cross-modal comparisons develop largely or wholly through
experience? Molyneux’s famous question about the relation between touch and vision –
Can a person born blind distinguish between a cube and a sphere after recovering sight in
adulthood? – continues to occupy philosophers (Gallagher, 2004).
25
AdvancesinHaptics464
In this regard, research has shown that very young infants not only show cross-modal transfer of
object properties such as texture and hardness (e.g., Meltzoff & Borton, 1979; Gibson and Walker
1984), but also can recognize by sight objects previously presented to touch (Streri, 1987; Streri &
Gentaz 2003). These results challenge the empiricist philosophy and modern connectionist
models (McClelland & Rumelhart, 1986; Elman, 1996) that assume independent sensory
modalities at birth. Presumably, the capacity found in older children and adults to make cross-
modal as well as intramodal comparisons evolve from intrinsic capabilities in infants.
Often, studies of cross-modal perception use a sequential design, which places demands on
memory, and demands on memory may matter more to unimodal haptic tasks and cross-
modal haptic-visual tasks than to visual tasks (Woods, O’Modhrain, & Newell, 2004).
Whether simultaneous presentations of stimuli with lesser demands on memory affect
processing differently from sequential presentations was a question of interest. Ittyerah and
Marks (2008) therefore compared visual, haptic, and visual-haptic discrimination of
curvature stimuli when the two stimuli within each pair were presented simultaneously.
Figure 1 depicts each of the six stimuli, which differ only in curvature. Stimulus 1 has a
difference of 3.81 mm between its midpoint and its height at the ends. Stimulus 2 has a
difference of 5.08 mm between its midpoint and the height at its ends and, therefore, has
greater curvature than stimulus 1. The remaining stimuli vary similarly, such that stimulus 6
has the greatest curvature and stimulus 1 the least curvature.
6
5
4
3
2
1
10.16 cm
10.16 cm
10.16 cm
10.16 cm
10.16 cm
10.16 cm
3.81 cm
3.81 cm
3.81 cm
3.81 cm
3.81 cm
5.08 cm
3.81 cm
5.08 cm
5.08 cm
5.08 cm
5.08 cm
5.08 cm
10.16
mm
8.89
mm
7.62
mm
5.08
mm
3.81
mm
6.38
mm
Fig. 1. Dimensions of the six stimuli used in Experiment 1.
With permission from the Editors of Current Psychology Letters. Ittyerah, M. & Marks,
L.E. (2008) Intra-modal and cross-modal discrimination of curvature: Haptic touch versus
vision. Current Psychology Letters, 24, 1-15.
The findings of Ittyerah and Marks (2008) indicated that when two object surfaces, either the
same or different in curvature, were presented simultaneously for comparison, unimodal
visual performance exceeded cross-modal performance, which in turn exceeded unimodal
haptic performance. Figure 2 shows that the accuracy of responses to same pairs of stimuli is
much smaller with haptic comparison than with intramodal visual or with cross-modal
comparison. And accuracy of responses to different pairs is also smallest, by and large, with
intramodal haptic comparison. As Figure 3 shows, over the three smallest physical
differences, where the measures of d’ are most reliable and least susceptible to variability
associated with extreme proportions, unimodal visual performance exceeds cross-modal
performance by about one d’ unit, essentially, one standard deviation unit, and cross-modal
performance similarly exceeds unimodal haptic performance by about one d’ unit.
Vision-Vision
Touch-Vision
Touch-Touch
Fig. 2.
With permission from the Editors of Current Psychology Letters. Ittyerah, M. & Marks,
L.E. (2008) Intra-modal and cross-modal discrimination of curvature: Haptic touch versus
vision. Current Psychology Letters, 24, 1-15.
Haptictouchandhandability 465
In this regard, research has shown that very young infants not only show cross-modal transfer of
object properties such as texture and hardness (e.g., Meltzoff & Borton, 1979; Gibson and Walker
1984), but also can recognize by sight objects previously presented to touch (Streri, 1987; Streri &
Gentaz 2003). These results challenge the empiricist philosophy and modern connectionist
models (McClelland & Rumelhart, 1986; Elman, 1996) that assume independent sensory
modalities at birth. Presumably, the capacity found in older children and adults to make cross-
modal as well as intramodal comparisons evolve from intrinsic capabilities in infants.
Often, studies of cross-modal perception use a sequential design, which places demands on
memory, and demands on memory may matter more to unimodal haptic tasks and cross-
modal haptic-visual tasks than to visual tasks (Woods, O’Modhrain, & Newell, 2004).
Whether simultaneous presentations of stimuli with lesser demands on memory affect
processing differently from sequential presentations was a question of interest. Ittyerah and
Marks (2008) therefore compared visual, haptic, and visual-haptic discrimination of
curvature stimuli when the two stimuli within each pair were presented simultaneously.
Figure 1 depicts each of the six stimuli, which differ only in curvature. Stimulus 1 has a
difference of 3.81 mm between its midpoint and its height at the ends. Stimulus 2 has a
difference of 5.08 mm between its midpoint and the height at its ends and, therefore, has
greater curvature than stimulus 1. The remaining stimuli vary similarly, such that stimulus 6
has the greatest curvature and stimulus 1 the least curvature.
6
5
4
3
2
1
10.16 cm
10.16 cm
10.16 cm
10.16 cm
10.16 cm
10.16 cm
3.81 cm
3.81 cm
3.81 cm
3.81 cm
3.81 cm
5.08 cm
3.81 cm
5.08 cm
5.08 cm
5.08 cm
5.08 cm
5.08 cm
10.16
mm
8.89
mm
7.62
mm
5.08
mm
3.81
mm
6.38
mm
Fig. 1. Dimensions of the six stimuli used in Experiment 1.
With permission from the Editors of Current Psychology Letters. Ittyerah, M. & Marks,
L.E. (2008) Intra-modal and cross-modal discrimination of curvature: Haptic touch versus
vision. Current Psychology Letters, 24, 1-15.
The findings of Ittyerah and Marks (2008) indicated that when two object surfaces, either the
same or different in curvature, were presented simultaneously for comparison, unimodal
visual performance exceeded cross-modal performance, which in turn exceeded unimodal
haptic performance. Figure 2 shows that the accuracy of responses to same pairs of stimuli is
much smaller with haptic comparison than with intramodal visual or with cross-modal
comparison. And accuracy of responses to different pairs is also smallest, by and large, with
intramodal haptic comparison. As Figure 3 shows, over the three smallest physical
differences, where the measures of d’ are most reliable and least susceptible to variability
associated with extreme proportions, unimodal visual performance exceeds cross-modal
performance by about one d’ unit, essentially, one standard deviation unit, and cross-modal
performance similarly exceeds unimodal haptic performance by about one d’ unit.
Vision-Vision
Touch-Vision
Touch-Touch
Fig. 2.
With permission from the Editors of Current Psychology Letters. Ittyerah, M. & Marks,
L.E. (2008) Intra-modal and cross-modal discrimination of curvature: Haptic touch versus
vision. Current Psychology Letters, 24, 1-15.