Advances in Human Robot Interaction Part 7 ppsx
Bạn đang xem bản rút gọn của tài liệu. Xem và tải ngay bản đầy đủ của tài liệu tại đây (1.4 MB, 25 trang )
Generating Natural Interactive Motion in Android Based on Situation-Dependent Motion Variety
139
human beings. One possible design of an experiment is to compare with the android which
has same motions but different motion variation, that is, the android which touches objects
with motion M2 and persons with motion M1 (this manner is opposite to Android C). If this
android is less humanlike than Android C, the motion variation which is congruent with
that of human subjects shown in Section 2 contributes the human-likeness of the android.
However, further investigation is necessary to verify whether the social relationship caused
the arm motion variation observed in Section 2 and the different impressions toward the
android obtained in Section 3.
4. Conclusion
We hypothesized that a motion variety that is not related to a subject's intention and can be
consciously controlled influences the humanlike impression of the subject, and we assumed
that this motion variety makes the android more humanlike. In order to verify this
hypothesis, we constructed a model of the motion variety through the observation of
persons’ motions. We examined the variation in a motion of reaching out and touching
another person, which occurred in different social relationships between the subject and the
other person (or object). The experimental results showed that the modelled motion variety
conditionally influences the impression toward the android.
The results of the present chapter are specific to the android's motion of reaching out and
touching a person. The present study is a first step in the exploration of the principles for
providing natural robot behaviors. The results revealed that a phenomenon whereby motion
variety influences the impression towards the actor can be seen at least in certain motions of
a very humanlike robot. Based on these results, it is possible to examine which aspects of the
robot's appearance and motion are affected by this phenomenon. This exploration will help
to clarify the principles underlying natural human-robot communication.
From the viewpoint of the robot motion design, a motion variety model is also useful.
Several studies have proposed a method by which to implement humanlike motion in a
humanoid robot by copying human motion as measured by a motion capture system to the
robot (Riley et al., 2000; Nakaoka et al., 2003; Matsui et al. 2005). In order to make a robot
motion more humanlike, it is necessary to implement a humanlike motion variation.
However, it is not necessary to copy all human motions. This humanlike motion variation
can be automatically generated from an original motion by the motion variety model.
5. Acknowledgements
The android robot Repliee Q2 was developed in collaboration with Kokoro Company, Ltd.
6. References
Bodenheimer, B.; Shleyfman, A. V. & Hodgins, J. K. (1999). The effects of noise on the
perception of animated human running, Computer Animation and Simulation '99:
Proceedings of the Eurographics Workshop, pp. 53-63, ISBN: 978-3-211-83392-6, Milano,
Italy, Sep., 1999, Springer-Verlag.
Flash, T. & Hogan, N. (1985). The coordination of arm movements: An experimentally
confirmed mathematical model, Journal of Neuroscience, Vol. 5, No. 7, pp. 1688-1703,
1985, ISSN: 0270-6474.
Advances in Human-Robot Interaction
140
Ishiguro, H. (2005). Android science -toward a new cross-interdisciplinary framework,
Proceedings of the 12th International Symposium of Robotics Research, San Francisco,
USA, Oct., 2005.
Jacob, P. & Jeannerod, M. (2005). The motor theory of social cognition: a critique. Trends in
Cognitive Sciences, Vol. 9, No. 1, pp. 21-25, 2005, ISSN: 1364-6613.
Kashima, T. & Isurugi, Y. (1998). Trajectory formation based on physiological characteristics
of skeletal muscles, Biological Cybernetics, Vol. 78, No. 6, pp. 413-422, 1998, ISSN :
0340-1200.
Kawato, M. (1992). Optimization and learning in neural networks for formation and control
of coordinated movement, Attention and performance XIV, pp. 821-849, ISBN: 978-0-
262-13284-8, 1992, MIT Press.
Matsui, D.; Minato, T.; MacDorman, K. F. & Ishiguro, H. (2005). Generating natural motion
in an android by mapping human motion, Proceedings of the IEEE/RSJ International
Conference on Intelligent Robot Systems, pp. 1089-1096, ISBN: 0-7803-8912-3,
Edmonton, Alberta, Canada, Aug., 2005.
Miyamoto, H.; Nakano, E.; Wolpert, D. M. & Kawato, M. (2004). Tops (task optimization in
the presence of signal-dependent noise) model. Systems and Computers in Japan, Vol.
35, Issue 11, pp. 48-58, 2004, ISSN: 0882-1666.
Nakaoka, S.; Nakazawa, A.; Yokoi, K.; Hirukawa, H. & Ikeuchi, K. (2003). Generating whole
body motions for a biped humanoid robot from captured human dances,
Proceedings of the IEEE-RAS International Conference on Robotics and Automation, pp.
3905-3910, ISBN: 0-7803-7737-0, Taipei, Taiwan, Sep., 2003.
Nass, C.; Steuer, J. & Tauber, E. (1994). Computers are social actors, Proceedings of the ACM
Conference on Human Factors in Computing Systems, pp. 72-78, ISBN: 0-89791-651-4,
Boston, Massachusetts, USA, Apr., 1994.
Perlin, K. (1995). Real time responsive animation with personality, IEEE Transactions on
Visualization and Computer Graphics, Vol. 1, No. 1, pp. 5-15, 1995, ISSN: 1077-2626.
Riley, M.; Ude, A. & Atkeson, C. G. (2000). Methods for motion generation and interaction
with a humanoid robot: Case studies of dancing and catching, Proceedings of
AAAI/CMU Workshop on Interactive Robotics and Entertainment, pp. 35-42, Pittsburgh,
Pennsylvania, USA, Apr., 2000.
Schaal, S. & Sternad, D. (2001). Origins and violations of the 2/3 power law in rhythmic 3d
movements, Experimental Brain Research, Vol. 136, No. 1, pp. 60-72, 2001, ISSN: 0014-
4819.
Todorov, E. & Jordan, M. I. (2002). Optimal feedback control as a theory of motor
coordination, Nature Neuroscience, Vol. 5, Issue 11, pp. 1226-1235, 2002, ISSN: 1097-
6256.
Uno, Y.; Kawato, M. & Suzuki, R. (1989). Formation and control of optical trajectory in
human multi-joint arm movement - minimim torque-change model, Biological
Cybernetics, Vol. 61, No. 2, pp. 89-101, 1989, ISSN: 0340-1200.
9
Method for Objectively Evaluating
Psychological Stress Resulting
when Humans Interact with Robots
Kazuhiro Taniguchi
1
, Atsushi Nishikawa
2
, Tomohiro Sugino
3
,
Sayaka Aoyagi
3
, Mitsugu Sekimoto
4
, Shuji Takiguchi
4
,
Kazuyuki Okada
4
, Morito Monden
4
and Fumio Miyazaki
2
1
Graduate School of Engineering, The University of Tokyo
2
Graduate School of Engineering Science, Osaka University
3
Research & Development Division , Soiken Inc.
4
Graduate School of Medicine, Osaka University
Japan
1. Introduction
Most of us have seen robots in movies, animations and comic book stories, so the word
“robot” tends to conjure up images of fictional robots rather than the real thing. The robots
in Japanese cartoons such as Astro Boy and Doraemon have human-like social skills, and their
physical abilities make it possible for them to live alongside humans without any
difficulties. In reality, robots are quite different from these fictional creations. At least, the
robots of the early 21
st
century are still unable to interact smoothly with humans (Norman,
2007). Due to the large disparity between the fictional image of robots and their actual
appearance, people sometimes feel stressed when confronted with robots. To facilitate
smoother interactions between humans and robots, we must not only to improve the
intelligence and physical ability of robots, but also find some way of evaluating the
psychological stress felt by humans when they have to interact with robots. To develop
robots that can interact smoothly with humans, we need to be able to ascertain the
psychological and physiological characteristics of humans by evaluating and analyzing the
stress they experience in everyday activities, design robots based on human characteristics,
and evaluate and study these robots. In short, stress evaluation is a key requirement for the
realization of smooth interactions between robots and humans.
In this chapter, we discuss methods for objectively evaluating and investigating the
psychological stress that people experience when interacting with robots. For the evaluation
of stress, we used acceleration pulse waveforms and the saliva constituents which are
biochemical stress markers. These were used to evaluate the psychological stress of a
surgeon using a surgical assistant robot.
A surgical assistant robot is a robot that interacts with a surgeon and is situated in contact
with the patients to provide support for surgical operations. Interaction with humans is of
greater importance for surgical assistant robots than for any other type of robot. A
Advances in Human-Robot Interaction
142
laparoscope robot is one robot of this type that is put to practical use and is a typical
example of a robot where interaction with humans is important. This is a robot that is used
instead of a human camera assistant in order to hold the laparoscope in position during
laparoscopic surgery (Jaspers et al., 2004). Laparoscopic surgery is a technique where
surgical tools and a laparoscope are inserted into the patient’s body through small holes in
the abdomen, and the surgeon carries out the surgery while viewing the images from the
laparoscope on a TV monitor. Laparoscopic surgery has grown rapidly in popularity in
recent years, not only because it is less invasive and produces less visible scarring, but also
because of its benefits in terms of healthcare economy, such as shorter patient stays. The
most important characteristic of this technique is that the surgeon performs the operation
while watching the video image from the laparoscope on a monitor instead of looking
directly at the site of the operation. Thus, an important factor affecting the safety and
smoothness of the operation is the way in which the video images are presented in a field of
view suitable for the surgical operation. Manipulation of the laparoscope is not only needed
for orienting the laparoscope towards the parts requiring surgery, but also for making fine
adjustments to ensure that the field of view, viewing distance and so on are suitable for the
surgical operation being performed. A camera assistant operates the laparoscope according
to the surgeon’s instructions, but must also make independent decisions on how to operate
the laparoscope in line with the surgeon’s intentions as the surgery progresses.
Consequently even the camera assistant that operates the laparoscope must have the same
level of experience in laparoscopic surgery as the surgeon. However, not many surgeons are
skilled in the special techniques of laparoscopic surgery. It is therefore not uncommon for
camera assistants to be inexperienced and unable to maintain a suitable field of view, thus
hindering the progress of the operation. To address this problem, a laparoscope robot was
developed to hold and position the laparoscope instead of a human camera assistant. Figure
1(a) shows how laparoscopic surgery is conventionally performed with a human camera
assistant operating the laparoscope, and Figure 1(b) shows how laparoscopic surgery is
performed using a laparoscope robot. When using a laparoscope robot, the laparoscope is
held and positioned by the manipulator part of the laparoscope robot which is situated
beside the surgeon and is operated by a human-machine interface based on speech
recognition or the like.
(a) (b)
Fig. 1. (a) Conventional laparoscopic surgery where the laparoscope is operated by a human
camera assistant. (b) Robot-assisted surgery where the laparoscope is operated by a
laparoscope robot.
Method for Objectively Evaluating Psychological Stress Resulting
when Humans Interact with Robots
143
Laparoscope robots have already been made commercially available and are in widespread
use. These include Hitachi’s Naviot™ (Kobayashi et al., 1999; Tanoue et al., 2006), the
AESOP™ made in the US by Computer Motion (now known as Intuitive Surgical Inc.)
(Sackier & Wang, 1994), and EndoAssist™ made by Prosurgics (Finlay, 2001). These
commercial products all move according to the surgeon’s instructions. Meanwhile, although
still at the research stage, there are other systems in which the surgeon’s movements are
autonomously determined by the robot which positions the laparoscope automatically. A
typical example is the laparoscope positioning system developed by Nishikawa et al.
(Sekimoto et al., 2009; Nishikawa et al., 2008; Nishikawa et al., 2006).
Laparoscope robots are generally evaluated by measuring work efficiency, precision and
error rates, and by using interviews and questionnaires to gather the opinions of surgeons.
In cases where the interaction between laparoscope robots and the surgeons operating them
resulted in bad feelings, the result was that this drawback worsened the overall performance
of the system even if the robot performed excellently in all other aspects. It is therefore
necessary to evaluate stress by using interviews, questionnaires and the like. However,
interviews and questionnaires produce subjective results that tend to be rather vague, and it
is also possible that the results are affected by the human relationship between the examiner
and examinee. For the objective measurement of stress, there is growing interest in methods
that use biological stress responses.
The concept of biological stress responses was defined by the physiologist Hans Selye as
“the nonspecific response of the body to any demand upon it” (Selye, 1936; Selye, 1974).
Since stress appears to originate from very complex mechanisms, not only do different
people respond differently to stimuli, but even the same person can exhibit a range of
different responses to the depending on whether the stress is comfortable or uncomfortable,
psychological or physical, and so on.
In the field of physiology, biological stress responses to psychological stress stimuli take
place in the autonomic nervous system and endocrine system. In biological stress responses
of the autonomic nervous system, sympathetic nerves produce a very fast biological
response in which the activity of sympathetic nerves takes priority, and a biophylactic
mechanism acts to resist the stress stimulus. In biological stress responses of the endocrine
system, processes such as hormone secretion from the adrenal cortex causes a biological
response that changes the organism’s internal environment so as to keep it in a suitable
state.
Methods for the evaluation of biological stress responses include biochemical methods that
measure stress-related substances in biological samples of blood, saliva or the like, and
methods that involve performing a statistical dynamic analysis of physiological markers
such as blood pressure and heart rate.
In the following section, as a typical stress evaluation technique, we describe the evaluation
of stress based on biochemical markers and acceleration pulse waveforms.
2. Evaluation of stress with biochemical markers (saliva, urine)
Stress responses can be generally distinguished by two systems — the hypothalamus –
sympathetic nerves – adrenal medulla system (sympathetic-adrenal-medullary axis: SAM)
and the hypothalamus – pituitary – adrenal cortex system (hypothalamic-pituitary-adrenal
axis: HPA). When an excessive stress is loaded, this is reflected as changes in biochemical
markers in blood, urine and saliva (Figure 2).
Advances in Human-Robot Interaction
144
Fig. 2. Physiological reaction to stress loading
The SAM system corresponds to the response of the autonomic nervous system, where the
stimulus of stress load is transmitted to the cerebral cortex and causes the catecholamines
(epinephrine, norepinephrine, etc.) to be released via the hypothalamus, either directly from
the autonomic nervous system or indirectly via the adrenal medulla. These catecholamines
and related substances can be useful as stress markers. On the other hand, the HPA system
corresponds to the response of the endocrine system, where the stress stimulus is
transmitted to the cerebral cortex and causes corticotropin releasing factor (CRF) to be
released from the hypothalamus, promoting the release of adrenocorticotropic hormone
(ACTH) from the pituitary gland and the secretion of glucocorticoids such as cortisol from
the adrenal cortex. These pituitary and adrenal cortex hormones can be also useful as stress
markers.
In the case of evaluating the stress when people use robots or work together with robots, it
is not recommended to use biochemical markers in blood because an invasive medical
practice is accompanied to obtain blood samples. Therefore urinary and salivary markers
are more suitable because of obtaining the samples by non-invasive means. In this section
we discuss especially important and useful stress markers in saliva and urine.
As mentioned above, the largest merit of using urinary and salivary markers is to obtain
samples by non-invasive means, but the data often have larger variation than these of blood
samples with depending on the condition of the samples, so it is necessary to select suitable
collecting and sampling methods for the markers being measured. Especially in the case of
saliva, it is necessary to select different collecting methods according to which salivary
gland the target substances are mainly secreted from (submandibular, parotid, sublingual,
etc.). A suitable collecting apparatus must be selected for the markers being measured [e.g.
test tube for collecting saliva samples (Salivett
®
Sarstedt AG & Co.) , a short straw, etc].
As possible urinary markers for the stress response of the SAM system, vanillylmanderic
acid (VMA) and homovanillic acid (HVA) are recommended, which are metabolites of
catecholamines, individually norepinephrine and dopamine (Frankenhaeuser et al., 1986).
Norepinephrine and dopamine in blood are a direct reflection of sympathetic nerve activity,
so it has been suggested that these markers make it possible to detect changes in autonomic
nerve balance induced by stress loads. However, it is not easy to identify the time point at
which measuring the blood concentrations of these substances, moreover the concentrations
Method for Objectively Evaluating Psychological Stress Resulting
when Humans Interact with Robots
145
depend on the clearance from the blood (Esler et al., 1984), so catecholamines in blood have
been found to be unsuitable for use as stress markers, besides the sample collection needs
invasive clinical practice. Therefore it is recommended to use the urinary concentrations of
VMA and HVA as stress markers. Urinary VMA and HVA have long been used as clinical
markers of neuroblastomas in infancy, and measurement methods using high performance
liquid chromatography (HPLC) have been established. In human studies psychological
stress load (having to perform calculations and operate a PC) is given for 4 hours, the level
of VMA in urine is found to increase compared with that of unstressed condition. Also, in
the case of physical stress load (ergometer exercise) for 4 hours, the urinary VMA and HVA
levels are found to be higher for 4 hours after the load is given. Thus in the last few years,
urinary VMA and HVA have attracted attention as markers for evaluating the effect of
stress-reducing foods and medicines. More recently, they have also been used to evaluate
electrical appliances for reducing stress. In one report, it was confirmed that stress-related
increases in urinary HVA could be suppressed by controlling the airflow of cooling air
conditioners, thus confirming the use of urinary HVA. These reports suggest that urinary
VMA and HVA levels are thought to be promising stress markers for surgeons using robots,
and it is expected that they will lead to the creation of robots that reduce stress.
Possible markers in saliva include α-amylase and chromogranin A as stress responses to the
SAM system, and cortisol as a stress response to the HPA system.
Salivary α-amylase is mainly secreted by the parotid salivary glands, and the control of
these secretions is known to be regulated by sympathetic nerves (Nater et al., 2006). When a
stress load is given, this can be detected as an increase in salivary α-amylase activity, but
this mechanism is thought to involve two pathways — one where the autonomic nervous
system acts directly on the salivary glands, and another which is mediated by the secretion
of norepinephrine from the adrenal medulla. This stress response generally occurs within 10
minutes. Salivary α-amylase activity is known to have circadian rhythm, increasing from the
morning until midday and decreasing at night (Nater et al., 2007). Therefore it is no problem
when evaluating acute phase stress, but when evaluating sub-acute or chronic stress for
several hours or longer, the control sample must be obtained at the same time of another
day. Salivary α-amylase activity is confirmed to change by both physical and psychological
stress load. In the clinical study for the evaluation of electrical appliances, it has been
reported that under 8-hour psychological stress loading conditions, an airbag-type
automated massage chair (medical appliance) can inhibit the increase in salivary α-amylase
activity. Salivary α-amylase activity can be measured by using the Caraway method, which
is established as a method for the clinical examination of α-amylase in blood and urine that
is a highly reliable measurement system. It has also been used to evaluate stress in surgeons
using laparoscope robots.
Chromogranin A is an acid glycoprotein with a molecular weight of approximately 49,000
which is separated from adrenal medulla chromaffin cells. It is known to be widely
distributed the endocrine and nervous systems, and is mostly found in the adrenal medulla
and pituitary gland (Winkler & Fischer-Colibrie, 1992). A characteristic of this protein is that
it coexists and is co-released with catecholamine which contributes to the stress response of
the SAM system, so the blood level of chromogranin A reflects the sympathetic nerve
activity. Chromogranin A is also present in the ducts of the submandibular glands, and is
known to be released in the saliva as a result of stress loading (Saruta et al., 2005). Salivary
chromogranin A is therefore used as a stress marker. Interestingly, it has been reported that
Advances in Human-Robot Interaction
146
specific changes only occur for a psychological stress load (Kanamaru et al., 2006), and in
our studies we also observed changes for psychological stress loads but not for physical
stress loads. The ELISA method was established for the measurement of salivary
chromogranin A concentrations. Although it has not yet been demonstrated to be useful for
stress evaluation electrical appliances, it is very interesting to see how salivary
chromogranin A chages when using a robot.
Cortisol is released from the adrenal cortex when the pituitary is stimulated by ACTH as a
stress response of the HPA system, and has been studied for a very long time as a stress
marker (Levine, 1993). Since cortisol also affects the immune system and central nervous
system, it is an important hormone that reflects not only stress levels but also physiological
condition. Hitherto it has been used together with ACTH as a stress marker in blood. In
recent years, a method has been developed for the measurement of salivary cortisol
concentrations with ELISA, and this has come to be widely used as a stress marker. Salivary
cortisol concentrations are of the order of a few percent compared to that in blood, but have
been found to have a very strong correlation with stress. Cortisol level generally increases
from 20 to 30 minutes after the application of stress load. The response time depends on the
types of load, which is a slower response than the SAM system. Also, like salivary α-
amylase, the salivary cortisol is known to have circadian rhythm, with a high concentration
in the morning which decreases rapidly by midday, so it is essential to perform evaluations
by comparing the results with a control sample. Salivary cortisol responds to both physical
and psychological stress (Nozaki et al., 2009), and it has been shown that the
abovementioned massage chair reduced cortisol concentrations caused by psychological
stress loading. Furthermore, as introduced in this section, it is also used to evaluate the
stress of surgeons when using a laparoscope robot.
3. Evaluation of stress with accelerated plethysmography
The stress response of the SAM system can be detected as a change in autonomic nerve
functions by using a physiological marker. Changes in autonomic nerve function can be
evaluated in various ways such as nerve impulses, electroencephalograms and
electrocardiograms. Acceleration pulse waveforms are especially useful because they can be
measured quickly and easily by accelerated plethysmography (Figure 3). The acceleration
pulse waveform is a secondary differentiation of plethysmogram readings based on
measurements of the optical absorbency of hemoglobin in peripheral blood vessels of a
fingertip or other region. These waveforms have been generally used to evaluate
arteriosclerosis. The a-a interval of the acceleration pulse waveform is strongly correlative to
the R-R interval in an electrocardiogram in physiological aspect. The electrocardiogram R-R
interval can be used to evaluate autonomic nerve functions by the coefficient of variation
and by the frequency analysis of time-series data with maximum entropy method or fast
Fourier transform method (Akselrod et al., 1985). Even in the a-a interval of the acceleration
pulse waveform, when the coefficient of variation reflects the activity of parasympathetic
nerves or by the analysis of time-series data, it is shown that the low-frequency component
(LF: 0.02–0.15 Hz) mainly reflects the sympathetic nerve activity, while the high-frequency
component (HF: 0.15–0.5 Hz) reflects the parasympathetic nerve activity, and it is known
that the LF/HF ratio indicates the autonomic nerve functions and that LF/HF increases in
stress states (when sympathetic nerves become predominant). When a physical stress load is
given, it has been reported that in comparing before with after the stress load, the coefficient
Method for Objectively Evaluating Psychological Stress Resulting
when Humans Interact with Robots
147
of variation of the a-a interval decreases and the LF/HF increases. These markers are often
used to evaluate the stress-reducing effects of foods (Nukui et al., 2008). Recently, it has also
been applied to evaluating the stress-reducing effects of electrical appliances.
It has also been found that LF/HF in the frequency analysis is related to fatigue as well as
stress. The acceleration pulse waveform is useful for not only the evaluation of stress and
fatigue when using electrical appliances, but also the detection of the worker’s fatigue level
before the start of work, it is possible to detect the worker’s health condition before
operating a robot.
Fig. 3. Evaluation of stress based on autonomic nervous system functions
4. Objective evaluation of psychological stress by analyzing biochemical
markers and acceleration pulse waveforms
In this section we describe a method for objectively evaluating psychological stress in
examinees by analyzing acceleration pulse waveforms and the examinee’s biochemical
markers measured before and after performing a task. Saliva was used as the biochemical
marker. For the acceleration pulse waveform data, we used the LF/HF ratio.
The duration of the task was set to 25 minutes. Immediately before and after the test, the
examinee’s saliva was sampled and acceleration pulse waveform measurements were
performed.
The saliva samples were obtained by having the examinee chew the cotton swab from a
saliva collection test tube (Salivette
®
, made by Sarstedt AG & Co.) for three minutes with the
back teeth on one side of the mouth. If necessary, the saliva was stored by freezing after
collection. Since the saliva constituents have circadian rhythm, in cases where multiple
measurements were made on the same examinee, the saliva samples were obtained on the
same day of the week and at the same time. The test subjects were also asked to chew the
cotton swab with the same teeth on each occasion. The measurement of acceleration pulse
Advances in Human-Robot Interaction
148
waveforms was performed by attaching an infrared acceleration pulse waveform meter to
the index finger and taking readings under resting conditions. The same finger was used for
all measurements. The examinees were required to rest for approximately 30 minutes before
starting the task. The cortisol in saliva samples was measured using a method such as
ELISA. Also, the salivary α-amylase was measured using a method such as the Caraway
method. The results of the salivary cortisol and α-amylase measurements are shown in
Figures 4(a) and (b). Here, the subscripts “Before” and “After” indicate the results of
measurements made immediately before and after performing the task. The numbers shown
above the bar graphs are the measurement results or the average of multiple measurements.
The results of measuring the acceleration pulse waveforms were used to calculate the
LF/HF ratios, and the change before and after the task is shown in Figure 4(c) in the same
way as in Figures 4(a) and (b).
Salivary cortisol, salivary α-amylase and the LF/HF ratio each have different reaction times
to stress. Salivary α-amylase increases (activates) within about 10 minutes of applying a
stress stimulus, whereas salivary cortisol increases (activates) roughly 20–30 minutes after
applying a stress stimulus. The LF/HF ratio increases instantaneously when stress is given.
By using these differences in reaction time, it is possible to estimate the stress before, during
and after the task from the saliva constituents and acceleration pulse waveforms measured
before and after the task lasting approximately 25 minutes as shown in Figure 5. In this
Figure, the results of salivary cortisol measurements made immediately before the task
(COR
Before
) represent the stress levels 20–30 minutes before the start of the task, the results of
salivary α-amylase measurements made immediately before the task (AMY
Before
) represent
the stress levels up to 10 minutes before the start of the task, the results of acceleration pulse
measurements made immediately before the task (LF/HF
Before
) represent the stress levels
immediately before the start of the task, the results of salivary cortisol measurements made
at the end of the task (COR
After
) represent the stress levels in the first half of the task (20–30
minutes before the end of the task), the results of salivary α-amylase measurements made at
the end of the task (AMY
After
) represent the stress levels in the second half of the task (up to
10 minutes before the end of the task), and the results of acceleration pulse measurements
made at the end of the task (LF/HF
After
) represent the stress levels at the end of the task. By
exploiting the time lags to the stress responses of each factor in this way, it is possible to
estimate the stress variation over a wide period of time by making just a few measurements.
(a) Salivary cortisol levels (b) Salivary α-amylase activity levels (c) LF/HF ratios
Fig. 4. Examples of measurement results
Method for Objectively Evaluating Psychological Stress Resulting
when Humans Interact with Robots
149
Fig. 5. Stress distribution obtained by exploiting the different stress response times of
salivary constituents and acceleration pulse waveforms
Fig. 6. Format of stress variation diagram
Next, from the results of measuring the salivary constituents and acceleration pulse
waveforms, we will discuss a method for plotting a stress variation diagram depicting the
temporal variation in stress. Figure 6 shows the format of a stress variation diagram. The
vertical axis shows the variation of stress, with larger numbers representing higher levels of
stress and smaller numbers representing lower levels of stress. Since this diagram is more
concerned with changes in stress levels, the absolute values are of no great significance. The
horizontal axis represents time. The task starts at point D and ends at point F. Saliva and
Advances in Human-Robot Interaction
150
acceleration pulse waveform data are acquired at points D and F. The stress quantities for
COR
Before
, COR
After
, AMY
Before
, AMY
After
, LF/HF
Before
and LF/HF
After
are plotted along axes
A, B, C, E, D and F respectively, and are connected by lines. Here, t
T
is the task duration (25
minutes), t
C
is the salivary cortisol reaction time, and t
A
is the salivary α-amylase reaction
time. The acceleration pulse waveform is assumed to respond instantaneously. The stress
variation diagram is drawn by following the four steps shown below.
Step 1. Plot the salivary cortisol data
With regard to the salivary cortisol values measured before and after the task, COR
Before
represents the stress state 20 to 30 minutes before the task (axis A), and COR
After
represents
the stress state 20 to 30 minutes before the end of the task (first half of the task) (axis B).
In this stress variation diagram, the COR
Before
value is taken as a reference point (100%) as a
basis for expressing subsequent stress values. First, the value of COR
Before
is plotted at the
100% point 1 on axis A, and is denoted by γ
0
= 100%. Using Equation (1), the value of
COR
After
is converted to a percentage taking that value of COR
Before
as 100%. This converted
value γ is plotted at point 2 on axis B. A line is then drawn between points 1 and 2.
0
= γ
COR
COR
γ
Before
After
(1)
Example: From Figure 4(a), the salivary cortisol value is 0.075 µg/dl before the operation
and 0.090 µg/dl after the operation. From Equation (1), this corresponds to γ = 120% (a 20%
increase), so the stress variation diagram starts out as shown in Figure 7.
Fig. 7. Plotting the data from salivary cortisol measurements
Method for Objectively Evaluating Psychological Stress Resulting
when Humans Interact with Robots
151
Step 2. Plot the salivary α-amylase and LF/HF data obtained before surgery
Before the task, the examinees were assumed to be in a relaxed state with a small stress
amplitude, so the point where the line drawn in step 1 intersects with axis C is assumed to
correspond to AMY
Before
and is called intersection point 3. Similarly, the point where the line
drawn in step 1 intersects with axis D is assumed to correspond to LF/HF
Before
and is called
intersection point 4. In this way, intersection points 3 and 4 are points that are automatically
determined from the salivary cortisol data of step 1 and the positions of axes C and D.
Therefore, the value α
0
at intersection point 3 is given by Equation (2), and the value β
0
at
intersection point 4 is given by Equation (3).
()
00
-
-
+= γγ
t
tt
γα
T
AC
Before
(2)
()
00
-+= γγ
t
t
γβ
T
C
Before
(3)
Here, the values of α
0
and β
0
are liable to be affected by the stress state before the task, so it is
important that a relaxed state is maintained before the task.
Fig. 8. Plotting the α-amylase and LF/HF data before surgery
Example: When the pre-surgery salivary α-amylase data AMY
Before
and the pre-surgery
LF/HF data LF/HF
Before
are plotted, the stress variation diagram appears as shown in Figure
8. Here, γ
0
= 100%, γ = 120%, t
T
(task duration) = 25 minutes, t
C
(salivary cortisol reaction
time) = 20 minutes, t
A
(salivary α-amylase reaction time) = 5 minutes. Based on these values,
Advances in Human-Robot Interaction
152
the value α
Before
at intersection point 3 from Equation (2) is 112.0%, and the value β
Before
at
intersection point 4 from Equation (3) is 116.0%.
Step 3. Plot the salivary
α
-amylase data obtained after surgery
The salivary α-amylase data AMY
After
obtained after surgery represents the stress at point E
within 10 minutes before the end of the task. This stress represents a stress quantity relative
to the salivary α-amylase data AMY
Before
obtained before surgery, so we can use Equation (4)
to convert this into an increase or decrease α with respect to the base point 1. This value α is
entered on axis E as intersection point 5. A line is drawn between intersection points 2 and 5.
0
= α
AMY
AMY
α
Before
After
(4)
Example: From Figure 4(b), the pre- and post-surgery salivary α-amylase data AMY
Before
and AMY
After
have values of 45 and 71 KU/L respectively, and the value of α
0
is 112.0%.
Thus from Equation (4), the value of α is 177.0%, and the resulting stress variation diagram
is as shown in Figure 9.
Fig. 9. Plotting the salivary α-amylase after surgery
Step 4. Plot the LF/HF data after surgery
The post-surgery LF/HF data LF/HF
After
represents the stress level at the end of the task
(point F).
This stress level represents an amount of stress relative to the pre-surgery LF/HF data
LF/HF
Before
, so Equation (5) is used to transform LF/HF
After
into an increase or decrease β
relative to the base point 1. This value β is entered on axis F as intersection point 6. A line is
drawn between intersection points 5 and 6.
Method for Objectively Evaluating Psychological Stress Resulting
when Humans Interact with Robots
153
0
Before
After
LF/HF
LF/HF
= ββ (5)
Example: From Figure 4(c), the pre-surgery LF/HF data LF/HF
Before
has a value of 10, the
post-surgery acceleration pulse waveform data LF/HF
After
has a value of 8, and the value of
β
0
is 116.0%. Thus according to Equation (5), β is equal to 92.8%, and the stress variation
diagram appears as shown in Figure 10.
Fig. 10. Plotting the LF/HF data after surgery
By following the above procedure of steps 1 through 4, it is possible to draw a stress
variation diagram.
The axes A, C and D in the stress variation diagram represent the stress values before the
start of the task, axes D, B and E represent the intermediate stress levels after the start of the
task, and axes E and F represent the stress levels in the second half of the task.
In the example shown in Figure 10, there is a gentle increase in stress before the start of the
task, and a clear increase in stress from the beginning through to the middle of the task, but
this stress is eliminated in the second half of the task.
5. A practical example of psychological stress evaluation
In this section, to illustrate how the stress variation diagrams described in section 4 can be
used in practice, we show how this technique can be used in the evaluation of a laparoscopic
robot. In this example, surgeons performed in-vitro laparoscopic cholecystectomy
Advances in Human-Robot Interaction
154
simulations using pig livers (which have an anatomically similar structure to that of human
organs). These operations were performed with a laparoscope operated by a laparoscope
robot, and with a laparoscope operated by a human assistant. By analyzing the surgeons’
LF/HF ratio and salivary cortisol and α-amylase levels before and after each surgery, we
conducted a multilateral and objective evaluation of their biological stress responses.
5.1 Laparoscope robot
For the laparoscope robot, we used the automatic laparoscope positioning system proposed
by Nishikawa et al. (Nishikawa et al., 2006), which includes the ability to plan the
workspace before the operation begins. This laparoscope robot is a fully autonomous system
that uses a robot to hold and automatically position the laparoscope instead of a human
camera assistant. The position of the laparoscope and the image zoom factor to be used
during surgery are set up just before the surgery by preoperative planning whereby the
surgeon selects several working area at the operation site, while at the same time
determining the best image zoom factor (i.e., the distance from the working area to the
laparoscope tip) for working at this position, and stores this information on a PC. Once the
operation has started, the robot tracks the surgical instrument in three dimensions so that
the tip of the surgical instrument remains in the center of the laparoscope image. When the
tip of the surgical instrument has been positioned at the working area determined during
preoperative planning, the zoom factor of the laparoscope image is automatically adjusted
according to the preoperative planning. Figure 11 shows the hardware configuration of the
laparoscope robot, and Figure 12 shows the control flow. The laparoscope robot consists of a
manipulator, an optical three-dimensional position-measuring device (Polaris Accedo
®
,
made by NDI Corporation), a control PC (Linux-based), a scan converter and a television
monitor. The manipulator has a parallel link mechanism that uses three motors to perform
positioning with three degrees of freedom. When the field of view moves to the left or right
and up or down, the longitudinal position of the laparoscope camera can be adjusted to
enlarge or reduce the field of view.
Fig. 11. Hardware configuration of laparoscope robot
Method for Objectively Evaluating Psychological Stress Resulting
when Humans Interact with Robots
155
Fig. 12. Control flow of laparoscope robot
5.2 In-vitro tests
Surgeons were asked to perform in-vitro laparoscopic cholecystectomy simulations on pig
livers, using either a human camera assistant or a laparoscope robot to operate the
laparoscope. Before and after each operation, the surgeon’s saliva was sampled and the
acceleration pulse waveform was measured. The salivary cortisol and salivary α-amylase
constituents of the saliva were measured. The salivary cortisol was measured by the ELISA
method using reagents made by Salimetrics, and the salivary α-amylase was measured by
the Caraway method using reagents made by Wako Pure Chemical Industries Ltd. The
acceleration pulse waveform was measured using an Artett C acceleration pulse waveform
meter made by U - Medica Inc.
For the in-vitro laparoscopic cholecystectomy simulations performed using pig livers, a
fresh pig liver was placed inside a test box to represent the abdomen, and the surgeon
performed a mock cholecystectomy (Figure 13). This operation is performed by the
following procedure: (1) move the field of view to Calot’s triangle, (2) expose and cut the
cystic duct, (3) detach the gallbladder from the liver (Figure 14).
The examinees were two right-handed clinicians with extensive experience in laparoscopic
cholecystectomy simulations (examinees A and B). The examinees had no previous
experience in the use of laparoscope robots. In total, they performed the operation 14 times
over a period of four days. The surgeon and laparoscope operator in each operation were as
follows:
Advances in Human-Robot Interaction
156
Fig. 13. Set-up of tests conducted with a laparoscope robot
(a) (b)
Fig. 14. Laparoscope view. (a) Moving the field of view to Calot’s triangle and
exposing/cutting the cystic duct. (b) Detaching the gallbladder from the liver
Day 1
(1) Surgeon: examinee A, laparoscope operator: laparoscope robot
(2) Surgeon: examinee A, laparoscope operator: examinee B
(3) Surgeon: examinee B, laparoscope operator: laparoscope robot
(4) Surgeon: examinee B, laparoscope operator: examinee A
In operations (1) and (3), we sampled the surgeon’s saliva before and after the
operation, and in operations (2) and (4) we sampled the saliva of both the surgeon and
camera assistant. Acceleration pulse waveform measurements were not performed in
operation (1).
Day 2
(5) Surgeon: examinee A, laparoscope operator: examinee B
(6) Surgeon: examinee B, laparoscope operator: laparoscope robot
(7) Surgeon: examinee B, laparoscope operator: examinee A
(8) Surgeon: examinee A, laparoscope operator: laparoscope robot
In each operation, saliva samples and acceleration pulse waveform measurements were
taken from the surgeon.
Method for Objectively Evaluating Psychological Stress Resulting
when Humans Interact with Robots
157
Day 3
(9) Surgeon: examinee B, laparoscope operator: examinee A
(10) Surgeon: examinee A, laparoscope operator: laparoscope robot
(11) Surgeon: examinee A, laparoscope operator: examinee B
(12) Surgeon: examinee B, laparoscope operator: laparoscope robot
In operations (9) and (11) we obtained saliva samples and acceleration pulse waveform
measurements from the camera assistant, and in operations (10) and (9) we obtained
saliva samples and acceleration pulse waveform measurements from the surgeon.
Day 4
(13) Surgeon: examinee B, laparoscope operator: examinee A
(14) Surgeon: examinee A, laparoscope operator: examinee B
In the operations performed on day 4, we obtained saliva samples and acceleration
pulse waveform measurements from the surgeon.
The above test schedule was planned to take into consideration the circadian rhythm in the
substances used to evaluate psychological stress. By scheduling operations (1), (5) and (9) at
the same time of day, it was possible to acquire data at the same time of day for examinee A
performing the operation with a laparoscope robot and with a human camera assistant, so
when making a comparative study of the data from each operation, there was no need to
take into consideration the effects of circadian rhythm in the substances used to evaluate
psychological stress. Similarly, operations (3), (7) and (11) were performed at the same time
of day by examinee B, operations (2), (6), (10) and (13) were performed at the same time of
day by both examinees, and operations (4), (8), (12) and (14) were performed at the same
time of day by both examinees so that data could be collected in the same way.
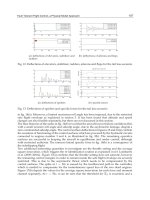
The results of salivary cortisol measurements on examinees A and B before and after
surgery are shown in Figures 15 and 18, and the results of salivary α-amylase measurements
are shown in Figures 16 and 19. Since the results of measurements of salivary constituents
were obtained by taking circadian rhythm of stress evaluation substances into consideration,
the data was all processed together. Figures 17 and 20 show the results of LF/HF
measurements from examinees A and B before and after the operations. Note that Figures 15
through 20 only show the data for the surgeon. The duration of the operations performed by
examinees A and B are shown in Table 1 as supplementary material.
Fig. 15. Salivary cortisol levels (Examinee A)
Advances in Human-Robot Interaction
158
Fig.16. Salivary α-amylase activity levels (Examinee A)
Fig. 17. LF/HF ratios (Examinee A)
Fig. 18. Salivary cortisol levels (Examinee B)
Method for Objectively Evaluating Psychological Stress Resulting
when Humans Interact with Robots
159
Fig. 19. Salivary α-amylase activity levels (Examinee B)
Fig. 20. LF/HF ratios (Examinee B)
With Surgical With Camera
Assistant System Assistant
Examinee A Ave.
28’ 13″ 25’ 47″
S.D.
6’ 20″ 7’ 5″
Max.
34’ 37″ 36’ 13″
Min.
21’ 57″ 21’ 5″
Examinee B Ave.
20’ 48″ 24’ 5″
S.D.
3’ 35″ 7’ 20″
Max.
24’ 53″ 34’ 25″
Min.
18’ 6″ 17’ 0″
Table 1. Operating times
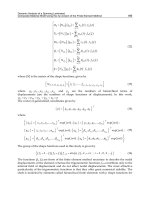
We plotted stress variation diagrams based on the results of measuring saliva constituents
and acceleration pulse waveforms shown in Figures 15 through 20 (Figures 21 and 22). Here,
the task duration t
T
was set to 25 minutes, the salivary cortisol reaction time was set to 20
Advances in Human-Robot Interaction
160
Fig. 21. Stress variation diagram for examinee A
Fig. 22. Stress variation diagram for examinee B
Method for Objectively Evaluating Psychological Stress Resulting
when Humans Interact with Robots
161
minutes, and the salivary α-amylase reaction time t
A
was set to 5 minutes. The task duration
t
T
can be taken as the average duration for each task as shown in Table 1. Figure 21 shows
the stress variation diagrams for examinee A. This Figure shows the stress variation
measured when using the laparoscope robot and when using a human camera assistant to
operate the laparoscope. Figure 22 shows the corresponding results for examinee B. The line
graphs shown in these Figures allow the comparative evaluation to be made between
surgery with a laparoscope robot and surgery with a human camera assistant.
First of all we will consider the results for examinee A (Figure 21). Examinee A was not
stressed before the operation or during the middle stages of the operation, but became
stressed at the end of the operation. Examinee A was also slightly more stressed when
performing the operation with a camera assistant than when performing the operation with
a robot. The same can also be said of the raw data shown in Figures 15 through 17. From the
salivary cortisol and salivary α-amylase results for examinee A (Figures 15 and 16),
examinee A had no pronounced stress reaction in either operation. Next, from the LF/HF
results (Figure 17), examinee A had a greater predominance of sympathetic nerve activity in
the second half of the operation than in the first half, and tended to be slightly more
stressed.
Next we will consider the results for examinee B. As Figure 22 shows, examinee B felt
stressed before the operation and during the first half of the operation when using the
laparoscope robot, but this stress reduced during the second half of the operation. On the
other hand, when performing the operation with a human camera assistant, examinee B was
not stressed before the operation, but the stress level increased as the operation began and
there was no reduction of stress during the operation. Looking at the data of Figures 18
through 20 separately, in the salivary cortisol results for examinee B (Figure 18), a stress
reaction occurred before the operation when using the laparoscope robot. Also, from the
salivary α-amylase results (Figure 19), there was a slight stress reaction during all the
operations, and the largest stress reactions were observed in operations where the
laparoscope was operated by a camera assistant. When using the laparoscope robot,
according to the LF/HF results (Figure 20), the sympathetic nerves are predominant around
the start of the operation and suppressed at the end of the operation. On the other hand,
when performing surgery using a camera assistant, the sympathetic nerves are more
predominant at the end of the surgery. In other words, examinee B tended to be more
stressed (tense or agitated) at the end of the operation than at the start of the operation when
using a camera assistant, but tended to be more stressed at the start of the operation when
using a laparoscope robot.
From the operation times shown in supplementary table 1, the style of operation was found
to cause no difference in operation times, and we found it impossible to evaluate stress in
terms of how long the operation took to perform.
Thus by analyzing saliva constituents and acceleration pulse waveforms, we were able to
objectively evaluate the stress experienced by surgeons when performing laparoscopic
surgery with a laparoscope operated by a human camera assistant and with a laparoscope
operated by a laparoscope robot.
6. Conclusion
We have described a method for objectively evaluating the psychological stress experienced
by people performing a task with a robot for about 25 minutes by analyzing their saliva
Advances in Human-Robot Interaction
162
constituents and acceleration pulse waveforms before and after the task. In particular, in this
study we investigated an example where highly skilled examinees (surgeons) engaged in
high-level interaction with a functionally enhanced robot (laparoscope robot) to perform a
particular task (laparoscopic surgery) in a particular environment (operating theatre). A
laparoscope robot is a good example of where humans and robots can interact successfully.
Methods for objectively evaluating the psychological stress of humans due to interactions
with robots will become increasingly important as robots become more commonplace in
society. Further research will be needed to investigate stress evaluation methods that are
simpler, less invasive and cheaper to implement. In the future, we plan to investigate a
method for using the human herpes virus (HHV6) to evaluate long-term and chronic fatigue
in surgeons, and to study an integrated stress evaluation method that combines subjective
and objective stress evaluation methods.
7. Acknowledgements
This research was supported in part by “Special Coordination Funds for Promoting Science
and Technology: Yuragi Project” of the Ministry of Education, Culture, Sports, Science and
Technology, Japan, Grant-in-Aid for Scientific Research (A) (No. 19206047) of the Japan
Society for the Promotion of Science.
8. References
Norman, D. (2007). The design of future things, Basic Books, ISBN 978-0-465-00228-3, New
York.
Jaspers, J. E. N.; Breedveld, P.; Herder, J. L & Grimbergen, C. A. (2004). Camera and
instrument holders and their clinical value in minimally invasive surgery. Surg
Laparosc Endosc Percutan Tech, Vol.14, No. 3, 145–152
Kobayashi, E.; Masamune, K.; Sakuma, I.; Dohi, T. & Hashimoto, D. (1999). A New Safe
Laparoscopic Manipulator System with a Five-Bar Linkage Mechanism and an
Optical Zoom. Computer Aided Surgery, Vol.4, 182-192.
Tanoue, K.; Yasunaga, T.; Kobayashi, E.; Miyamoto, S.; Sakuma, I.; Dohi, T.; Konishi, K.;
Yamaguchi, S.; Kinjo, N.; Takenaka, K.; Maehara Y. & Hashizume, M. (2006).
Laparoscopic cholecystectomy using a newly developed laparoscope manipulator
for 10 patients with cholelithiasis, Surgical Endoscopy, Vol.20, No.5, 753-756, ISSN
0930-2794 (Print) 1432-2218 (Online).
Sackier, J. M. & Wang, Y. (1994). Robotically assisted laparoscopic surgery form concept to
development. Surgical Endoscopy, Vol.8, No.1, 63-66, ISSN 0930-2794 (Print) 1432-
2218 (Online).
Wang, Y F.; Uecker, D. R. & Wang, Y. (1996). Choreographed Scope Maneuvering in
Robotically-Assisted Laparoscopy with Active Vision Guidance, Proceedings of
IEEE Workshop on Applications of Computer Vision, pp. 187-192, 0-8186-7620-5,
Sarasota, FL, December, 1996
Finlay, P. A. (2001). A Robotic Camera Holder for Laparoscopy. Proceedings and Overviews
of ICAR2001 Workshop 2 on Medical Robotics, in the 10th International Conference
on Advanced Robotics, pp.129-132. Aug. 2001, Budapest, Hungary
Method for Objectively Evaluating Psychological Stress Resulting
when Humans Interact with Robots
163
Sekimoto, M.; Nishikawa, A.; Taniguchi, K.; Takiguchi, S.; Miyazaki, F.; Doki, Y. & Mori, M.
(2009). Development of a Compact Laparoscope Manipulator (P-arm). Surgical
Endoscopy, ISSN 0930-2794 (Print) 1432-2218 (Online)
Nishikawa, A; Nakagoe, H.; Taniguchi, K.; Yamada, Y.; Sekimoto, M.; Takiguchi, S.;
Monden, M. & Miyazaki, F. (2008). How Does the Camera Assistant Decide the
Zooming Ratio of Laparoscopic Images? — Analysis and Implementation,
Proceedings of the 11th International Conference on Medical Image Computing and
Computer Assisted Intervention (MICCAI 2008). New York, USA, Sep.2008.
Nishikawa, A.; Ito, K.; Nakagoe, H.; Taniguchi, K.; Sekimoto, M.; Takiguchi, S.; Seki, Y.;
Yasui, M.; Okada, K.; Monden, M. & Miyazaki, F. Automatic Positioning of a
Laparoscope by Preoperative Workspace Planning and Intraoperative 3D
Instrument Tracking, in MICCAI2006 Workshop proceedings, Workshop on Medical
Robotics: Systems and Technology towards Open Architecture, 2006, 82-91.
Selye, H. (1936). A syndrome produced by diverse nocuous agents, Nature, Vol.138, No. 4,
Jul. 1936, 32-33.
Selye, H. (1974). Stress Without Distress, Lippincott Williams & Wilkins, ISBN 978 -
0397010264.
Frankenhaeuser, M.; Lundberg, U.; Rauste von Wright, M.; von Wright J. & Sedvall, G.
(1986). Urinary monoamine metabolites as indices of mental stress in healthy males
and females. Pharmacol Biochem Behav, Vol.24, No.6. 1521-1525.
Esler, M.; Jennings, G.; Korner, P.; Blombery, P.; Sacharias, N. & Leonard, P. (1984).
Measurement of total and organ-specific noreponephrine kinetics in humans, Am J
Physiol, Vol.247, E21-E28.
Nater, U. M.; Marcaa, R. L.; Florina, L.; Mosesb, A.; Langhansb, W.; Kollerc, M. M. & Ehlert,
U. (2006). Stress-induced changes in human salivary alpha-amylase activity —
associations with adrenergic activity. Psychoneuroendocrinology, Vol.31, No.1, 49–
58.
Nater, U. M.; Rohleder, N.; Schlotz, W.; Ehlert, U. & Kirschbaum, C. (2007). Determinants of
the diurnal course of salivary alpha-amylase. Psychoneuroendocrinology, Vol.32,
No.4, 392-401.
Winkler, H. & Fischer-Colibrie, R. (1992). The chromogranins A and B: the first 25 years and
future perspectives. Neuroscience, Vol.49, No.3 , 497-528.
Saruta, J.; Tsukinoki, K.; Sasaguri, K.; Ishii, H.; Yasuda, M.; Osamura, Y. R.; Watanabe, Y. &
Sato, S. (2005). Expression and localization of chromogranin A gene and protein in
human submandibular gland. Cells Tissues Organs, Vol.180, No.4, 237-244.
Kanamaru, Y.; Kikukawa, A. & Shimamura, K. (2006). Salivary chromogranin-A as a marker
of psychological stress during a cognitive test battery in humans. Stress, Vol.9,
No.3, 127-131.
Levine, S. (1993). The psychoendocrinology of stress. Ann N Y Acad Sci, Vol.697, 61-69.
Nozaki, S.; Tanaka, M.; Mizuno, K.; Ataka, S.; Mizuma, H.; Tahara, T.; Sugino, T.; Shirai, T.;
Eguchi, A.; Okuyama, K.; Yoshida, K.; Kajimoto, Y.; Kuratsune, H.; Kajimoto, O. &
Watanabe, Y. (2009). Mental and physical fatigue-related biochemical alterations.
Nutrition, Vol.25, No.1, 51-57.