CONTEMPORARY ROBOTICS - Challenges and Solutions Part 5 pptx
Bạn đang xem bản rút gọn của tài liệu. Xem và tải ngay bản đầy đủ của tài liệu tại đây (2.15 MB, 30 trang )
Prospectivepolymercompositematerialsforapplicationsinexibletactilesensors 111
2.7 Summary on prior work
From the available papers regarding polymer/MWCNT composites for strain sensing one
can conclude that attention is devoted only to investigations of tensile strain sensing
properties. Almost in all papers the report was about the best sensitivity of MWCNT
composites in comparison with conventional resistance strain gauges. Thus more attention
should be paid to elaboration of polymer/MWCNT composites for compressive strain
sensing.
Of all the composites examined, elastomer/(carbon nanostructure) composites shows the
best electromechanical properties as flexible large area materials for strain and stress
sensing. To reveal the strain sensing mechanisms further investigations of these composites
are required. We present in next paragraphs an attempt to use the HSCB as well as
MWCNT to devise an all flexible composite for macro-scale pressure indicators (relative
pressure difference sensors) or robotic tactile elements.
3. Design principles of the structure of polymer/carbon nanostructure
composites for pressure strain sensing
Based on the review of other authors, we have developed four simple principles, which
should be obeyed to obtain maximum sensitivity of multifunctional elastomer-carbon nano-
composites:
1) Polyisoprene (natural rubber) of the best elastic properties has to be chosen as the matrix
material;
2) High-structured carbon nano-particles (HSNP) providing a fine branching structure and a
large surface area (better adhesion to polymer chains compared to LSNP) or MWCNT
should be taken as a filler. Because of a higher mobility of HSNP compared with LSNP the
electro-conductive network in the elastomer matrix in this case is easily destroyed by very
small tensile or compressive strain. We suppose this feature makes the elastomer–HSNP
composite an option for more sensitive tactile elements in robots.
3) The highest sensitivity is expected in the percolation region of a relaxed polyisoprene
composite. The smallest mechanical strain or swelling of the composite matrix remarkably
and reversibly increases resistance of such a composite. The sharper is the percolation
transition of insulator/conductive particle composite the higher should be the compressive
stress sensitivity of sensing element.
4) The investigation of development of percolative structure during curing process could be
very suitable for finding out the optimal vulcanization time of the PHSCNC with the best
compressive strain sensing properties.
4. The investigation of development of percolative structure in PHSCNC
during curing process
To investigate a development of carbon nanoparticle cluster percolative structure during
vulcanization process the test samples with different levels of vulcanization were prepared
and the character of their piezoresistivity was established and compared. Measurements of
mehano-electrical properties as well as SEM investigations were carried out.
First of all PHSCNC samples with 9 and 10 mass parts of filler have been prepared. The
mixing was done using cold rolls. To obtain good electrical connection with samples, clean
sandpapered brass foil mould inserts were used on both sides of the samples. The previous
research approved them to be the most suitable for this need because brass forms permanent
electro-conductive bonding with the PHSCNC during vulcanization. To provide optimal
processing parameters, first the optimal complete curing time of the composite was ensured
using MonsantoRheometer100 rubber rheometer and appeared to be 40 minutes for current
rubber composition. Disk shape PHSCNC samples 18mm in diameter (Figure 2) with 9 and
10 mass parts of filler were made using different curing times in range from 1 to 40 minutes.
40 minutes corresponds to complete vulcanization of PHSCNC and 1 minute was the
smallest possible time to obtain the desired shape of the sample. During “pre-research” the
original method was developed to measure samples initial electrical resistivity “in-situ” in
the curing mould. The results claimed that electrical resistivity of PHSCNC dramatically
drops exactly during the vulcanization (Figure 3). This fact made us to assume, that the
development of percolative electrocondutive structure of filler nanoparticles is happening
during the vulcanisation although.
Fig. 2. Schematic structure of the PHSCNC sample with embedded brass foil electrodes
0 100 200 300 400 500 600
10
2
10
3
10
4
10
5
10
6
10
7
10
8
10
9
10
10
10
11
10
12
20
40
60
80
100
120
140
160
T,
C
*m
t, s
Fig. 3. The change of specific electrical resistivity (black) and temperature (red) as a function
of time for PHSCNC sample with 9 mass parts of carbon.
Composite Material
Electrodes
18 mm
CONTEMPORARYROBOTICS-ChallengesandSolutions112
0.0 0.2 0.4 0.6 0.8 1.0
-10
0
10
20
30
40
50
60
70
R,R
0
, %
P, bar
1min
2min
3min
4min
5min
10min
15min
20min
35min
40min
Fig. 4. The piezoresistance of PHSCNC samples with 10 mass parts of carbon black which
are made using different curing times from 1 to 40 minutes.
The piezoresistive properties of PHSCNC samples were determined using Zwick/Roell Z2.5
universal material testing machine, equipped with HBM 1kN load cell and HBM Spider8
data acquisition module. This allowed the measurements of mechanical and electrical
properties to be taken simultaneously. This testing was done using variable external
operational pressure from 0 to 1 bar, with speed of 1x10
-2
bar·s
-1
. The piezoresistive
properties of samples were determined and evaluated as shown in Figure 4.
To ensure our previous assumption, SEM investigation was made on incompletely
vulcanized samples, fractured in liquid nitrogen. Technically, the smallest possible
vulcanization time here was 3 minutes from 40 which corresponds to 7,5% of complete
vulcanization time. The SEM picture of this sample is shown if Figure 5. It was compared
with SEM image of PHSCNC sample cured for 15 minutes, which corresponds to 35,5% of
complete vulcanization time shown in Figure 6. Comparing these pictures it can be seen,
that sample with less vulcanization time has more uniform structure of conductive filler
particles (opaque dots all over the image). On other hand in sample with more vulcanization
time the conductive filler particles has formed entangled or forked structure. With reference
to (Balberg, 2002), exactly the entangled structure of carbon agglomerates is responsible for
unique conductive properties of percolative concentrations in polymer matrices.
The results indicate that the balance between the maximum piezoresistivity and more
complete relaxation of initial electrical resistivity of sample is critical. If one of them is
greater, the other starts to lack useful dimensions and vice versa. The optimum
vulcanization time was found out to be at least the 12% of the time necessary for complete
vulcanization.
Fig. 5. The SEM image of liquid nitrogen fractured surface of PHSCNC sample with 10 mass
parts of carbon black, cured for 7,5% of time necessary for complete vulcanization. No
structurization of carbon black aggregates.
Fig. 6. The SEM image of liquid nitrogen fractured surface of PHSCNC sample with 10 mass
parts of carbon black, cured for 35,5% of time necessary for complete vulcanization. The
structurization of carbon aggregates (opaque dots) are clearly visible.
Prospectivepolymercompositematerialsforapplicationsinexibletactilesensors 113
0.0 0.2 0.4 0.6 0.8 1.0
-10
0
10
20
30
40
50
60
70
R,R
0
, %
P, bar
1min
2min
3min
4min
5min
10min
15min
20min
35min
40min
Fig. 4. The piezoresistance of PHSCNC samples with 10 mass parts of carbon black which
are made using different curing times from 1 to 40 minutes.
The piezoresistive properties of PHSCNC samples were determined using Zwick/Roell Z2.5
universal material testing machine, equipped with HBM 1kN load cell and HBM Spider8
data acquisition module. This allowed the measurements of mechanical and electrical
properties to be taken simultaneously. This testing was done using variable external
operational pressure from 0 to 1 bar, with speed of 1x10
-2
bar·s
-1
. The piezoresistive
properties of samples were determined and evaluated as shown in Figure 4.
To ensure our previous assumption, SEM investigation was made on incompletely
vulcanized samples, fractured in liquid nitrogen. Technically, the smallest possible
vulcanization time here was 3 minutes from 40 which corresponds to 7,5% of complete
vulcanization time. The SEM picture of this sample is shown if Figure 5. It was compared
with SEM image of PHSCNC sample cured for 15 minutes, which corresponds to 35,5% of
complete vulcanization time shown in Figure 6. Comparing these pictures it can be seen,
that sample with less vulcanization time has more uniform structure of conductive filler
particles (opaque dots all over the image). On other hand in sample with more vulcanization
time the conductive filler particles has formed entangled or forked structure. With reference
to (Balberg, 2002), exactly the entangled structure of carbon agglomerates is responsible for
unique conductive properties of percolative concentrations in polymer matrices.
The results indicate that the balance between the maximum piezoresistivity and more
complete relaxation of initial electrical resistivity of sample is critical. If one of them is
greater, the other starts to lack useful dimensions and vice versa. The optimum
vulcanization time was found out to be at least the 12% of the time necessary for complete
vulcanization.
Fig. 5. The SEM image of liquid nitrogen fractured surface of PHSCNC sample with 10 mass
parts of carbon black, cured for 7,5% of time necessary for complete vulcanization. No
structurization of carbon black aggregates.
Fig. 6. The SEM image of liquid nitrogen fractured surface of PHSCNC sample with 10 mass
parts of carbon black, cured for 35,5% of time necessary for complete vulcanization. The
structurization of carbon aggregates (opaque dots) are clearly visible.
CONTEMPORARYROBOTICS-ChallengesandSolutions114
5. All-elasto-plastic polyisoprene/nanostructured carbon pressure sensing
element with glued conductive rubber electrodes
To obtain completely flexible tactile sensing elements of large area (relative to rigid
piezoelectric sensors) a layer of the active PENC composite is fixed between two conductive
rubber electrodes by means of specially elaborated conductive rubber glue.
5.1 Preparation of samples and organisation of experiment
The PHSCNC was made by rolling high-structured PRINTEX XE2 (DEGUSSA AG) nano-
size carbon black and necessary additional ingredients – sulphur and zinc oxide – into a
Thick Pale Crepe No9 Extra polyisoprene (MARDEC, Inc.) matrix and vulcanizing under 30
bar pressure at 150 C for 15 min. The mean particle size of PRINTEX XE2 is 30 nm, DBP
absorption – 380 ml/100 g, and the BET surface area – 950 m
2
/g.
The polyisoprene – carbon nanotube (PCNT) composites containing dispersed multi-wall
carbon nanotubes (MWCNT) were prepared as follows. The size of MWCNT: OD = 60-100
nm, ID = 5-10 nm, length = 0.5-500 μm, BET surface area: 40-300 m
2
/g. To increase the nano-
particles mobility and to obtain a better dispersion of the nano-particles the matrix was
treated with chloroform. The prepared matrix was allowed to swell for ~ 24 h. The MWCNT
granules were carefully grinded with a small amount of solvent in a china pestle before
adding to the polyisoprene matrix. Solution of the polyisoprene matrix and the concentrated
product of nano-size carbon black were mixed with small glass beads in a blender at room
temperature for 15 min. The product was poured into a small aluminum foil box and let to
stand for ~ 24 h, dried at 40 ºC and vulcanized under high pressure at 160ºC for 20 min
(Knite et al., 2008).
Discs of 16 mm in diameter and 6 mm thick were cut from the vulcanized PHSCNC sheet.
Conductive polyisoprene – HSCB (30 mass parts) composite electrodes were prepared and
fastened to the disc with special conductive adhesive (BISON Kit + 10 mass parts of HSCB)
as shown in Figure 7.
Fig. 7. Picture of completely flexible strain sensing element made of PHSCNC with
conductive rubber electrodes.
Aluminum electrodes were sputtered on opposite sides of the sensing element (20 11.5
2.4 mm) made of the PCNT composite as shown in Figure 8. Electrical resistance of samples
was measured vs mechanical compressive strain and pressure on a modified Zwick/Roell
Z2.5 universal testing machine, HQ stabilized power supply, and a KEITHLEY Model 6487
Picoammeter/Voltage Source all synchronized with HBM Spider 8 data acquisition logger.
Resistance R of the composites was examined with regard to compressive force F and the
absolute mechanical deformation Δl in the direction of the force. Uniaxial pressure and
relative strain were calculated respectively.
Fig. 8. Picture of a strain sensing element made of PCNT composite with sputtered Al
electrodes.
5.2 Experimental results and discussion
The percolation thresholds of PHSCNC and PCNT composites were estimated at first. Of all
the composites examined, the best results were obtained with samples containing 14.5 mass
parts of MWCNT and 10 mass parts HSCB, apparently belonging to the region slightly
above the percolation threshold. Dependence of electrical resistance on uniaxial pressure
first was examined on a PHSCNC disc without the flexible electrodes. Two brass sheets 0.3
mm thick and 16 mm in diameter were inserted between the disc and electrodes of the
testing machine.
Prospectivepolymercompositematerialsforapplicationsinexibletactilesensors 115
5. All-elasto-plastic polyisoprene/nanostructured carbon pressure sensing
element with glued conductive rubber electrodes
To obtain completely flexible tactile sensing elements of large area (relative to rigid
piezoelectric sensors) a layer of the active PENC composite is fixed between two conductive
rubber electrodes by means of specially elaborated conductive rubber glue.
5.1 Preparation of samples and organisation of experiment
The PHSCNC was made by rolling high-structured PRINTEX XE2 (DEGUSSA AG) nano-
size carbon black and necessary additional ingredients – sulphur and zinc oxide – into a
Thick Pale Crepe No9 Extra polyisoprene (MARDEC, Inc.) matrix and vulcanizing under 30
bar pressure at 150 C for 15 min. The mean particle size of PRINTEX XE2 is 30 nm, DBP
absorption – 380 ml/100 g, and the BET surface area – 950 m
2
/g.
The polyisoprene – carbon nanotube (PCNT) composites containing dispersed multi-wall
carbon nanotubes (MWCNT) were prepared as follows. The size of MWCNT: OD = 60-100
nm, ID = 5-10 nm, length = 0.5-500 μm, BET surface area: 40-300 m
2
/g. To increase the nano-
particles mobility and to obtain a better dispersion of the nano-particles the matrix was
treated with chloroform. The prepared matrix was allowed to swell for ~ 24 h. The MWCNT
granules were carefully grinded with a small amount of solvent in a china pestle before
adding to the polyisoprene matrix. Solution of the polyisoprene matrix and the concentrated
product of nano-size carbon black were mixed with small glass beads in a blender at room
temperature for 15 min. The product was poured into a small aluminum foil box and let to
stand for ~ 24 h, dried at 40 ºC and vulcanized under high pressure at 160ºC for 20 min
(Knite et al., 2008).
Discs of 16 mm in diameter and 6 mm thick were cut from the vulcanized PHSCNC sheet.
Conductive polyisoprene – HSCB (30 mass parts) composite electrodes were prepared and
fastened to the disc with special conductive adhesive (BISON Kit + 10 mass parts of HSCB)
as shown in Figure 7.
Fig. 7. Picture of completely flexible strain sensing element made of PHSCNC with
conductive rubber electrodes.
Aluminum electrodes were sputtered on opposite sides of the sensing element (20 11.5
2.4 mm) made of the PCNT composite as shown in Figure 8. Electrical resistance of samples
was measured vs mechanical compressive strain and pressure on a modified Zwick/Roell
Z2.5 universal testing machine, HQ stabilized power supply, and a KEITHLEY Model 6487
Picoammeter/Voltage Source all synchronized with HBM Spider 8 data acquisition logger.
Resistance R of the composites was examined with regard to compressive force F and the
absolute mechanical deformation Δl in the direction of the force. Uniaxial pressure and
relative strain were calculated respectively.
Fig. 8. Picture of a strain sensing element made of PCNT composite with sputtered Al
electrodes.
5.2 Experimental results and discussion
The percolation thresholds of PHSCNC and PCNT composites were estimated at first. Of all
the composites examined, the best results were obtained with samples containing 14.5 mass
parts of MWCNT and 10 mass parts HSCB, apparently belonging to the region slightly
above the percolation threshold. Dependence of electrical resistance on uniaxial pressure
first was examined on a PHSCNC disc without the flexible electrodes. Two brass sheets 0.3
mm thick and 16 mm in diameter were inserted between the disc and electrodes of the
testing machine.
CONTEMPORARYROBOTICS-ChallengesandSolutions116
0 3 6 9 12 15 18 21 24 27 30
0
200
400
600
800
1000
1200
R/R
o
Pressure, MPa
First cycle
Fig. 9. Electrical resistance (in relative units) of an element (without flexible electrodes) of
PHSCNC containing 10 mass parts of HSCB as function of pressure. T = 293 K.
0 3 6 9 12 15 18 21 24 27
0
200
400
600
800
1000
1200
R/R
o
, %
First cycle
Fig. 10. Electrical resistance (in relative units) of an element (without flexible electrodes) of
PHSCNC containing 10 mass parts of HSCB as function of compressive strain . T = 293 K.
The piezoresistance effect in PHSCNC is reversible and positive ((R)/R
0
>0) (Figure 9 and
Figure 10).
As a next the measurements of the piezoresistance effect observed in an element of
PHSCNC with flexible electrodes attached is illustrated in Figure 11 and Figure 12 showing
that the piezoresistance effect decreases approximately 10 times but remains positive.
The positive effect can be explained by transverse slippage of nano-particles caused by
external pressure leading to destruction of the conductive channels.
0 2 4 6 8 1 0 1 2 1 4 1 6 1 8 2 0 2 2
0
2
4
6
8
1 0
1 2
1 4
1 6
1 8
R/R
o
P r e s s u r e , M P a
F irs t c y c l e
Fig. 11. Electrical resistance (in relative units) of an element (with flexible electrodes) of
PHSCNC containing 10 mass parts of HSCB as function of pressure. T = 293 K.
0 3 6 9 1 2 1 5 1 8 2 1 2 4
0
2
4
6
8
1 0
1 2
1 4
1 6
1 8
R/R
o
F irs t cy c le
Fig. 12. Electrical resistance (in relative units) of an element (with flexible electrodes) of
PHSCNC containing 10 mass parts of HSCB as function of compressive strain . T = 293 K.
Prospectivepolymercompositematerialsforapplicationsinexibletactilesensors 117
0 3 6 9 12 15 18 21 24 27 30
0
200
400
600
800
1000
1200
R/R
o
Pressure, MPa
First cycle
Fig. 9. Electrical resistance (in relative units) of an element (without flexible electrodes) of
PHSCNC containing 10 mass parts of HSCB as function of pressure. T = 293 K.
0 3 6 9 12 15 18 21 24 27
0
200
400
600
800
1000
1200
R/R
o
, %
First cycle
Fig. 10. Electrical resistance (in relative units) of an element (without flexible electrodes) of
PHSCNC containing 10 mass parts of HSCB as function of compressive strain . T = 293 K.
The piezoresistance effect in PHSCNC is reversible and positive ((R)/R
0
>0) (Figure 9 and
Figure 10).
As a next the measurements of the piezoresistance effect observed in an element of
PHSCNC with flexible electrodes attached is illustrated in Figure 11 and Figure 12 showing
that the piezoresistance effect decreases approximately 10 times but remains positive.
The positive effect can be explained by transverse slippage of nano-particles caused by
external pressure leading to destruction of the conductive channels.
0 2 4 6 8 1 0 1 2 1 4 1 6 1 8 2 0 2 2
0
2
4
6
8
1 0
1 2
1 4
1 6
1 8
R/R
o
P r e s s u r e , M P a
F irs t c y c l e
Fig. 11. Electrical resistance (in relative units) of an element (with flexible electrodes) of
PHSCNC containing 10 mass parts of HSCB as function of pressure. T = 293 K.
0 3 6 9 1 2 1 5 1 8 2 1 2 4
0
2
4
6
8
1 0
1 2
1 4
1 6
1 8
R/R
o
F irs t cy c le
Fig. 12. Electrical resistance (in relative units) of an element (with flexible electrodes) of
PHSCNC containing 10 mass parts of HSCB as function of compressive strain . T = 293 K.
CONTEMPORARYROBOTICS-ChallengesandSolutions118
As seen from Figures 13, 14 and 15, the electrical resistance of the sensing element of PCNT
composite decreases monotonously with small uniaxial pressure and compressive strain. In
this case the piezoresistance effect is considered as negative ((R)/R
0
<0). For larger values
of uniaxial pressure and compressive strain the piesoresistive effect becomes positive but
compared with a PHSCNC sensing element with flexible electrodes the piezoresistance
effect of the PCNT composite sensing element – the absolute value of (R)/R
0
(Figures 9 and
10 and Figures 11 and 12) is more than 10 times smaller. Thus, the PHSCNC is more
sensitive to mechanical action than the PCNT composite. The latter exhibits a more
monotonous dependence of electrical resistance under small compressive strain.
Moreover, only insignificant changes of disposition of the curve were observed during 20
cycles (Figure 15). We explain the negative piezoresistance effect by formation of new
conductive channels of MWCNT under external pressure.
0,00 0,03 0,06 0,09 0,12 0,15 0,18 0,21
-0,7
-0,6
-0,5
-0,4
-0,3
-0,2
-0,1
0,0
R/R
o
pressureMPa
Max compressive strain 5 %
Fig. 13. Electrical resistance (in relative units) of an element (with Al electrodes) of PCNT
composite containing 14.5 mass parts of MWCNT as function of pressure. T = 293 K.
0,0 0,5 1,0 1,5 2,0 2,5 3,0 3,5 4,0 4,5 5,0
-0,7
-0,6
-0,5
-0,4
-0,3
-0,2
-0,1
0,0
0,1
0,2
R/R
0
First cycle
Fig. 14. Electrical resistance (in relative units) of an element (with Al electrodes) of PCNT
composite containing 14.5 mass parts of MWCNT as function of compressive strain . T =
293 K.
Consequently, the PHSCNC could be a prospective material for pressure-sensitive
indication while the PCNT composite can be considered as a prospective material for
pressure sensors.
5.3 Conclusions on all-elasto-plastic polyisoprene/nanostructured carbon pressure
sensing
Completely flexible sensing elements of polyisoprene – high-structured carbon black and
polyisoprene – multi-wall carbon nanotube composites have been designed, prepared and
examined. The first composite having a permanent drift of its mean electrical parameters is
found to be a prospective material for indication of pressure change. The other composite
has shown good pressure sensor properties being capable to withstand many small but
completely stable and reversible piezoresistive cycles.
Prospectivepolymercompositematerialsforapplicationsinexibletactilesensors 119
As seen from Figures 13, 14 and 15, the electrical resistance of the sensing element of PCNT
composite decreases monotonously with small uniaxial pressure and compressive strain. In
this case the piezoresistance effect is considered as negative ((R)/R
0
<0). For larger values
of uniaxial pressure and compressive strain the piesoresistive effect becomes positive but
compared with a PHSCNC sensing element with flexible electrodes the piezoresistance
effect of the PCNT composite sensing element – the absolute value of (R)/R
0
(Figures 9 and
10 and Figures 11 and 12) is more than 10 times smaller. Thus, the PHSCNC is more
sensitive to mechanical action than the PCNT composite. The latter exhibits a more
monotonous dependence of electrical resistance under small compressive strain.
Moreover, only insignificant changes of disposition of the curve were observed during 20
cycles (Figure 15). We explain the negative piezoresistance effect by formation of new
conductive channels of MWCNT under external pressure.
0,00 0,03 0,06 0,09 0,12 0,15 0,18 0,21
-0,7
-0,6
-0,5
-0,4
-0,3
-0,2
-0,1
0,0
R/R
o
pressureMPa
Max compressive strain 5 %
Fig. 13. Electrical resistance (in relative units) of an element (with Al electrodes) of PCNT
composite containing 14.5 mass parts of MWCNT as function of pressure. T = 293 K.
0,0 0,5 1,0 1,5 2,0 2,5 3,0 3,5 4,0 4,5 5,0
-0,7
-0,6
-0,5
-0,4
-0,3
-0,2
-0,1
0,0
0,1
0,2
R/R
0
First cycle
Fig. 14. Electrical resistance (in relative units) of an element (with Al electrodes) of PCNT
composite containing 14.5 mass parts of MWCNT as function of compressive strain . T =
293 K.
Consequently, the PHSCNC could be a prospective material for pressure-sensitive
indication while the PCNT composite can be considered as a prospective material for
pressure sensors.
5.3 Conclusions on all-elasto-plastic polyisoprene/nanostructured carbon pressure
sensing
Completely flexible sensing elements of polyisoprene – high-structured carbon black and
polyisoprene – multi-wall carbon nanotube composites have been designed, prepared and
examined. The first composite having a permanent drift of its mean electrical parameters is
found to be a prospective material for indication of pressure change. The other composite
has shown good pressure sensor properties being capable to withstand many small but
completely stable and reversible piezoresistive cycles.
CONTEMPORARYROBOTICS-ChallengesandSolutions120
0,0 0,5 1,0 1,5 2,0 2,5 3,0 3,5 4,0 4,5 5,0
-0,7
-0,6
-0,5
-0,4
-0,3
-0,2
-0,1
0,0
0,1
0,2
R/R
0
1 cycle
1st cycle
20th cycle
20th cycle
Fig. 15. Electrical resistance (in relative units) of an element (with Al electrodes) of PCNT
composite containing 14.5 mass parts of MWCNT as function of compressive strain . 20
loading cycles. T=293 K.
6. All-elasto-plastic polyisoprene/nanostructured carbon pressure sensing
element with vulcanized conductive rubber electrodes
In this paragraph our recent success in the design, processing and studies of properties of
vulcanized foliated composite sensor element is reported.
6.1 Preparation of samples and organisation of experiment
The polyisoprene – nano-structured carbon black composite was made by rolling high-
structure PRINTEX XE2 (DEGUSSA AG) nano-size carbon black (CB) and necessary
additional ingredients (sulphur and zinc oxide) into a Thick Pale Crepe No9 Extra
polyisoprene (MARDEC, Inc.) matrix and vulcanizing under 3 MPa pressure at 155 C for 20
min. The mean particle size of PRINTEX XE2 is 30 nm, DBP absorption – 380 ml/100 g, and
the BET surface area – 950 m
2
/g.
The sensor element was made as follows. Two blends of polyisoprene accordingly with 30
and 10 phr (parts per hundred rubber) carbon black have been mixed. Initially 30 phr of
PRINTEX have been used for obtaining PENC composite electrodes, but the tests of
mechanical and electrical properties showed, that electrodes made from PENC composites
with 20 phr of PRINTEX were as much conductive as 30 phr carbon black/polyisoprene
electrodes but had better elasticity as well as superior adhesion to active element. Three
semi-finished rounded sheets made from mentioned above two PENC composite blends
have been formed and fitted onto special steel die. Those are two sheets for conductive
electrodes (30 phr CB) and one sensitive sheet (10 phr CB) for pressure-sensing part. Each of
these three sheets were separately pre-shaped under 3 MPa pressure and 110°C temperature
to obtain disk shape. This operation lasted for 10 minutes. After that the components were
cooled and cleaned with ethanol. Further, all three parts were joined together in one sensor
element and were placed into the steel die and vulcanized under pressure of 3 MPa and 155°
C temperature for 20 minutes vulcanization (previous attempts (Knite et al., 2008) to create
sensor element with conductive glue were shown to be relatively ineffective due to later
sample dezintegration). To study mechano-electrical properties small brass foil electrodes
were inserted into die before vulcanization. Finally, disc shape sensor 50 mm in diameter
and 3 mm thick was obtained. From this preparation we cut out useful sensor elements for
testing (Figure 16). The Brass foil electrode extensions shown in this picture are necessary
only to make soldered wire connection for resistivity measurements.
Fig. 16. The accomplished all-elasto-plastic sensor element with brass foil electrode
extensions.
A modified Zwick/Roell Z2.5 universal testing machine, HQ stabilized power supply and a
KEITHLEY Model 6487 Picoammeter/Voltage Source was used for testing mechanical and
electrical properties of sensor elements. All devices were synchronized with the HBM Spider
8 data acquisition logger. Resistance R versus compressive force F was examined. Uniaxial
pressure was calculated respectively.
Prospectivepolymercompositematerialsforapplicationsinexibletactilesensors 121
0,0 0,5 1,0 1,5 2,0 2,5 3,0 3,5 4,0 4,5 5,0
-0,7
-0,6
-0,5
-0,4
-0,3
-0,2
-0,1
0,0
0,1
0,2
R/R
0
1 cycle
1st cycle
20th cycle
20th cycle
Fig. 15. Electrical resistance (in relative units) of an element (with Al electrodes) of PCNT
composite containing 14.5 mass parts of MWCNT as function of compressive strain . 20
loading cycles. T=293 K.
6. All-elasto-plastic polyisoprene/nanostructured carbon pressure sensing
element with vulcanized conductive rubber electrodes
In this paragraph our recent success in the design, processing and studies of properties of
vulcanized foliated composite sensor element is reported.
6.1 Preparation of samples and organisation of experiment
The polyisoprene – nano-structured carbon black composite was made by rolling high-
structure PRINTEX XE2 (DEGUSSA AG) nano-size carbon black (CB) and necessary
additional ingredients (sulphur and zinc oxide) into a Thick Pale Crepe No9 Extra
polyisoprene (MARDEC, Inc.) matrix and vulcanizing under 3 MPa pressure at 155 C for 20
min. The mean particle size of PRINTEX XE2 is 30 nm, DBP absorption – 380 ml/100 g, and
the BET surface area – 950 m
2
/g.
The sensor element was made as follows. Two blends of polyisoprene accordingly with 30
and 10 phr (parts per hundred rubber) carbon black have been mixed. Initially 30 phr of
PRINTEX have been used for obtaining PENC composite electrodes, but the tests of
mechanical and electrical properties showed, that electrodes made from PENC composites
with 20 phr of PRINTEX were as much conductive as 30 phr carbon black/polyisoprene
electrodes but had better elasticity as well as superior adhesion to active element. Three
semi-finished rounded sheets made from mentioned above two PENC composite blends
have been formed and fitted onto special steel die. Those are two sheets for conductive
electrodes (30 phr CB) and one sensitive sheet (10 phr CB) for pressure-sensing part. Each of
these three sheets were separately pre-shaped under 3 MPa pressure and 110°C temperature
to obtain disk shape. This operation lasted for 10 minutes. After that the components were
cooled and cleaned with ethanol. Further, all three parts were joined together in one sensor
element and were placed into the steel die and vulcanized under pressure of 3 MPa and 155°
C temperature for 20 minutes vulcanization (previous attempts (Knite et al., 2008) to create
sensor element with conductive glue were shown to be relatively ineffective due to later
sample dezintegration). To study mechano-electrical properties small brass foil electrodes
were inserted into die before vulcanization. Finally, disc shape sensor 50 mm in diameter
and 3 mm thick was obtained. From this preparation we cut out useful sensor elements for
testing (Figure 16). The Brass foil electrode extensions shown in this picture are necessary
only to make soldered wire connection for resistivity measurements.
Fig. 16. The accomplished all-elasto-plastic sensor element with brass foil electrode
extensions.
A modified Zwick/Roell Z2.5 universal testing machine, HQ stabilized power supply and a
KEITHLEY Model 6487 Picoammeter/Voltage Source was used for testing mechanical and
electrical properties of sensor elements. All devices were synchronized with the HBM Spider
8 data acquisition logger. Resistance R versus compressive force F was examined. Uniaxial
pressure was calculated respectively.
CONTEMPORARYROBOTICS-ChallengesandSolutions122
6.2 Experimental results and discussion
Before testing the accomplished sensor element, we measured the electrical properties of
separate vulcanized electrode layers. We also separately tested the mechano-electrical
properties of vulcanized active element layer to see whether it has expected sensing
capabilities. The active element of the sensor (nano-structured carbon black composite with
10 phr) belongs to the region of the percolation threshold (specific electrical resistance ρ = 12
Ω·m). The specific resistance for flexible electrodes is in the order of 0.1 Ω·m, which is
noticeably above the percolation threshold.
Let’s look closer at the conductive properties of sensors. Measurement results for electrical
resistance versus pressure for small pressure range are given in Figure 17.
0,0 0,2 0,4 0,6 0,8 1,0
88
90
92
94
96
98
, m
P, bar
Start of an experiment
1st cycle
10th cycle
Fig. 17. Electrical resistance of the all-elasto-plastic sensor element as function of cyclic
pressure (pressure range 0 to 1 bar, T = 294
0
K)
0 2 4 6 8 10
100
200
300
400
500
m
P, bar
Start of an experiment
1st cycle
10th cycle
Fig. 18. Electrical resistance of the all-elasto-plastic sensor element as function of cyclic
pressure (pressure range 0 to 10 bar, T = 294
0
K)
Measurement results for relatively large pressure range are shown in Figure 18. The
observed positive piezoresistance effect can be explained by transverse slip of nano-particles
caused by external pressure leading to disarrangement of the conductive channels.
Because of higher mobility of HSNP compared to LSNP the electro-conductive network in
the elastomer matrix is easily disarranged by very small tensile, compressive or shear strain.
We suppose this feature makes the elastomer–HSNP composite an option for flexible
sensitive tactile elements for robots and automatics.
The scanning electron microscopy (SEM) was used to check the quality of joined regions of
three PENC sheets of the AEP sensor element. SEM micrographs of fracture surface of the
sensor element are shown in Figure 19. To prepare the sample for SEM investigations the
sensor element was fractured in liquid nitrogen. Good joint quality of all three PENC sheets
can be clearly visible in SEM images with different scales. Pale regions correspond to
electrically more conductive PENC composite with 30 phr CB and dark regions cover the
PENC composite with 10 phr CB. The pale particles, which are visible in the bottom picture,
are carbon nano-particles.
A functional model of low-pressure-sensitive indicator was made. The block diagram of
pressure indication circuit is shown on Figure 20. The sensor is connected to power supply
(PS) via resistor (R) and to the input of amplifier (Amp). Transistor-based two-stage
amplifier includes integrating elements. These elements are necessary to avoid noise from
Prospectivepolymercompositematerialsforapplicationsinexibletactilesensors 123
6.2 Experimental results and discussion
Before testing the accomplished sensor element, we measured the electrical properties of
separate vulcanized electrode layers. We also separately tested the mechano-electrical
properties of vulcanized active element layer to see whether it has expected sensing
capabilities. The active element of the sensor (nano-structured carbon black composite with
10 phr) belongs to the region of the percolation threshold (specific electrical resistance ρ = 12
Ω·m). The specific resistance for flexible electrodes is in the order of 0.1 Ω·m, which is
noticeably above the percolation threshold.
Let’s look closer at the conductive properties of sensors. Measurement results for electrical
resistance versus pressure for small pressure range are given in Figure 17.
0,0 0,2 0,4 0,6 0,8 1,0
88
90
92
94
96
98
, m
P, bar
Start of an experiment
1st cycle
10th cycle
Fig. 17. Electrical resistance of the all-elasto-plastic sensor element as function of cyclic
pressure (pressure range 0 to 1 bar, T = 294
0
K)
0 2 4 6 8 10
100
200
300
400
500
m
P, bar
Start of an experiment
1st cycle
10th cycle
Fig. 18. Electrical resistance of the all-elasto-plastic sensor element as function of cyclic
pressure (pressure range 0 to 10 bar, T = 294
0
K)
Measurement results for relatively large pressure range are shown in Figure 18. The
observed positive piezoresistance effect can be explained by transverse slip of nano-particles
caused by external pressure leading to disarrangement of the conductive channels.
Because of higher mobility of HSNP compared to LSNP the electro-conductive network in
the elastomer matrix is easily disarranged by very small tensile, compressive or shear strain.
We suppose this feature makes the elastomer–HSNP composite an option for flexible
sensitive tactile elements for robots and automatics.
The scanning electron microscopy (SEM) was used to check the quality of joined regions of
three PENC sheets of the AEP sensor element. SEM micrographs of fracture surface of the
sensor element are shown in Figure 19. To prepare the sample for SEM investigations the
sensor element was fractured in liquid nitrogen. Good joint quality of all three PENC sheets
can be clearly visible in SEM images with different scales. Pale regions correspond to
electrically more conductive PENC composite with 30 phr CB and dark regions cover the
PENC composite with 10 phr CB. The pale particles, which are visible in the bottom picture,
are carbon nano-particles.
A functional model of low-pressure-sensitive indicator was made. The block diagram of
pressure indication circuit is shown on Figure 20. The sensor is connected to power supply
(PS) via resistor (R) and to the input of amplifier (Amp). Transistor-based two-stage
amplifier includes integrating elements. These elements are necessary to avoid noise from
CONTEMPORARYROBOTICS-ChallengesandSolutions124
induced currents and to flatten the wavefronts. The first stage amplifies the signal in linear
mode. The second stage works in saturation mode. The output of the amplifier is connected
to the comparator (Comp), which forms sharp wavefronts.
These signals are passed to the differential circuit and they form a sharp pulse, which is
passed further to the one-shot multivibrator (OSM).
The duration of the pulse of the OSM is adjustable. The OSM is necessary to form the
determined length of pulse which is independent from AEP sensor element deformation
time. The output of OSM is connected to performing device PD (indicator/counter or
actuator). Current setup allowed us to use AEP sensor element as a external pressure
sensitive switch to temporary turn on any external electrical equipment (ambient
illumination, for example), connected through our device to conventional 220V AC power
source.
Fig. 19. SEM micrographs of sensor element. Sensor element was frozen in liquid nitrogen
and then broken in two. One of the broken sides is shown in different scales: 20 μm, 5 μm
and 2 μm. Boundary between two PENC composite layers with 10 and 30 phr (parts per
hundred rubber) carbon black are shown.
Fig. 20. Block diagram of pressure-sensitive indication circuit with completely elasto-plastic
sensing element
6.3 Conclusions on all-elasto-plastic polyisoprene/nanostructured carbon pressure
sensing element with vulcanized conductive rubber electrodes
Completely flexible polyisoprene – high-structured carbon black all-elasto-plastic sensing
element has been designed, prepared and examined.
The sensor element was composed of two electrically conductive composite layers
(electrodes) and piezoresistive PENC layer (active element) between them. A method for
curing three-layer hybrid composite for pressure sensing application was developed. The
Prospectivepolymercompositematerialsforapplicationsinexibletactilesensors 125
induced currents and to flatten the wavefronts. The first stage amplifies the signal in linear
mode. The second stage works in saturation mode. The output of the amplifier is connected
to the comparator (Comp), which forms sharp wavefronts.
These signals are passed to the differential circuit and they form a sharp pulse, which is
passed further to the one-shot multivibrator (OSM).
The duration of the pulse of the OSM is adjustable. The OSM is necessary to form the
determined length of pulse which is independent from AEP sensor element deformation
time. The output of OSM is connected to performing device PD (indicator/counter or
actuator). Current setup allowed us to use AEP sensor element as a external pressure
sensitive switch to temporary turn on any external electrical equipment (ambient
illumination, for example), connected through our device to conventional 220V AC power
source.
Fig. 19. SEM micrographs of sensor element. Sensor element was frozen in liquid nitrogen
and then broken in two. One of the broken sides is shown in different scales: 20 μm, 5 μm
and 2 μm. Boundary between two PENC composite layers with 10 and 30 phr (parts per
hundred rubber) carbon black are shown.
Fig. 20. Block diagram of pressure-sensitive indication circuit with completely elasto-plastic
sensing element
6.3 Conclusions on all-elasto-plastic polyisoprene/nanostructured carbon pressure
sensing element with vulcanized conductive rubber electrodes
Completely flexible polyisoprene – high-structured carbon black all-elasto-plastic sensing
element has been designed, prepared and examined.
The sensor element was composed of two electrically conductive composite layers
(electrodes) and piezoresistive PENC layer (active element) between them. A method for
curing three-layer hybrid composite for pressure sensing application was developed. The
CONTEMPORARYROBOTICS-ChallengesandSolutions126
joining in-between conductive flexible electrodes and sensitive sensor material was
remarkably improved. The piezoresistive behaviour of the polyisoprene/high structured
carbon black has been explained by the tunnelling model.
Hybrid three-layer polyisoprene/high-structure carbon black composite has shown good
pressure sensing properties. Functioning model of low-pressure-sensitive indication circuit
which can turn on suitable actuator has been made.
7. Acknowledgements
The authors acknowledge R.Orlovs for electronic support, V.Teteris, J.Barloti and
V.Tupureina for technical help as well as fruitful discussions and the master students
G.Mallefan, S.Zike and G.Podins for assistance in carrying out some of the experiments. This
work has been supported by National Program “Material Science”as well as partly by the
European Social Fund within the National Programme „Support for the carrying out
doctoral study programm’s and post-doctoral researches” project „Support for the
development of doctoral studies at Riga Technical University”.
8. References
Aneli, J.N., Zaikov, G.E., Khananashvili, I.M., 1999. Effects of mechanical deformations on
the structurization and electric conductivity of electric conducting polymer
composites. Journal of Applied Polymer Science, 74: 601-621.
Balberg, I., 2002. A comprehensive picture of the electrical phenomena in carbon black-
polymer composites. Carbon, 40: 139-143.
Barra, G.M.O., Matins, R.R., Kafer, K.A., Paniago, R., Vasques, C.T., Pires, A.T.N., 2008.
Thermoplastic elastomer/polyaniline blends: evaluation of mechanical and
electromechanical properties, Polymer Testing, 27: 886-892.
Bloor, D., Donnelly, K., Hands, P.J., Laughlin, P., Lussey, D., 2005. A metal-polymer
composite with unusual properties, Journal of Physics D: Appl.Phys., 38: 2851-2860.
Bokobza, L., 2007. Multiwall carbon nanotube elastomeric composites: a review, Polymer,
48: 4907-4920.
Chen, L., Chen, G., Lu, L., 2007. Piezoresistive behaviour study on finger-sensing silicone
rubber/graphite nanosheet nanocomposites, Advanced Functional Materials, 17: 898-
904.
Das, N.C., Chaki, T.K., Khastgir, D., 2002. Effect of axial stretching on electrical resistivity of
short carbon fibre and carbon black filled conductive rubber composites. Polymer
International, 51: 156-163.
Dharap, P., Li, Z., Nagarjaiah, S., Barrera, E.V., 2004. Nanotube film based on single-wall
carbon nanotubes for strain sensing, Nanotechnology, 15: 379-382.
Dohta, S., Ban, Y., Matsushita, H., 2000. Application of a flexible strain sensor to a pneumatic
rubber hand. Proc. of 6th Triennal International Symposium on Fluid Control,
Measurement and Visualization, Canada, Sherbrooke, 87.
Farajian, A.A., Yakobson, B.I., Mizuseki, H., Kawazoe, Y., 2003. Electronic transport through
bent carbon nanotubes: nanoelectromechanical sensors and switches. Physical
Review B, 67 205423-1 – 205423-6.
Flandin, L., Brechet, Y., Cavaille, J.Y., 2001. Electrically conductive polymer nanocomposites
as deformation sensors. Composites science and technology, 61: 895-901
Heo, J.S., Chung, J.H., Lee, J.J., 2006. Tactile sensor arrays using fiber Bragg grating sensors,
Sens.Actuator A, 126: 312-327.
Hu, N., Yoshifumi, K. Yan, C., Masuda, Z., Fukunaga, H., 2008. Tunneling effect in a
polymer/carbon nanotube composite strain sensor, Acta Materialia, 56: 2929-2936.
Ishigure, Y., Ijima, S., Ito, H., Ota, T., Unuma, H., Takahashi, M., Hikichi, Y., Suzuki, H.,
1999. Electrical and elastic properties of conductor-polymer composites. Journal of
Materials Science, 34: 2979-2985.
Job, A.E., Oliveira, F.A., Alves, N., Giacometti, J.A., Mattoso, L.H.C., 2003. Conductive
composites of natural ruber and carbon black for pressure sensors. Syntetic metals,
135-136: 99-100
Knite, M., Ozols, K, Zavickis, J., Tupureina,V., Klemenoks,I., Orlovs,R., 2009. Elastomer –
Carbon Nanotube Composites as Prospective Multifunctional Sensing Materials.
Journal of Nanoscience and Nanotechnology, 9: 3587-3592.
Knite, M., Podins, G., Zike, S., Zavickis, J., Tupureina, V., 2008. Elastomer – carbon
nanostructure composites as prospective materials for flexible robotic tactile
sensors. In Proc. of 5
th
International Conference on Informatics in Control, Automation
and Robotic, 1: 234-238.
Knite, M., Klemenok, I., Shakale, G., Teteris, V., Zicans, J., 2007. Polyisoprene-carbon nano-
composites for application in multifunctional sensors, Journal of Alloys and
Compounds, 434-435: 850-853, a.
Knite, M., Tupureina, V., Fuith, A., Zavickis, J., Teteris, V., 2007. Polyisoprene – multi-wall
carbon nanotube composites for sensing strain, Materials Science & Engineering C,
27: 1125-1128, b.
Knite, M., Hill, A., Pas, S.,J., Teteris, V., Zavickis, J., 2006. Effects of plasticizer and strain on
the percolation threshold in polyisoprene-carbon nanocomposites: positron
annihilation lifetime spectroscopy and electric resistance measurements, Materials
Science & Engineering C, 26: 771-775
Knite, M., Tupureina, V., Dzene, A., Teteris,V., Ķiploka, S., Zavickis, J., 2005. Influence of
plasticizer on the improovement of strain sensing effect in polymer-carbon nano-
composites, Chemical Technology, 36: 5-10.
Knite, M., Teteris, V., Kiploka, A., Kaupuzs , J., 2004. Polyisoprene-carbon black
nanocomposites as strain and pressure sensor materials, Sens.Actuator A, 110: 142-
149, a.
Knite, M., Teteris, V., Aulika, I., Kabelka, H., Fuith, A., 2004. Alternating-current properties
of elastomer-carbon nanocomposites, Advanced Engineering Materials, 6: 746-749, b.
Knite, M., Teteris, V., Polyakov, B., Erts, D., 2002. Electric and elastic properties of
conductive polymeric nanocomposites on macro- and nanoscales. Materials Science
& Engineering C, 19: 5-19.
Lee, B., Roh, S., Park, J. 2009. Current status of micro- and nanostructured fiber sensors,
Optical Fiber Technology, 15: 209-221.
Li, X., Levy, C., Elaadil, L., 2008. Multiwalled carbon nanotube film for strain sensing,
Nanotechnology, IOP Publishing, 19: 7 pp.
Prospectivepolymercompositematerialsforapplicationsinexibletactilesensors 127
joining in-between conductive flexible electrodes and sensitive sensor material was
remarkably improved. The piezoresistive behaviour of the polyisoprene/high structured
carbon black has been explained by the tunnelling model.
Hybrid three-layer polyisoprene/high-structure carbon black composite has shown good
pressure sensing properties. Functioning model of low-pressure-sensitive indication circuit
which can turn on suitable actuator has been made.
7. Acknowledgements
The authors acknowledge R.Orlovs for electronic support, V.Teteris, J.Barloti and
V.Tupureina for technical help as well as fruitful discussions and the master students
G.Mallefan, S.Zike and G.Podins for assistance in carrying out some of the experiments. This
work has been supported by National Program “Material Science”as well as partly by the
European Social Fund within the National Programme „Support for the carrying out
doctoral study programm’s and post-doctoral researches” project „Support for the
development of doctoral studies at Riga Technical University”.
8. References
Aneli, J.N., Zaikov, G.E., Khananashvili, I.M., 1999. Effects of mechanical deformations on
the structurization and electric conductivity of electric conducting polymer
composites. Journal of Applied Polymer Science, 74: 601-621.
Balberg, I., 2002. A comprehensive picture of the electrical phenomena in carbon black-
polymer composites. Carbon, 40: 139-143.
Barra, G.M.O., Matins, R.R., Kafer, K.A., Paniago, R., Vasques, C.T., Pires, A.T.N., 2008.
Thermoplastic elastomer/polyaniline blends: evaluation of mechanical and
electromechanical properties, Polymer Testing, 27: 886-892.
Bloor, D., Donnelly, K., Hands, P.J., Laughlin, P., Lussey, D., 2005. A metal-polymer
composite with unusual properties, Journal of Physics D: Appl.Phys., 38: 2851-2860.
Bokobza, L., 2007. Multiwall carbon nanotube elastomeric composites: a review, Polymer,
48: 4907-4920.
Chen, L., Chen, G., Lu, L., 2007. Piezoresistive behaviour study on finger-sensing silicone
rubber/graphite nanosheet nanocomposites, Advanced Functional Materials, 17: 898-
904.
Das, N.C., Chaki, T.K., Khastgir, D., 2002. Effect of axial stretching on electrical resistivity of
short carbon fibre and carbon black filled conductive rubber composites. Polymer
International, 51: 156-163.
Dharap, P., Li, Z., Nagarjaiah, S., Barrera, E.V., 2004. Nanotube film based on single-wall
carbon nanotubes for strain sensing, Nanotechnology, 15: 379-382.
Dohta, S., Ban, Y., Matsushita, H., 2000. Application of a flexible strain sensor to a pneumatic
rubber hand. Proc. of 6th Triennal International Symposium on Fluid Control,
Measurement and Visualization, Canada, Sherbrooke, 87.
Farajian, A.A., Yakobson, B.I., Mizuseki, H., Kawazoe, Y., 2003. Electronic transport through
bent carbon nanotubes: nanoelectromechanical sensors and switches. Physical
Review B, 67 205423-1 – 205423-6.
Flandin, L., Brechet, Y., Cavaille, J.Y., 2001. Electrically conductive polymer nanocomposites
as deformation sensors. Composites science and technology, 61: 895-901
Heo, J.S., Chung, J.H., Lee, J.J., 2006. Tactile sensor arrays using fiber Bragg grating sensors,
Sens.Actuator A, 126: 312-327.
Hu, N., Yoshifumi, K. Yan, C., Masuda, Z., Fukunaga, H., 2008. Tunneling effect in a
polymer/carbon nanotube composite strain sensor, Acta Materialia, 56: 2929-2936.
Ishigure, Y., Ijima, S., Ito, H., Ota, T., Unuma, H., Takahashi, M., Hikichi, Y., Suzuki, H.,
1999. Electrical and elastic properties of conductor-polymer composites. Journal of
Materials Science, 34: 2979-2985.
Job, A.E., Oliveira, F.A., Alves, N., Giacometti, J.A., Mattoso, L.H.C., 2003. Conductive
composites of natural ruber and carbon black for pressure sensors. Syntetic metals,
135-136: 99-100
Knite, M., Ozols, K, Zavickis, J., Tupureina,V., Klemenoks,I., Orlovs,R., 2009. Elastomer –
Carbon Nanotube Composites as Prospective Multifunctional Sensing Materials.
Journal of Nanoscience and Nanotechnology, 9: 3587-3592.
Knite, M., Podins, G., Zike, S., Zavickis, J., Tupureina, V., 2008. Elastomer – carbon
nanostructure composites as prospective materials for flexible robotic tactile
sensors. In Proc. of 5
th
International Conference on Informatics in Control, Automation
and Robotic, 1: 234-238.
Knite, M., Klemenok, I., Shakale, G., Teteris, V., Zicans, J., 2007. Polyisoprene-carbon nano-
composites for application in multifunctional sensors, Journal of Alloys and
Compounds, 434-435: 850-853, a.
Knite, M., Tupureina, V., Fuith, A., Zavickis, J., Teteris, V., 2007. Polyisoprene – multi-wall
carbon nanotube composites for sensing strain, Materials Science & Engineering C,
27: 1125-1128, b.
Knite, M., Hill, A., Pas, S.,J., Teteris, V., Zavickis, J., 2006. Effects of plasticizer and strain on
the percolation threshold in polyisoprene-carbon nanocomposites: positron
annihilation lifetime spectroscopy and electric resistance measurements, Materials
Science & Engineering C, 26: 771-775
Knite, M., Tupureina, V., Dzene, A., Teteris,V., Ķiploka, S., Zavickis, J., 2005. Influence of
plasticizer on the improovement of strain sensing effect in polymer-carbon nano-
composites, Chemical Technology, 36: 5-10.
Knite, M., Teteris, V., Kiploka, A., Kaupuzs , J., 2004. Polyisoprene-carbon black
nanocomposites as strain and pressure sensor materials, Sens.Actuator A, 110: 142-
149, a.
Knite, M., Teteris, V., Aulika, I., Kabelka, H., Fuith, A., 2004. Alternating-current properties
of elastomer-carbon nanocomposites, Advanced Engineering Materials, 6: 746-749, b.
Knite, M., Teteris, V., Polyakov, B., Erts, D., 2002. Electric and elastic properties of
conductive polymeric nanocomposites on macro- and nanoscales. Materials Science
& Engineering C, 19: 5-19.
Lee, B., Roh, S., Park, J. 2009. Current status of micro- and nanostructured fiber sensors,
Optical Fiber Technology, 15: 209-221.
Li, X., Levy, C., Elaadil, L., 2008. Multiwalled carbon nanotube film for strain sensing,
Nanotechnology, IOP Publishing, 19: 7 pp.
CONTEMPORARYROBOTICS-ChallengesandSolutions128
Lu, J., Chen, X., Lu, W., Chen, G., 2006. The piezoresistive behaviours of
polyethilene/foliated graphite nanocomposites, European Polymer Journal, 42: 1015-
1021.
Mohanraj, G.T., Dey, P.K., Chaki, T.K., Chakraborty, A., Khastgir, D., 2007. Effect of
temperature, pressure, and composition on DC resistivity and AC conductivity of
conductive styrene-butadiene rubber-particulate metal alloy nanocomposites,
Polymer Composites, DOI 10.1002/pe: 696-704.
Pham, G., Park, Y.B., Liang, Z., Zhang, C. Wang, B., 2008. Processing and modeling of
conductive thermoplastic/carbon nanotube films for strain sensing, Composites: part
B, 39: 209-216.
Roldughin, V.I, Vysotskii, V.V., 2000. Percolation properties of metal-filled polymer films,
structure and mechanisms of conductivity, Progress in Organic Coatings, 39: 81-100.
Staufer, D. and Aharony, A., 1992. Introduction in to percolation theory, Washington: Taylor
Francis, 198.
Wolf, E.L., 2004. Nanophysics and Nanotechnology. Weinheim: WileY-VCH Verlag GmbH &
KgaA, 174.
Xie, H.,Q., Ma, Y.,M., 2000. Change of conductivity of polyaniline/(styrene-butadiene-
styrene) triblock copolymer composites during mechanical deformation. Journal of
Applied polymer Science, 77: 2156-2164.
Yang, S., Chen, X., Motojima, S., 2006. Tactile sensing properties of protein-like single helix
carbon microcoils, Letters to the Editor/ Carbon, 44: 3348-3378.
Yang, S., Sheng, P., 2000. Physics and Chemistry of Nanostructured Materials. London and New
York: Taylor and Francis, 241.
Yoshimura, K., Nakano, K., Miyake, T., Hishikawa, Y., Kuzuya, C., Katsuno, T., Motojima, S.
2007. Effect of compressive and tensile strains on the electrical resistivity of carbon
microcoil/silicone-rubber composites, Carbon, 45: 1997-2003.
Zavickis, J., Knite, M., Teteris, V., Zike, S., Tupureina, V., 2008. Polyisoprene-nanostructured
carbon black composite for pressure sensors – processing and mechano-electrical
properties, Proc. of the International Scientific Conference “Material science and
manufacturing technology” MITECH 2008, Czech Republic, Prague, 235-240.
Zhang, X.W., Pan, Y., Zheng, Q., Yi X. S., 2000. Time dependence of piezoresistance for the
conductor filled polymer composites. Journal of Polymer Science B., 38: 2739-2749.
SimultaneousLocalizationandMapping(SLAM)ofaMobileRobot
BasedonFusionofOdometryandVisualDataUsingExtendedKalmanFilter 129
Simultaneous Localization and Mapping (SLAM) of a Mobile Robot
BasedonFusionofOdometryandVisualDataUsingExtendedKalman
Filter
AndréM.SantanaandAdelardoA.D.Medeiros
X
Simultaneous Localization and Mapping (SLAM)
of a Mobile Robot Based on Fusion of Odometry
and Visual Data Using Extended Kalman Filter
André M. Santana
†
and Adelardo A. D. Medeiros
‡
†
Federal University of Piauí – UFPI
Department of Informatics and Statistics – DIE
Teresina - Piauí – Brasil
‡
Federal University of Rio Grande do Norte – UFRN
Department of Computer Engineering and Automation - DCA
Natal – Rio Grande do Norte - Brasil
1. Introduction
The term SLAM is used as an abbreviation for Simultaneous Localization and Mapping, and
was originally developed by Leonard & Durrant-Whyte (1991) based on previous work by
Smith et al. (1987). In the SLAM problem, a mobile robot uses its sensors to explore the
environment, gains knowledge about it, interprets the scenario, builds an appropriate map
and then calculates its location relative to it. The maps can be illustrated in several ways,
such as occupation grids and characteristic maps. We are interested in the second
illustration. A detailed theoretical description about the topic can be found in Durrant &
Bailey (2006).
In addition to perception reliability, for the general acceptance of applications, the
technologies used must provide a solution at a reasonable cost, that is, the components must
be inexpensive. A solution is to use optical sensors in the robots to solve environment
perception problems. Due to the wide use of personal digital cameras, cameras on
computers and cell phones, the price of image sensors has decreased significantly, making
them an attractive option. Furthermore, the cameras can be used to solve a series of key
problems in robotics and in other automatized operations, as they provide a large variety of
environmental information, use little energy, and are easily integrated into the robot
hardware.
The main challenges are to take advantage of this powerful and inexpensive sensor to create
reliable and efficient algorithms that can extract the necessary information for the solution of
problems in robotics. When cameras are used in robots as the main sensors for solving
SLAM problems, the literature uses the term visual SLAM to denote this process, the
objective of this study.
The major challenges in visual SLAM are: a) how to detect characteristics in images; b) how
to recognize if a detected characteristic is or is not the same as one previously detected; c)
8
CONTEMPORARYROBOTICS-ChallengesandSolutions130
how to decide if a newly detected characteristic will or will not be adopted as a new
landmark; d) how to calculate the 3D position of the landmarks from 2D images; and e) how
to estimate the uncertainty associated with the calculated values. In general, all of these
aspects must be resolved. However, in special situations, it is possible to develop specific
strategies to overcome all of these problems. This is the aim of this work.
The system that will be presented shows a visual SLAM technique equipped for flat and
closed environments with floor lines. This is not a very limiting pre-requisite, as many
environments such as universities, shopping malls, museums, hospitals, homes and airports,
for example, have lines as floor components.
The algorithm used in visual SLAM is based on the Extended Kalman Filter (EKF), to allow
the robot to navigate in an indoor environment using odometry and pre-existing floor lines
as landmarks. The lines are identified using the Hough transform. The prediction phase of
EKF is done using the geometric model of the robot. The update phase uses the parameters
of the lines detected by the Hough transform directly in Kalman’s equations without any
intermediate calculation stage. Using existing lines as landmarks reduces the total
complexity of the problem as follows: a) lines can be easily detected in images; b) floor lines
are generally equally well spaced, reducing the possibility of confusion; c) since the number
of lines in the images are not very large, each new line detected can be defined as a new
landmark; d) a flat floor is a 2D surface and thus there is a constant and easy-to-calculate
conversion matrix between the image plane and the floor plane, with uncertainties about 3D
depth information; and e) after processing the number of pixels in the image that belong to
the line is a good reliability measure of the landmark detected.
2. Related Work
Recent extensions to the overall SLAM problem have focused on the possibility of using
cameras instead of sonar or laser. Examples are the works of Davison et al. (2002) , Jung
(2004) and Herath et al. (2007), using stereo vision, as well as the studies conducted by
Davidson et al. (2004) and Kwok et al. (2005), using a single camera.
Mansinghka (2004) presented a visual SLAM for dynamic environments using the SIFT
transform and optical flow. Estrada et al. (2005) proposed a hierarchical mapping method
that enables the obtaining of accurate metric maps of large environments in real time. The
lower level of the map is composed of a set of local maps that are statistically independent.
The upper part of the map is an adjacency graph whose arches are labeled with the
relationship between the location of the local maps and a relative estimate of these local
maps is kept at this level in a stochastic relation.
A solution using geometric information of the environment is proposed by Chen (2006). He
reports that redundancy in SLAM may reinforce the reliability and accuracy of the
characteristics observed and for this reason the geometric primitives common in indoor
environments, lines and squares, for example, are incorporated into an Extended Kalman
Filter (EKF) to raise the knowledge level of the characteristic observed.
Frintrop et al. (2006) introduced a new method to detect landmarks that consists of a
biologically inspired attention system to detect contrasting regions in the image. This
approach enables the regions to be easily redetected, thereby providing more ease of
communication. Dailey & Parnichkun (2006) used stereo vision for a visual SLAM based on
a particle filter. Choi et al. (2006) used an approach based on sonar information with stereo
vision in an extended Kalman filter. In this work, object recognition is accomplished with
Harris corners, using SIFT and RANSAC to eliminate false-positives.
Automatic recognition and a record of objects as visual landmarks are proposed by Lee &
Song (2007). SIFT transform and contour algorithms are used to distinguish objects in the
background of the image. When objects are detected and considered adequate for robot
navigation, they are stored for later use to correct position.
Clemente et al. (2007) demonstrated for the first time that SLAM with a single camera
providing input data can reach a large scale outdoors while functioning in real time. Jing
Wu & Zhang (2007) conducted a study on a camera model for visual SLAM. The focus of
this work is on how to model optical sensor uncertainty and how to build probabilistic
components of the camera model. The deterministic component of the camera calibration
process, an intrinsic parameter, is used to re-project the error. The errors are then found
according to bivariate Gaussian distribution and the measure of covariance can be
calculated when the characteristics are at different distances from the camera.
More recent studies in visual SLAM address several specific points. Esteban (2008) attacked
the problem of illumination for omnidirectional vision. Steder et al. (2008) studied visual
SLAM for aerial vehicles and Angeli et al. (2008) investigated the closed-loop problem. The
latter used color information to resolve the closed-cycle problem with a voting system.
Lemaire & Lacroix (2007) proposed the use of 3D lines as landmarks. They report the
following advantages of using 3D lines: first, these primitives are very numerous in indoor
environments; second, in contrast to sparse point maps, which are only useful for location
purposes, a relevant segmentation map provides information on the structure of the
environment. Also using lines, in this case, vertical, Fu et al. (2007) carried out a study on
the fusion of laser and camera information in an extended Kalman filter for SLAM. In this
work, the lines are extracted from the image using Canny. Ahn et al. (2007) built a map with
characteristics of 3D points and lines for indoor environments. Considering the last three
studies, our approach differed by using 2D straight landmarks existing on the floor of the
environment. In addition, the extraction of the characteristics is based on the Hough
transform.
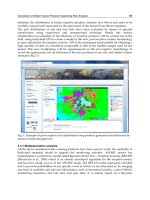
3. Proposed System
The system proposed in this study shows an adequate visual SLAM technique for flat and
closed environments with pre-existing floor lines and is an evolution of the robot location
study conducted by Santana et al. (2008).
The algorithm used in visual SLAM is based on the extended Kalman filter (EKF) to allow
the robot to navigate in indoor environments using odometry and pre-existing floor lines as
landmarks. The lines are identified using the Hough transform. The prediction phase of the
EKF is done using the geometric model of the robot. The update phase uses the parameters
of the lines detected by the Hough transform directly in the Kalman equations without any
intermediate calculation stage. Figure 1 shows the scheme of the proposed system.
SimultaneousLocalizationandMapping(SLAM)ofaMobileRobot
BasedonFusionofOdometryandVisualDataUsingExtendedKalmanFilter 131
how to decide if a newly detected characteristic will or will not be adopted as a new
landmark; d) how to calculate the 3D position of the landmarks from 2D images; and e) how
to estimate the uncertainty associated with the calculated values. In general, all of these
aspects must be resolved. However, in special situations, it is possible to develop specific
strategies to overcome all of these problems. This is the aim of this work.
The system that will be presented shows a visual SLAM technique equipped for flat and
closed environments with floor lines. This is not a very limiting pre-requisite, as many
environments such as universities, shopping malls, museums, hospitals, homes and airports,
for example, have lines as floor components.
The algorithm used in visual SLAM is based on the Extended Kalman Filter (EKF), to allow
the robot to navigate in an indoor environment using odometry and pre-existing floor lines
as landmarks. The lines are identified using the Hough transform. The prediction phase of
EKF is done using the geometric model of the robot. The update phase uses the parameters
of the lines detected by the Hough transform directly in Kalman’s equations without any
intermediate calculation stage. Using existing lines as landmarks reduces the total
complexity of the problem as follows: a) lines can be easily detected in images; b) floor lines
are generally equally well spaced, reducing the possibility of confusion; c) since the number
of lines in the images are not very large, each new line detected can be defined as a new
landmark; d) a flat floor is a 2D surface and thus there is a constant and easy-to-calculate
conversion matrix between the image plane and the floor plane, with uncertainties about 3D
depth information; and e) after processing the number of pixels in the image that belong to
the line is a good reliability measure of the landmark detected.
2. Related Work
Recent extensions to the overall SLAM problem have focused on the possibility of using
cameras instead of sonar or laser. Examples are the works of Davison et al. (2002) , Jung
(2004) and Herath et al. (2007), using stereo vision, as well as the studies conducted by
Davidson et al. (2004) and Kwok et al. (2005), using a single camera.
Mansinghka (2004) presented a visual SLAM for dynamic environments using the SIFT
transform and optical flow. Estrada et al. (2005) proposed a hierarchical mapping method
that enables the obtaining of accurate metric maps of large environments in real time. The
lower level of the map is composed of a set of local maps that are statistically independent.
The upper part of the map is an adjacency graph whose arches are labeled with the
relationship between the location of the local maps and a relative estimate of these local
maps is kept at this level in a stochastic relation.
A solution using geometric information of the environment is proposed by Chen (2006). He
reports that redundancy in SLAM may reinforce the reliability and accuracy of the
characteristics observed and for this reason the geometric primitives common in indoor
environments, lines and squares, for example, are incorporated into an Extended Kalman
Filter (EKF) to raise the knowledge level of the characteristic observed.
Frintrop et al. (2006) introduced a new method to detect landmarks that consists of a
biologically inspired attention system to detect contrasting regions in the image. This
approach enables the regions to be easily redetected, thereby providing more ease of
communication. Dailey & Parnichkun (2006) used stereo vision for a visual SLAM based on
a particle filter. Choi et al. (2006) used an approach based on sonar information with stereo
vision in an extended Kalman filter. In this work, object recognition is accomplished with
Harris corners, using SIFT and RANSAC to eliminate false-positives.
Automatic recognition and a record of objects as visual landmarks are proposed by Lee &
Song (2007). SIFT transform and contour algorithms are used to distinguish objects in the
background of the image. When objects are detected and considered adequate for robot
navigation, they are stored for later use to correct position.
Clemente et al. (2007) demonstrated for the first time that SLAM with a single camera
providing input data can reach a large scale outdoors while functioning in real time. Jing
Wu & Zhang (2007) conducted a study on a camera model for visual SLAM. The focus of
this work is on how to model optical sensor uncertainty and how to build probabilistic
components of the camera model. The deterministic component of the camera calibration
process, an intrinsic parameter, is used to re-project the error. The errors are then found
according to bivariate Gaussian distribution and the measure of covariance can be
calculated when the characteristics are at different distances from the camera.
More recent studies in visual SLAM address several specific points. Esteban (2008) attacked
the problem of illumination for omnidirectional vision. Steder et al. (2008) studied visual
SLAM for aerial vehicles and Angeli et al. (2008) investigated the closed-loop problem. The
latter used color information to resolve the closed-cycle problem with a voting system.
Lemaire & Lacroix (2007) proposed the use of 3D lines as landmarks. They report the
following advantages of using 3D lines: first, these primitives are very numerous in indoor
environments; second, in contrast to sparse point maps, which are only useful for location
purposes, a relevant segmentation map provides information on the structure of the
environment. Also using lines, in this case, vertical, Fu et al. (2007) carried out a study on
the fusion of laser and camera information in an extended Kalman filter for SLAM. In this
work, the lines are extracted from the image using Canny. Ahn et al. (2007) built a map with
characteristics of 3D points and lines for indoor environments. Considering the last three
studies, our approach differed by using 2D straight landmarks existing on the floor of the
environment. In addition, the extraction of the characteristics is based on the Hough
transform.
3. Proposed System
The system proposed in this study shows an adequate visual SLAM technique for flat and
closed environments with pre-existing floor lines and is an evolution of the robot location
study conducted by Santana et al. (2008).
The algorithm used in visual SLAM is based on the extended Kalman filter (EKF) to allow
the robot to navigate in indoor environments using odometry and pre-existing floor lines as
landmarks. The lines are identified using the Hough transform. The prediction phase of the
EKF is done using the geometric model of the robot. The update phase uses the parameters
of the lines detected by the Hough transform directly in the Kalman equations without any
intermediate calculation stage. Figure 1 shows the scheme of the proposed system.
CONTEMPORARYROBOTICS-ChallengesandSolutions132
Fig. 1. Proposed System.
3.1 Theoretical Background
Extended Kalman Filter
In this work, the Extended Kalman Filter (EKF) deals with a system modeled by System (1),
whose variables are described in Table (1).
ε
t
and
t
are supposed to be zero-mean Gaussian
white noises.
1 1 1
( , , )
( )
t t t t
t t t
s p s u
z h s
(1)
At each sampling time, the EKF calculates the best estimate of the state vector in two phases:
a) the prediction phase uses System (2) to predict the current state based on the previous
state and on the applied input signals; b) the update phase uses System (3) to correct the
predicted state by verifying its compatibility with the actual sensor measurements.
1 1
1
( , ,0)
t t t
T T
t t t t t t t
p u
G G V M V
(2)
1
( )
( ( ))
( )
T T
t t t t t t t
t t t t t
t t t t
K H H H Q
K z h
I K H
(3)
where:
1 1
, , 0
( , , )
t t
t s u u
p s u
G
s
(4)
_ 1 1
, , 0
( , , )
t t
t s u u
p s u
V
(5)
1
( )
t
t s
h s
H
s
(6)
s
t
state vector (order n) at instant t
p(.)
non-linear model of the system
u
t-1
input signals (order l), instant t − 1
ε
t-1
process noise (order q), instant t − 1
z
t
vector of measurements (order m) retourned by the sensors
h(.)
non-linear model of the sensors
t
measurement noise
t
t
mean (order n) of the state vector
s
t
, before and after the update phase
t
t
covariance (n x n) of the state vector
s
t
G
t
Jacobian matrix (n x n) that linearizes the system model p(.)
V
t
Jacobian matrix (n x q) that linearizes the process noise
ε
t
M
t
covariance (q x q) of the process noise
ε
t
K
t
gain of the Kalman filter (n x m)
H
t
Jacobian matrix (m x n) that linearizes the model of the sensors h(.)
Q
t
covariance matrix (m x m) of the measurement noise
t
Table 1. Symbols in Equations (1), (2) and (3).
EKF-SLAM
In SLAM, besides estimating the robot pose, we also estimate the coordinates of all
landmarks encountered along the way. This makes necessary to include the landmark
coordinates into the state vector. If
i
c is the vector of coordinates of the i-th landmark and
there are k landmarks, then the state vector is:
1
T
T k T
t t t t t t
s x y c c
(7)
When the number of marks (k) is a priori known, the dimension of the state vector is static;
otherwise, it grows up when a new mark is found.
SimultaneousLocalizationandMapping(SLAM)ofaMobileRobot
BasedonFusionofOdometryandVisualDataUsingExtendedKalmanFilter 133
Fig. 1. Proposed System.
3.1 Theoretical Background
Extended Kalman Filter
In this work, the Extended Kalman Filter (EKF) deals with a system modeled by System (1),
whose variables are described in Table (1).
ε
t
and
t
are supposed to be zero-mean Gaussian
white noises.
1 1 1
( , , )
( )
t t t t
t t t
s p s u
z h s
(1)
At each sampling time, the EKF calculates the best estimate of the state vector in two phases:
a) the prediction phase uses System (2) to predict the current state based on the previous
state and on the applied input signals; b) the update phase uses System (3) to correct the
predicted state by verifying its compatibility with the actual sensor measurements.
1 1
1
( , ,0)
t t t
T T
t t t t t t t
p u
G G V M V
(2)
1
( )
( ( ))
( )
T T
t t t t t t t
t t t t t
t t t t
K H H H Q
K z h
I K H
(3)
where:
1 1
, , 0
( , , )
t t
t s u u
p s u
G
s
(4)
_ 1 1
, , 0
( , , )
t t
t s u u
p s u
V
(5)
1
( )
t
t s
h s
H
s
(6)
s
t
state vector (order n) at instant t
p(.)
non-linear model of the system
u
t-1
input signals (order l), instant t − 1
ε
t-1
process noise (order q), instant t − 1
z
t
vector of measurements (order m) retourned by the sensors
h(.)
non-linear model of the sensors
t
measurement noise
t
t
mean (order n) of the state vector
s
t
, before and after the update phase
t
t
covariance (n x n) of the state vector
s
t
G
t
Jacobian matrix (n x n) that linearizes the system model p(.)
V
t
Jacobian matrix (n x q) that linearizes the process noise
ε
t
M
t
covariance (q x q) of the process noise
ε
t
K
t
gain of the Kalman filter (n x m)
H
t
Jacobian matrix (m x n) that linearizes the model of the sensors h(.)
Q
t
covariance matrix (m x m) of the measurement noise
t
Table 1. Symbols in Equations (1), (2) and (3).
EKF-SLAM
In SLAM, besides estimating the robot pose, we also estimate the coordinates of all
landmarks encountered along the way. This makes necessary to include the landmark
coordinates into the state vector. If
i
c is the vector of coordinates of the i-th landmark and
there are k landmarks, then the state vector is:
1
T
T k T
t t t t t t
s x y c c
(7)
When the number of marks (k) is a priori known, the dimension of the state vector is static;
otherwise, it grows up when a new mark is found.
CONTEMPORARYROBOTICS-ChallengesandSolutions134
3.2 Modeling
Prediction phase: Process Model
Consider a robot with diferential drive in which ∆θ
R
and∆θ
L
are the right and left angular
displacement of the respective wheels, according to Figure 2.
Fig. 2. Variables of the kinematic model.
Assuming that the speeds can be considered constant during one sampling period, we can
determine the kinematic geometric model of the robot’s movement (System 3.8):
1 1 1
1 1 1
1
t t t t
t t t t
t t
L
x x sin( ) sin( )
L
y y
cos( ) cos( )
(8)
in which:
R R L L
R R L L
L ( r r ) /
( r r ) / b
2
(9)
where
∆L and ∆θ are the linear and angular displacement of the robot; b represents the
distance between wheels and r
R
and r
L
are the radii of the right and the left wheels,
respectively. When Δ
θ → 0, the model becomes the one in Equation (10), obtained from the
limit of System (8).
t t 1 t 1
t t 1 t 1
t t 1
x x Lcos( )
y y
Lsin( )
(10)
Adopting the approach advocated by Thrun et al. (2005), we consider odometric
information as input signals to be incorporated to the robot’s model, rather than as sensorial
measurements. The differences between the actual angular displacements of the wheels
(
R
and
L
) and those ones measured by the encoders
R
and
L
are modeled by a
zero mean Gaussian white noise, accordingly to System (11).
R R R
L L L
(11)
The measured
L
and
are defined by replacing (
R
and
L
) by (
R
and
L
) in
Equations (9). If the state vector s is given by Equation (7), the system model
p(·) can be
obtained from Systems (8) or (10) and from the fact that the landmarks coordinates
i
c are
static:
t
t
t
1 1
t t 1
k k
t t 1
x
y
p( )
c c
c c
i
n 3 k order( c)
(12)
T
t R L
u l 2
(13)
T
t R L
q 2
(14)
The
G and V matrices are obtained by deriving the p(·) model using Equation (4) and
Equation (5) respectively:
13
23
1 0
g
0 0
0 1
g
0 0
0 0 1 0 0
G
0 0 0 1 0
0 0 0 0 1
(15)
11 12
21 22
R L
v v
v v
r /b r /b
V
0 0
0 0
(16)
where,
13 t 1 t 1 23 t 1 t 1
L L
g
cos( ) cos( )
g
sin( ) sin( )
and considering e
r
R
= r
L
= r:
SimultaneousLocalizationandMapping(SLAM)ofaMobileRobot
BasedonFusionofOdometryandVisualDataUsingExtendedKalmanFilter 135
3.2 Modeling
Prediction phase: Process Model
Consider a robot with diferential drive in which ∆θ
R
and∆θ
L
are the right and left angular
displacement of the respective wheels, according to Figure 2.
Fig. 2. Variables of the kinematic model.
Assuming that the speeds can be considered constant during one sampling period, we can
determine the kinematic geometric model of the robot’s movement (System 3.8):
1 1 1
1 1 1
1
t t t t
t t t t
t t
L
x x sin( ) sin( )
L
y y
cos( ) cos( )
(8)
in which:
R R L L
R R L L
L ( r r ) /
( r r ) / b
2
(9)
where
∆L and ∆θ are the linear and angular displacement of the robot; b represents the
distance between wheels and r
R
and r
L
are the radii of the right and the left wheels,
respectively. When Δ
θ → 0, the model becomes the one in Equation (10), obtained from the
limit of System (8).
t t 1 t 1
t t 1 t 1
t t 1
x x Lcos( )
y y
Lsin( )
(10)
Adopting the approach advocated by Thrun et al. (2005), we consider odometric
information as input signals to be incorporated to the robot’s model, rather than as sensorial
measurements. The differences between the actual angular displacements of the wheels
(
R
and
L
) and those ones measured by the encoders
R
and
L
are modeled by a
zero mean Gaussian white noise, accordingly to System (11).
R R R
L L L
(11)
The measured
L
and
are defined by replacing (
R
and
L
) by (
R
and
L
) in
Equations (9). If the state vector s is given by Equation (7), the system model
p(·) can be
obtained from Systems (8) or (10) and from the fact that the landmarks coordinates
i
c are
static:
t
t
t
1 1
t t 1
k k
t t 1
x
y
p( )
c c
c c
i
n 3 k order( c)
(12)
T
t R L
u l 2
(13)
T
t R L
q 2
(14)
The
G and V matrices are obtained by deriving the p(·) model using Equation (4) and
Equation (5) respectively:
13
23
1 0 g 0 0
0 1
g
0 0
0 0 1 0 0
G
0 0 0 1 0
0 0 0 0 1
(15)
11 12
21 22
R L
v v
v v
r /b r /b
V
0 0
0 0
(16)
where,
13 t 1 t 1 23 t 1 t 1
L L
g
cos( ) cos( )
g
sin( ) sin( )
and considering e
r
R
= r
L
= r: