Engineering Materials Vol II (microstructures_ processing_ design) 2nd ed. - M. Ashby_ D. Jones (1999) WW Part 2 pot
Bạn đang xem bản rút gọn của tài liệu. Xem và tải ngay bản đầy đủ của tài liệu tại đây (930.11 KB, 27 trang )
18 Engineering Materials 2
Fig. 2.3. The crystal structure of the “intermetallic” compound CuAl
2
. The structures of compounds are usually
more complicated than those of pure metals.
Phases
The things that we have been talking about so far – metal crystals, amorphous metals,
solid solutions, and solid compounds – are all phases. A phase is a region of material
that has uniform physical and chemical properties. Water is a phase – any one drop of
water is the same as the next. Ice is another phase – one splinter of ice is the same as
any other. But the mixture of ice and water in your glass at dinner is not a single phase
because its properties vary as you move from water to ice. Ice + water is a two-phase
mixture.
Grain and phase boundaries
A pure metal, or a solid solution, is single-phase. It is certainly possible to make single
crystals of metals or alloys but it is difficult and the expense is only worth it for high-
technology applications such as single-crystal turbine blades or single-crystal silicon
for microchips. Normally, any single-phase metal is polycrystalline – it is made up of
millions of small crystals, or grains, “stuck” together by grain boundaries (Fig. 2.4).
Fig. 2.4. The structure of a typical grain boundary. In order to “bridge the gap” between two crystals of
different orientation the atoms in the grain boundary have to be packed in a less ordered way. The packing
density in the boundary is then as low as 50%.
Metal structures 19
* Henry Bessemer, the great Victorian ironmaster and the first person to mass-produce mild steel, was
nearly bankrupted by this. When he changed his suppliers of iron ore, his steel began to crack in service.
The new ore contained phosphorus, which we now know segregates badly to grain boundaries. Modern
steels must contain less than ≈0.05% phosphorus as a result.
Fig. 2.5. Structures of interphase boundaries.
Because of their unusual structure, grain boundaries have special properties of their
own. First, the lower bond density in the boundary is associated with a boundary
surface-energy: typically 0.5 Joules per square metre of boundary area (0.5 J m
−2
).
Secondly, the more open structure of the boundary can give much faster diffusion in
the boundary plane than in the crystal on either side. And finally, the extra space
makes it easier for outsized impurity atoms to dissolve in the boundary. These atoms
tend to segregate to the boundaries, sometimes very strongly. Then an average impurity
concentration of a few parts per million can give a local concentration of 10% in the
boundary with very damaging effects on the fracture toughness.*
As we have already seen, when an alloy contains more of the alloying element than
the host metal can dissolve, it will split up into two phases. The two phases are “stuck”
together by interphase boundaries which, again, have special properties of their own. We
look first at two phases which have different chemical compositions but the same
crystal structure (Fig. 2.5a). Provided they are oriented in the right way, the crystals
can be made to match up at the boundary. Then, although there is a sharp change in
20 Engineering Materials 2
chemical composition, there is no structural change, and the energy of this coherent
boundary is low (typically 0.05 J m
−2
). If the two crystals have slightly different lattice
spacings, the boundary is still coherent but has some strain (and more energy) associ-
ated with it (Fig. 2.5b). The strain obviously gets bigger as the boundary grows side-
ways: full coherency is usually possible only with small second-phase particles. As the
particle grows, the strain builds up until it is relieved by the injection of dislocations to
give a semi-coherent boundary (Fig. 2.5c). Often the two phases which meet at the
boundary are large, and differ in both chemical composition and crystal structure.
Then the boundary between them is incoherent; it is like a grain boundary across which
there is also a change in chemical composition (Fig. 2.5d). Such a phase boundary has
a high energy – comparable with that of a grain boundary – and around 0.5 J m
−2
.
Shapes of grains and phases
Grains come in all shapes and sizes, and both shape and size can have a big effect on
the properties of the polycrystalline metal (a good example is mild steel – its strength
can be doubled by a ten-times decrease in grain size). Grain shape is strongly affected
by the way in which the metal is processed. Rolling or forging, for instance, can give
stretched-out (or “textured”) grains; and in casting the solidifying grains are often
elongated in the direction of the easiest heat loss. But if there are no external effects
like these, then the energy of the grain boundaries is the important thing. This can be
illustrated very nicely by looking at a “two-dimensional” array of soap bubbles in a
thin glass cell. The soap film minimises its overall energy by straightening out; and at
the corners of the bubbles the films meet at angles of 120° to balance the surface
tensions (Fig. 2.6a). Of course a polycrystalline metal is three-dimensional, but the
same principles apply: the grain boundaries try to form themselves into flat planes,
and these planes always try to meet at 120°. A grain shape does indeed exist which not
only satisfies these conditions but also packs together to fill space. It has 14 faces, and
is therefore called a tetrakaidecahedron (Fig. 2.6b). This shape is remarkable, not only
for the properties just given, but because it appears in almost every physical science
(the shape of cells in plants, of bubbles in foams, of grains in metals and of Dirichlet
cells in solid-state physics).*
If the metal consists of two phases then we can get more shapes. The simplest is
when a single-crystal particle of one phase forms inside a grain of another phase.
Then, if the energy of the interphase boundary is isotropic (the same for all orientations),
the second-phase particle will try to be spherical in order to minimise the interphase
boundary energy (Fig. 2.7a). Naturally, if coherency is possible along some planes, but
not along others, the particle will tend to grow as a plate, extensive along the low-
energy planes but narrow along the high-energy ones (Fig. 2.7b). Phase shapes get more
complicated when interphase boundaries and grain boundaries meet. Figure 2.7(c)
shows the shape of a second-phase particle that has formed at a grain boundary. The
particle is shaped by two spherical caps which meet the grain boundary at an angle
θ
.
This angle is set by the balance of boundary tensions
* For a long time it was thought that soap foams, grains in metals and so on were icosahedra. It took Lord
Kelvin (of the degree K) to get it right.
Metal structures 21
Fig. 2.6. (a) The surface energy of a “two-dimensional” array of soap bubbles is minimised if the soap films
straighten out. Where films meet the forces of surface tension must balance. This can only happen if films meet
in “120° three-somes”.
Fig. 2.6. (b) In a three-dimensional polycrystal the grain boundary energy is minimised if the boundaries
flatten out. These flats must meet in 120° three-somes to balance the grain boundary tensions. If we fill space
with equally sized tetrakaidecahedra we will satisfy these conditions. Grains in polycrystals therefore tend to
be shaped like tetrakaidecahedra when the grain-boundary energy is the dominating influence.
22 Engineering Materials 2
Fig. 2.7. Many metals are made up of
two
phases. This figure shows some of the shapes that they can
have when boundary energies dominate. To keep things simple we have sectioned the tetrakaidecahedral
grains in the way that we did in Fig. 2.6(b). Note that Greek letters are often used to indicate phases. We
have called the major phase a and the second phase b. But g is the symbol for the energy (or tension) of
grain boundaries (g
gb
) and interphase interfaces (g
ab
).
2
γ
αβ
cos
θ
=
γ
gb
(2.1)
where
γ
αβ
is the tension (or energy) of the interphase boundary and
γ
gb
is the grain
boundary tension (or energy).
In some alloys,
γ
αβ
can be թ
γ
gb
/2 in which case
θ
= 0. The second phase will then
spread along the boundary as a thin layer of
β
. This “wetting” of the grain boundary
can be a great nuisance – if the phase is brittle then cracks can spread along the grain
boundaries until the metal falls apart completely. A favourite scientific party trick is to
put some aluminium sheet in a dish of molten gallium and watch the individual grains
of aluminium come apart as the gallium whizzes down the boundary.
The second phase can, of course, form complete grains (Fig. 2.7d). But only if
γ
αβ
and
γ
gb
are similar will the phases have tetrakaidecahedral shapes where they come
together. In general,
γ
αβ
and
γ
gb
may be quite different and the grains then have more
complicated shapes.
Summary: constitution and structure
The structure of a metal is defined by two things. The first is the constitution:
(a) The overall composition – the elements (or components) that the metal contains and
the relative weights of each of them.
Metal structures 23
(b) The number of phases, and their relative weights.
(c) The composition of each phase.
The second is the geometric information about shape and size:
(d) The shape of each phase.
(e) The sizes and spacings of the phases.
Armed with this information, we are in a strong position to re-examine the mechan-
ical properties, and explain the great differences in strength, or toughness, or cor-
rosion resistance between alloys. But where does this information come from? The
constitution of an alloy is summarised by its phase diagram – the subject of the next
chapter. The shape and size are more difficult, since they depend on the details of how
the alloy was made. But, as we shall see from later chapters, a fascinating range of
microscopic processes operates when metals are cast, or worked or heat-treated into
finished products; and by understanding these, shape and size can, to a large extent,
be predicted.
Background reading
M. F. Ashby and D. R. H. Jones, Engineering Materials I, 2nd edition, Butterworth-Heinemann,
1996.
Further reading
D. A. Porter and K. E. Easterling, Phase Transformations in Metals and Alloys, 2nd edition, Chapman
and Hall, 1992.
G. A. Chadwick, Metallography of Phase Transformations, Butterworth, 1972.
Problems
2.1 Describe, in a few words, with an example or sketch where appropriate, what is
meant by each of the following:
(a) polymorphism;
(b) dense random packing;
(c) an interstitial solid solution;
(d) a substitutional solid solution;
(e) clustering in solid solutions;
(f ) ordering in solid solutions;
(g) an intermetallic compound;
(h) a phase in a metal;
(i) a grain boundary;
(j) an interphase boundary;
24 Engineering Materials 2
(k) a coherent interphase boundary;
(l) a semi-coherent interphase boundary;
(m) an incoherent interphase boundary;
(n) the constitution of a metal;
(o) a component in a metal.
Equilibrium constitution and phase diagrams 25
Chapter 3
Equilibrium constitution and phase diagrams
Introduction
Whenever you have to report on the structure of an alloy – because it is a possible
design choice, or because it has mysteriously failed in service – the first thing you
should do is reach for its phase diagram. It tells you what, at equilibrium, the constitu-
tion of the alloy should be. The real constitution may not be the equilibrium one, but
the equilibrium constitution gives a base line from which other non-equilibrium con-
stitutions can be inferred.
Using phase diagrams is like reading a map. We can explain how they work, but
you will not feel confident until you have used them. Hands-on experience is essential.
So, although this chapter introduces you to phase diagrams, it is important for you to
work through the “Teaching Yourself Phase Diagrams” section at the end of the book.
This includes many short examples which give you direct experience of using the
diagrams. The whole thing will only take you about four hours and we have tried to
make it interesting, even entertaining. But first, a reminder of some essential definitions.
Definitions
An alloy is a metal made by taking a pure metal and adding other elements (the
“alloying elements”) to it. Examples are brass (Cu + Zn) and monel (Ni + Cu).
The components of an alloy are the elements which make it up. In brass, the compon-
ents are copper and zinc. In monel they are nickel and copper. The components are
given the atomic symbols, e.g. Cu, Zn or Ni, Cu.
An alloy system is all the alloys you can make with a given set of components: “the
Cu–Zn system” describes all the alloys you can make from copper and zinc. A binary
alloy has two components; a ternary alloy has three.
A phase is a region of material that has uniform physical and chemical properties.
Phases are often given Greek symbols, like
α
or
β
. But when a phase consists of a solid
solution of an alloying element in a host metal, a clearer symbol can be used. As an
example, the phases in the lead–tin system may be symbolised as (Pb) – for the solu-
tion of tin in lead, and (Sn) – for the solution of lead in tin.
The composition of an alloy, or of a phase in an alloy, is usually measured in weight
%, and is given the symbol W. Thus, in an imaginary A–B alloy system:
W
A
%,=×
wt of A
wt of A + wt of B
100
(3.1)
W
B
%,=×
wt of B
wt of A + wt of B
100
(3.2)
26 Engineering Materials 2
Fig. 3.1. The phase diagram for the lead–tin alloy system. There are three phases: L – a liquid solution of
lead and tin; (Pb) – a solid solution of tin in lead; and (Sn) – a solid solution of lead in tin. The diagram is
divided up into six
fields
– three of them are single-phase, and three are two-phase.
and
W
A
+ W
B
= 100%. (3.3)
Sometimes it is helpful to define the atom (or mol)%, given by
X
A
atoms of A
atoms of A + atoms of B
%=×100
(3.4)
and so on.
The constitution of an alloy is described by
(a) the overall composition;
(b) the number of phases;
(c) the composition of each phase;
(d) the proportion by weight of each phase.
An alloy has its equilibrium constitution when there is no further tendency for the
constitution to change with time.
The equilibrium diagram or phase diagram summarises the equilibrium constitution
of the alloy system.
The lead–tin phase diagram
And now for a real phase diagram. We have chosen the lead–tin diagram (Fig. 3.1) as
our example because it is pretty straightforward and we already know a bit about it.
Indeed, if you have soldered electronic components together or used soldered pipe
fittings in your hot-water layout, you will already have had some direct experience of
this system.
Equilibrium constitution and phase diagrams 27
As in all binary phase diagrams, we have plotted the composition of the alloy on the
horizontal scale (in weight %), and the temperature on the vertical scale. The diagram
is simply a two-dimensional map (drawn up from experimental data on the lead–tin
system) which shows us where the various phases are in composition–temperature
space. But how do we use the diagram in practice? As a first example, take an alloy of
overall composition 50 wt% lead at 170°C. The constitution point (Fig. 3.2a) lies inside a
two-phase field. So, at equilibrium, the alloy must be a two-phase mixture: it must
consist of “lumps” of (Sn) and (Pb) stuck together. More than this, the diagram tells us
(Fig. 3.2b) that the (Sn) phase in our mixture contains 2% lead dissolved in it (it is 98%
tin) and the (Pb) phase is 85% lead (it has 15% tin dissolved in it). And finally the
diagram tells us (Fig. 3.2c) that the mixture contains 58% by weight of the (Pb) phase.
To summarise, then, with the help of the phase diagram, we now know what the
equilibrium constitution of our alloy is – we know:
(a) the overall composition (50 wt% lead + 50 wt% tin),
(b) the number of phases (two),
(c) the composition of each phase (2 wt% lead, 85 wt% lead),
(d) the proportion of each phase (58 wt% (Pb), 42 wt% (Sn)).
What we don’t know is how the lumps of (Sn) and (Pb) are sized or shaped. And we
can only find that out by cutting the alloy open and looking at it with a microscope.*
Now let’s try a few other alloy compositions at 170°C. Using Figs 3.2(b) and 3.2(c)
you should be able to convince yourself that the following equilibrium constitutions
are consistent.
(a) 25 wt% lead + 75 wt% tin,
(b) two phases,
(c) 2 wt% lead, 85 wt% lead,
(d) 30 wt% (Pb), 70 wt% (Sn).
(a) 75 wt% lead + 25 wt% tin,
(b) two phases,
(c) 2 wt% lead, 85 wt% lead,
(d) 87 wt% (Pb), 13 wt% (Sn).
(a) 85 wt% lead + 15 wt% tin,
(b) one phase (just),
(c) 85 wt% lead,
(d) 100 wt% (Pb).
(a) 95 wt% lead + 5 wt% tin,
(b) one phase,
(c) 95 wt% lead,
(d) 100 wt% (Pb).
* A whole science, called metallography, is devoted to this. The oldest method is to cut the alloy in half,
polish the cut faces, etch them in acid to colour the phases differently, and look at them in the light
microscope. But you don’t even need a microscope to see some grains. Look at any galvanised steel fire-
escape or cast brass door knob and you will see the grains, etched by acid rain or the salts from people’s
hands.
28 Engineering Materials 2
Fig. 3.2. (a)A 50–50 lead–tin alloy at 170°C has a constitution point that puts it in the (Sn) + (Pb) two-
phase field. The compositions of the (Sn) and (Pb) phases in the two-phase mixture are 2 wt% lead and
85 wt% lead. Remember that, in any overall composition, or in any phase, wt% tin + wt% lead = 100%. So
the compositions of the (Sn) and (Pb) phases could just as well have been written as 98 wt% tin and 15 wt%
tin. (b) This diagram only duplicates information that is already contained in the phase diagram, but it helps
to emphasise how the compositions of the phases depend on the overall composition of the alloy. (c) The 50–
50 alloy at 170°C consists of 58 wt% of the (Pb) phase and 42 wt% of the (Sn) phase. The straight-line
relations in the diagram are a simple consequence of the following requirements: (i) mass (Pb) phase + mass
(Sn) phase = mass alloy; (ii) mass lead in (Pb) + mass lead in (Sn) = mass lead in alloy; (iii) mass tin in (Pb) +
mass tin in (Sn) = mass tin in alloy.
(a) 2 wt% lead + 98 wt% tin,
(b) one phase (just),
(c) 2 wt% lead,
(d) 100 wt% (Sn).
Equilibrium constitution and phase diagrams 29
Fig. 3.3. Diagrams showing how you can find the equilibrium constitution of any lead–tin alloy at 200°C.
Once you have had a little practice you will be able to write down constitutions directly from the phase
diagram without bothering about diagrams like (b) or (c).
(a) 1 wt% lead + 99 wt% tin,
(b) one phase,
(c) 1 wt% lead,
(d) 100 wt% (Sn).
For our second example, we look at alloys at 200°C. We can use exactly the same
method, as Fig. 3.3 shows. A typical constitution at 200°C would be:
(a) 50 wt% lead + 50 wt% tin,
(b) two phases,
30 Engineering Materials 2
Fig. 3.4. At 232°C, the melting point of pure tin, we have a L + Sn two-phase mixture. But, without more
information, we can’t say what the relative weights of L and Sn
are
.
(c) 45 wt% lead, 82 wt% lead,
(d) 87 wt% (L), 13 wt% (Pb),
and you should have no problem in writing down many others.
Incompletely defined constitutions
There are places in the phase diagram where we can’t write out the full constitution. To
start with, let’s look at pure tin. At 233°C we have single-phase liquid tin (Fig. 3.4). At
231°C we have single-phase solid tin. At 232°C, the melting point of pure tin, we can
either have solid tin about to melt, or liquid tin about to solidify, or a mixture of both.
If we started with solid tin about to melt we could, of course, supply latent heat of
melting at 232°C and get some liquid tin as a result. But the phase diagram knows
nothing about external factors like this. Quite simply, the constitution of pure tin at
232°C is incompletely defined because we cannot write down the relative weights of
the phases. And the same is, of course, true for pure lead at 327°C.
The other place where the constitution is not fully defined is where there is a horizontal
line on the phase diagram. The lead–tin diagram has one line like this – it runs across
the diagram at 183°C and connects (Sn) of 2.5 wt% lead, L of 38.1% lead and (Pb) of
81% lead. Just above 183°C an alloy of tin + 38.1% lead is single-phase liquid (Fig. 3.5).
Just below 183°C it is two-phase, (Sn) + (Pb). At 183°C we have a three-phase mixture of
L + (Sn) + (Pb) but we can’t of course say from the phase diagram what the relative
weights of the three phases are.
Other phase diagrams
Phase diagrams have been measured for almost any alloy system you are likely to
meet: copper–nickel, copper–zinc, gold–platinum, or even water–antifreeze. Some
Equilibrium constitution and phase diagrams 31
Fig. 3.5. At 183°C we have a
three-phase mixture
of L + (Sn) + (Pb). Their relative weights can’t be found
from the phase diagram.
Fig. 3.6. (a) The copper–nickel diagram is a good deal simpler than the lead–tin one, largely because
copper and nickel are completely soluble in one another in the solid state. (b) The copper–zinc diagram is
much more involved than the lead–tin one, largely because there are extra (
intermediate
) phases in between
the end (
terminal
) phases. However, it is still an assembly of single-phase and two-phase fields.
diagrams, like copper–nickel (Fig. 3.6a), are simple; others, like copper–zinc (Fig. 3.6b)
are fairly involved; and a few are positively horrendous! But, as Table 3.1 shows, the
only real difference between one phase diagram and the next is one of degree.
So that you know where to find the phase diagrams you need we have listed pub-
lished sources of phase diagrams in the Further Reading section. The determination of
a typical phase diagram used to provide enough work to keep a doctoral student busy
for several years. And yet the most comprehensive of the references runs to over a
thousand different phase diagrams!
32 Engineering Materials 2
Table 3.1
Feature Cu–Ni Pb–Sn Cu–Zn
(Fig. 3.6a) (Fig. 3.1) (Fig. 3.6b)
Melting points Two: Cu, Ni Two: Pb, Sn Two: Cu, Zn
Three-phase horizontals None One: L + (Sn) + (Pb) Six: a + b + L
b + g + L
g + d + L
g + d +
ε
d + e + L
e + h + L
Single-phase fields Two: L, a Three: L, (Pb), (Sn) Seven: L, a,
b,
g,
d,
e,
h
Two-phase fields One: L + a Three:
!
L + (Pb) Twelve:
!
L + a, L + b, L +
γ
,
@
L + (Sn)
@
L + d, L + e, L + h,
(Sn) + (Pb) a + b, b + g, g +
δ
,
g + e,
δ
+ e, e + h
Further reading
Sources of phase diagrams
M. Hansen and K. Anderko, Constitution of Binary Alloys, McGraw-Hill, 1958; and supplements,
by R. P. Elliott, 1965, and F. A. Shunk, 1969.
Smithells’ Metals Reference Book, 7th edition, Butterworth-Heinemann, 1992.
ASM Metals Handbook, 10th edition, ASM International, 1990, Vol. 8.
Problems
Do not attempt problems 3.1 to 3.5 until you have worked through the Teaching
Yourself Phase Diagrams section at the end of the book.
3.1 Explain briefly what is meant by the following terms:
(a) a eutectic reaction;
(b) a eutectoid reaction.
3.2 The phase diagram for the copper-antimony system is shown on the next page.
The phase diagram contains the intermetallic compound marked “X” on the dia-
gram. Determine the chemical formula of this compound. The atomic weights of
copper and antimony are 63.54 and 121.75 respectively.
Equilibrium constitution and phase diagrams 33
1100
1000
900
800
700
600
500
400
300
01020
30
40 50
60
70
80
90 100
Cu
Sb
Wt% Sb
δ
ε
β
α
X
Liquid
Temperature (˚C)
Answer: Cu
2
Sb.
3.3 The copper-antimony phase diagram contains two eutectic reactions and one
eutectoid reaction. For each reaction:
(a) identify the phases involved;
(b) give the compositions of the phases;
(c) give the temperature of the reaction.
Answers: eutectic at 650°C: L(31% Sb) = α(12% Sb) + β(32% Sb).
eutectic at 520°C: L(77% Sb) = Cu
2
Sb + δ(98% Sb).
eutectoid at 420°C: β(42% Sb) = ε(38% Sb) + Cu
2
Sb.
3.4 A copper-antimony alloy containing 95 weight% antimony is allowed to cool from
650°C to room temperature. Describe the different phase changes which take place
as the alloy is cooled and make labelled sketches of the microstructure to illustrate
your answer.
3.5 Sketch a graph of temperature against time for a copper-antimony alloy containing
95 weight% antimony over the range 650°C to 500°C and account for the shape of
your plot.
34 Engineering Materials 2
Chapter 4
Case studies in phase diagrams
Introduction
Now for some practical examples of how phase diagrams are used. In the first, a
typical design problem, we find out how solders are chosen for different uses. In the
second we look at the high-technology area of microchip fabrication and study the
production, by zone refining, of ultra-pure silicon. And lastly, for some light-hearted
relief, we find out how bubble-free ice is made for up-market cocktails.
Choosing soft solders
Most soft solders are based on our old friend, the lead–tin system (Table 4.1). Soft
solders are called “soft” because they are just that – soft mechanically, and soft in the
sense that they melt easily. Even so, thin soldered joints can be very strong in shear.
And the “thermal” softness of the solder can be a positive advantage. A good example
of this is in the soldering of electronic components – like transistors, resistors or integ-
rated circuits – into printed circuit boards. Because the components will be damaged
if they get too hot, we want a solder with a low melting point. The phase diagram
(Fig. 4.1) shows at a glance that the alloy we want is tin + 38% lead. Now that you are
familiar with the Teach Yourself course you will know that the particular sort of three-
phase horizontal where
Table 4.1 Properties of common solders
Type Composition (wt%) Melting range (°C) Typical uses
Soft; eutectic 62 Sn + 38 Pb 183 Electronic assemblies.
(free-flowing)
Soft; general-purpose 50 Sn + 50 Pb 183–212 Joints in copper water systems;
(moderately pasty) sheet metal work.
Soft; plumbers’ (pasty) 35 Sn + 65 Pb 183–244 Wiped joints; car body filling.
Soft; high-melting 5 Sn + 1.5 Ag 296–301 Higher temperatures.
(free flowing) + 93.5 Pb
Silver; eutectic 42 Ag + 19 Cu 610–620 High-strength; high-temperature.
(free-flowing) + 16 Zn + 25 Cd
Silver; general-purpose 38 Ag + 20 Cu 605–650 High-strength; high-temperature.
(pasty) + 22 Zn + 20 Cd
Case studies in phase diagrams 35
Fig. 4.1. The lead–tin phase diagram showing the compositions of the three main soft solders. The diagram
tells us that, as soon as
eutectic solder
reaches 183°C, it melts completely and flows easily into joints.
Plumbers’ solder
, on the other hand, has a
melting range
– although it starts to melt at 183°C it doesn’t
become completely molten until it gets up to 244°C. At a middling temperature like 210°C it is a half-solid–
half-liquid paste.
High-melting point soft solders
are nearly pure lead. They have a small melting range and,
like eutectic solders, flow easily into joints.
L a
α
+
β
or, in our case,
L a (Sn) + (Pb)
is called a eutectic, from the Ancient Greek for “easy melting”. And electronic solders
are, appropriately enough, marketed under trade names like “Eutectic”. But eutectic
solders have another property. They become completely molten as soon as they are
heated up past 183°C; and they flow nicely into the joints, leaving small tidy fillets of
solder around each connection. You can imagine the number of faults that you could
get on a crowded circuit board if the solder did not flow easily and had to be “put on
with a trowel”.
There are times, however, when soft solder is – almost literally – put on with a
trowel. Lead was widely used by the Romans for piping water; and it is only within
the past fifty years that copper – and more recently polymers – have replaced lead as
the major plumbing material. A vital part of the plumber’s craft was joining lengths of
lead pipe together. This was done by bringing the ends of the pipes up to one another
and gradually building a deposit of solder around the joint. The joint was “wiped” by
hand with a moleskin pad as fresh solder was added, producing the very fine wiped
joints shown in Fig. 4.2. Now, eutectic solder would be useless for this purpose. It
would either be fully molten and run all over the place, or it would go solid and stick
on the job in unsightly lumps. What is wanted is a pasty solder which can be gradually
moulded to the shape of the joint. Now, if we look at an alloy of tin + 65% lead on the
36 Engineering Materials 2
Fig. 4.2. When we heat plumbers’ solder to about 210°C, and make it “pasty”, we can “wipe” it into
elegantly curved shapes. Lead pipes have been joined in this way for centuries.
phase diagram we can see that, at around 210°C, the alloy will be a half-molten, half-
solid slurry. This will work very nicely to shape without the temperature being too
critical. And there is also little chance of melting the lead pipes by accident. So this is
the sort of composition that plumbers’ solders have (Table 4.1). Actually, lead–tin
alloys with a freezing range like this (called “mushy freezers” in the foundry world)
are still used quite widely for things like filling-in dents in car body panels, and
soldering car radiators together. But in many cases they are used not so much because
they are mushy freezers but because they contain less tin than eutectic solders and are
therefore cheaper.
One of the interesting things about the lead–tin diagram (Fig. 4.1) is that all alloys
containing between 2.5% and 81% of added lead start to melt at 183°C even though
some – as we have just seen – don’t become completely molten until they are quite
a bit hotter. This is obviously a problem when we want to use soft solders in hot
surroundings, because they will rapidly lose their strength as they get near to 183°C.
Case studies in phase diagrams 37
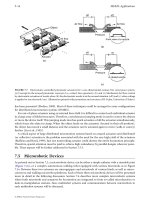
Fig. 4.3. The flat plates that make up the firebox of a model steam boiler are tied together with screwed
stays
. To make the threads pressure-tight they must be sealed with solder.
There is a nice illustration of this problem in the model traction engine that we looked
at in the first case study in Chapter 1. If you look back you will see that the most
critical component in the engine is the copper boiler (Fig. 1.1). The main parts of the
boiler are soldered together with a “silver solder” which melts between 610 and 620°C
(Table 4.1). This is an extremely strong and ductile alloy which loses little of its struc-
tural strength at boiler operating temperatures. But the screwed stays that tie the flat
firebox sides together (Figs 1.3, 4.3) present a problem. To make them pressure-tight
they need to be sealed with solder. Now, it is easy enough to silver solder the stays
where they come out through the outside of the firebox; but it is difficult to do this
inside the firebox because the gas blow torches that we normally use for silver solder-
ing copper will not burn properly in a confined space (an oxy-acetylene torch will, but
it has a very localised flame that can easily burn a hole in thin copper). Will soft solder
– which of course melts much more easily than silver solder – be adequate for sealing
stays inside the firebox?
Model boilers typically work at a gauge pressure of 6 bar. At this pressure the
temperature of the saturated water and steam in the boiler is 159°C, only 24°C below
the temperature at which lead–tin solders start to melt. Worse, the inner surface of the
firebox is hotter even than the water because it is next to the fire. In fact, ordinary soft
solders have been used successfully for many years inside model fireboxes, probably
because the copper is very good at conducting away the heat of the fire. But there is
little room for variation – if you habitually run the boiler on hard scale-forming water,
or accidentally let the water level down too far when steaming hard, or increase the
boiler pressure and thus temperature to get better performance, you are likely to blow
leaks big enough to put the fire out. The solution is to use the high-melting point soft
solder in Table 4.1 which is very close to being pure lead, and this is recommended by
the leading designers of miniature steam engines.
38 Engineering Materials 2
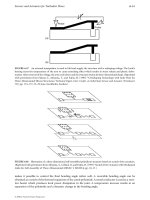
Fig. 4.4. Stages in zone refining a bar of impure silicon: (a) We start with a bar that has a uniform
concentration of impurity,
C
0
. (b) The left-hand end of the bar is melted by a small electric tube furnace,
making a liquid
zone
. The bar is encapsulated in a ceramic tube to stop the liquid running away. (c) The
furnace is moved off to the right, pulling the zone with it. (d) As the zone moves, it takes in more impurity
from the melted solid on the right than it leaves behind in the freshly frozen solid on the left. The surplus
pushes up the concentration of impurity in the zone, which in turn pushes up the concentration of impurity
in the next layer of solid frozen from it. (e) Eventually we reach steady state. (f) When the zone gets to the
end of the bar the concentrations in both solid and liquid increase rapidly. (g) How we set up eqn. (4.1).
Case studies in phase diagrams 39
Fig. 4.5. Schematic of top left corner of the “silicon-impurity” phase diagram. To make things simple, we
assume that the liquidus and solidus lines are straight. The impurity concentration in the solid is then always
less than that in the liquid by the factor
k
(called the
distribution coefficient
).
Pure silicon for microchips
The semiconductor industry would have been impossible had not the process of zone
refining been invented first. It is the standard way of producing ultrapure materials,
both for research and for making silicon and germanium-based devices.
Zone refining works like this. We start with a bar of silicon containing a small
uniform concentration C
0
of impurity (Fig. 4.4a). A small tubular electric furnace is put
over the left-hand end of the bar, and this is used to melt a short length (Fig. 4.4b).
Obviously, the concentration of impurity in this molten section must still be C
0
as no
impurity has either left it or come into it. But before we can go any further we must
look at the phase diagram (Fig. 4.5). To have equilibrium between the new liquid of
composition C
0
and the existing solid in the bar, the solid must be of composition kC
0
.
And yet the solid already has a composition of C
0
, (1/k) times too big. In fact, the
situation is rescued because a local equilibrium forms between liquid and solid at the
interface where they touch. The solid next to this interface loses a small amount
of impurity into the liquid by diffusion, and this lowers the composition of the solid to
kC
0
. Naturally, a gradient is produced in the composition of the solid (Fig. 4.4b), but
because solid-state diffusion is relatively sluggish we can neglect the atomic flux that
the gradient causes in the present situation.
The next stage in the zone-refining process is to move the furnace slowly and stead-
ily to the right. The left-hand end of the bar will then cool and refreeze but with the
equilibrium composition kC
0
(Fig. 4.4c). As the furnace continues to move to the right
the freezing solid, because it contains much less impurity than the liquid, rejects the
surplus impurity into the liquid zone. This has the effect of increasing the impurity
concentration in the zone, which in turn then increases the impurity concentration in
the next layer of freshly frozen solid, and so on (Fig. 4.4d). Eventually the concentra-
tions ramp themselves up to the situation shown in Fig. 4.4(e). Here, the solid ahead of
the zone has exactly the same composition as the newly frozen solid behind the zone.
This means that we have a steady state where as much impurity is removed from the
40 Engineering Materials 2
zone in the form of freshly frozen solid as is taken into the zone by melting old solid
ahead of it; the composition of the zone itself therefore stays constant.
The final stage takes place when the furnace runs up to the end of the bar (Fig. 4.4f).
The freshly frozen solid behind the zone continues to pump surplus impurity into an
ever-shortening zone, and the compositions of the liquid and the solid frozen from it
ramp themselves up again, eventually reaching in theory (but not in practice) infinite
values.
Figure 4.4(f) shows what moving the molten zone along the bar has done to it: we
have removed impurity from the left-hand end of the bar and dumped it at the right-
hand end; that is, we have zone refined the left-hand part of the bar.
Because we need to know how long the refined section of the bar is, it is important
to describe the ramping up of the compositions in a quantitative way. We can do this
by writing a differential equation which describes what happens as the zone moves
from some general position x to a new position x +
δ
x (Fig. 4.4g). For a bar of unit
cross-section we can write the mass conservation equation
(
δ
x)C
0
− (
δ
x)kC
L
= l(
δ
C
L
). (4.1)
impurity taken impurity lost surplus impurity left in
into zone by from zone in fixed-volume zone which
melting slice slice of freshly increases concentration
of bar of frozen solid of of impurity in liquid by
thickness
δ
x thickness
δ
x
δ
C
L
Here C
L
is the concentration of impurity in the liquid and l is the zone length. All
concentrations are given in units of impurity atoms per unit volume.
Developing eqn. (4.1) we get
l(dC
L
) = (C
0
− kC
L
) dx, (4.2)
and
lC
CkC
x
( )
,
d
d
L
0L
−
=
(4.3)
which we can integrate to give
−
l
k
ln (C
0
− kC
L
) = x + constant. (4.4)
Now the boundary condition is that, when x = 0, C
L
= C
0
. Substituting this into eqn.
(4.4) allows us to work out what the constant of integration is, and gives the solution
−
−
−
=
l
k
CkC
CkC
x ln
.
0
0
L
0
(4.5)
What we really want is the impurity concentration in the solid, C
S
. To get this we
manipulate eqn. (4.5) as follows.
ln
,
CkC
CkC
kx
l
0
00
−
−
=−
L
(4.6)
which we can invert to give
Case studies in phase diagrams 41
Fig. 4.6. Schematic plot of eqn. (4.9) showing how small
k
and long
l
give the best zone refining
performance.
CkC CkC
kx
l
000
( ) exp .−=− −
L
(4.7)
Substituting C
S
= kC
L
in eqn. (4.7) produces
CCC k
kx
l
00
1 ( ) exp .−= − −
S
(4.8)
This gives, at last,
CC k
kx
l
S
( ) exp ,=−− −
0
11
(4.9)
which we have plotted schematically in Fig. 4.6.
Figure 4.6 is interesting because it shows that for the best refining performance we
need both a long zone and an impurity that is relatively insoluble in the solid (low k).
Unfortunately long liquid zones can be destabilised by convection, and impurities
with a low k do not come to order! Commercial zone refining processes may therefore
involve a large number of passes done one after the other (Fig. 4.7). This obviously
adds a lot to the cost of the pure material, but the process can be speeded up consider-
ably by using the multi-heater arrangement shown in Fig. 4.8.
Making bubble-free ice
People who go in for expensive cocktails like to cool them with ice cubes which are
crystal clear – it adds to the aura of bejewelled, refreshing purity. Unfortunately, ice
cubes grown in an ordinary fridge are cloudy. So establishments which cater for up-
market clients install special machines to make clear ice.
42 Engineering Materials 2
Fig. 4.7. If the bar is repeatedly zone refined from left to right then more and more of the impurity will be
swept to the right-hand end of the bar. A large number of zone-refining passes may be needed to make the
left-hand half of the bar as pure as we need. The right-hand half is cut off and recycled. Note that eqn. (4.9)
can only be used to calculate the impurity distribution produced by the
first
pass. A computer program has to
be written to handle each subsequent pass.
Fig. 4.8. A multi-heater arrangement gives much faster zone refining.
The cloudiness of ordinary ice cubes is caused by thousands of tiny air bubbles. Air
dissolves in water, and tap water at 10°C can – and usually does – contain 0.0030 wt%
of air. In order to follow what this air does when we make an ice cube, we need to look
at the phase diagram for the H
2
O–air system (Fig. 4.9). As we cool our liquid solution
of water + air the first change takes place at about −0.002°C when the composition line
hits the liquidus line. At this temperature ice crystals will begin to form and, as the
temperature is lowered still further, they will grow. By the time we reach the eutectic
three-phase horizontal at −0.0024°C we will have 20 wt% ice (called primary ice) in our
two-phase mixture, leaving 80 wt% liquid (Fig. 4.9). This liquid will contain the max-
imum possible amount of dissolved air (0.0038 wt%). As latent heat of freezing is
removed at −0.0024°C the three-phase eutectic reaction of
Eutectic liquid (H
2
O + 0.0038 wt% air) → Eutectic mixture of (ice) + air
will take place. Finally, when all the eutectic liquid has frozen to ice, we will be left
with a two-phase mixture of eutectic [(ice) + air] which we can then cool down below
the eutectic temperature of −0.0024°C. In fact, because the solubility of air in ice is so
small (Fig. 4.9) almost all the air that was dissolved in the eutectic liquid separates out
into bubbles of air as soon as we get below the three-phase horizontal. And although
this air accounts for only 0.0038% by weight of the eutectic mixture, it takes up 2.92%
by volume. This is why ordinary ice looks cloudy – it contains a network of air bubbles
which scatter light very effectively.