Engineering Materials Vol II (microstructures_ processing_ design) 2nd ed. - M. Ashby_ D. Jones (1999) WW Part 8 ppsx
Bạn đang xem bản rút gọn của tài liệu. Xem và tải ngay bản đầy đủ của tài liệu tại đây (708.34 KB, 27 trang )
180 Engineering Materials 2
lead. This gives to ceramics yield strengths which are of order 5 GPa – so high that the
only way to measure them is to indent the ceramic with a diamond and measure the
hardness.
This enormous hardness is exploited in grinding wheels which are made from small
particles of a high-performance engineering ceramic (Table 15.3) bonded with an
adhesive or a cement. In design with ceramics it is never necessary to consider plastic
collapse of the component: fracture always intervenes first. The reasons for this are as
follows.
Fracture strength of ceramics
The penalty that must be paid for choosing a material with a large lattice resistance is
brittleness: the fracture toughness is low. Even at the tip of a crack, where the stress is
intensified, the lattice resistance makes slip very difficult. It is the crack-tip plasticity
which gives metals their high toughness: energy is absorbed in the plastic zone, mak-
ing the propagation of the crack much more difficult. Although some plasticity can
occur at the tip of a crack in a ceramic too, it is very limited; the energy absorbed is
small and the fracture toughness is low.
The result is that ceramics have values of K
IC
which are roughly one-fiftieth of those
of good, ductile metals. In addition, they almost always contain cracks and flaws (see
Fig. 16.7). The cracks originate in several ways. Most commonly the production method
(see Chapter 19) leaves small holes: sintered products, for instance, generally contain
angular pores on the scale of the powder (or grain) size. Thermal stresses caused by
cooling or thermal cycling can generate small cracks. Even if there are no processing or
thermal cracks, corrosion (often by water) or abrasion (by dust) is sufficient to create
cracks in the surface of any ceramic. And if they do not form any other way, cracks
appear during the loading of a brittle solid, nucleated by the elastic anisotropy of the
grains, or by easy slip on a single slip system.
The design strength of a ceramic, then, is determined by its low fracture toughness
and by the lengths of the microcracks it contains. If the longest microcrack in a given
sample has length 2a
m
then the tensile strength is simply
σ
π
TS
IC
.=
K
a
m
(17.1)
Some engineering ceramics have tensile strengths about half that of steel – around
200 MPa. Taking a typical toughness of 2 MPa m
1/2
, the largest microcrack has a size of
60
µ
m, which is of the same order as the original particle size. (For reasons given
earlier, particle-size cracks commonly pre-exist in dense ceramics.) Pottery, brick
and stone generally have tensile strengths which are much lower than this – around
20 MPa. These materials are full of cracks and voids left by the manufacturing pro-
cess (their porosity is, typically, 5–20%). Again, it is the size of the longest crack – this
time, several millimetres long – which determines the strength. The tensile strength of
cement and concrete is even lower – as low as 2 MPa in large sections – implying the
presence of at least one crack a centimetre or more in length.
The mechanical properties of ceramics 181
Fig. 17.2. Tests which measure the fracture strengths of ceramics. (a) The tensile test measures the tensile
strength, s
TS
. (b) The bend test measures the modulus of rupture, s
r
, typically 1.7 × s
TS
. (c) The compression
test measures the crushing strength, s
c
, typically 15 × s
TS
.
Fig. 17.3. (a) In tension the largest flaw propagates unstably. (b) In compression, many flaws propagate
stably to give general crushing.
As we shall see, there are two ways of improving the strength of ceramics: decreas-
ing a
m
by careful quality control, and increasing K
IC
by alloying, or by making the
ceramic into a composite. But first, we must examine how strength is measured.
The common tests are shown in Fig. 17.2. The obvious one is the simple tensile test
(Fig. 17.2a). It measures the stress required to make the longest crack in the sample
propagate unstably in the way shown in Fig. 17.3(a). But it is hard to do tensile tests on
ceramics – they tend to break in the grips. It is much easier to measure the force
required to break a beam in bending (Fig. 17.2b). The maximum tensile stress in the
surface of the beam when it breaks is called the modulus of rupture,
σ
r
; for an elastic
beam it is related to the maximum moment in the beam, M
r
, by
182 Engineering Materials 2
σ
r
r
M
bd
=
6
2
(17.2)
where d is the depth and b the width of the beam. You might think that
σ
r
(which is
listed in Table 15.7) should be equal to the tensile strength
σ
TS
. But it is actually a little
larger (typically 1.7 times larger), for reasons which we will get to when we discuss
the statistics of strength in the next chapter.
The third test shown in Fig. 17.2 is the compression test. For metals (or any plastic
solid) the strength measured in compression is the same as that measured in tension.
But for brittle solids this is not so; for these, the compressive strength is roughly
15 times larger, with
σ
C
≈ 15
σ
TS
. (17.3)
The reason for this is explained by Fig. 17.3(b). Cracks in compression propagate
stably, and twist out of their original orientation to propagate parallel to the compression
axis. Fracture is not caused by the rapid unstable propagation of one crack, but the
slow extension of many cracks to form a crushed zone. It is not the size of the largest
crack (a
m
) that counts, but that of the average
a
. The compressive strength is still given
by a formula like eqn. (17.1), with
σ
π
C
IC
= C
K
a
(17.4)
but the constant C is about 15, instead of 1.
Thermal shock resistance
When you pour boiling water into a cold bottle and discover that the bottom drops out
with a smart pop, you have re-invented the standard test for thermal shock resistance.
Fracture caused by sudden changes in temperature is a problem with ceramics. But
while some (like ordinary glass) will only take a temperature “shock” of 80°C before
they break, others (like silicon nitride) will stand a sudden change of 500°C, and this is
enough to fit them for use in environments as violent as an internal combustion engine.
One way of measuring thermal shock resistance is to drop a piece of the ceramic,
heated to progressively higher temperatures, into cold water. The maximum temper-
ature drop ∆T (in K) which it can survive is a measure of its thermal shock resistance.
If its coefficient of expansion is
α
then the quenched surface layer suffers a shrinkage
strain of
α
∆T. But it is part of a much larger body which is still hot, and this constrains
it to its original dimensions: it then carries an elastic tensile stress E
α
∆T. If this tensile
stress exceeds that for tensile fracture,
σ
TS
, the surface of the component will crack and
ultimately spall off. So the maximum temperature drop ∆T is given by
E
α
∆T =
σ
TS
. (17.5)
Values of ∆T are given in Table 15.7. For ordinary glass,
α
is large and ∆T is small
– about 80°C, as we have said. But for most of the high-performance engineering
ceramics,
α
is small and
σ
TS
is large, so they can be quenched suddenly through
several hundred degrees without fracturing.
The mechanical properties of ceramics 183
Fig. 17.4. A creep curve for a ceramic.
Creep of ceramics
Like metals, ceramics creep when they are hot. The creep curve (Fig. 17.4) is just like
that for a metal (see Book 1, Chapter 17). During primary creep, the strain-rate de-
creases with time, tending towards the steady state creep rate
˙
ε
ss
= A
σ
n
exp(−Q/RT). (17.6)
Here
σ
is the stress, A and n are creep constants and Q is the activation energy for
creep. Most engineering design against creep is based on this equation. Finally, the
creep rate accelerates again into tertiary creep and fracture.
But what is “hot”? Creep becomes a problem when the temperature is greater than
about
1
3
T
m
. The melting point T
m
of engineering ceramics is high – over 2000°C – so
creep is design-limiting only in very high-temperature applications (refractories, for
instance). There is, however, one important ceramic – ice – which has a low melting
point and creeps extensively, following eqn. (17.6). The sliding of glaciers, and even
the spreading of the Antarctic ice-cap, are controlled by the creep of the ice; geophysic-
ists who model the behaviour of glaciers use eqn. (17.6) to do so.
Further reading
W. E. C. Creyke, I. E. J. Sainsbury, and R. Morrell, Design with Non-ductile Materials, Applied
Science Publishers, 1982.
R. W. Davidge, Mechanical Behaviour of Ceramics, Cambridge University Press, 1979.
D. W. Richardson, Modern Ceramic Engineering. Marcel Dekker, 1982.
Problems
17.1 Explain why the yield strengths of ceramics can approach the ideal strength
˜
σ
,
whereas the yield strengths of metals are usually much less than
˜
σ
. How would
you attempt to measure the yield strength of a ceramic, given that the fracture
strengths of ceramics in tension are usually much less than the yield strengths?
184 Engineering Materials 2
17.2 Why are ceramics usually much stronger in compression than in tension?
Al
2
O
3
has a fracture toughness K
IC
of about 3 MPa m
1/2
. A batch of Al
2
O
3
samples is found to contain surface flaws about 30
µ
m deep. Estimate (a) the
tensile strength and (b) the compressive strength of the samples.
Answers: (a) 309 MPa, (b) 4635 MPa.
17.3 Modulus-of-rupture tests are carried out using the arrangement shown in Fig. 17.2.
The specimens break at a load F of about 330 N. Find the modulus of rupture,
given that l = 50 mm, and that b = d = 5 mm.
Answer: 198 MPa.
17.4 Estimate the thermal shock resistance ∆T for the ceramics listed in Table 15.7. Use
the data for Young’s modulus E, modulus of rupture
σ
r
and thermal expansion
coefficient
α
given in Table 15.7. How well do your calculated estimates of ∆T
agree with the values given for ∆T in Table 15.7?
[Hints: (a) assume that
σ
TS
≈
σ
r
for the purposes of your estimates; (b) where there
is a spread of values for E,
σ
r
or
α
, use the average values for your calculation.]
The statistics of brittle fracture and case study 185
Chapter 18
The statistics of brittle fracture and case study
Introduction
The chalk with which I write on the blackboard when I teach is a brittle solid. Some
sticks of chalk are weaker than others. On average, I find (to my slight irritation), that
about 3 out of 10 sticks break as soon as I start to write with them; the other 7 survive.
The failure probability, P
f
, for this chalk, loaded in bending under my (standard)
writing load is 3/10, that is
P
f
= 0.3. (18.1)
When you write on a blackboard with chalk, you are not unduly inconvenienced if
3 pieces in 10 break while you are using it; but if 1 in 2 broke, you might seek an
alternative supplier. So the failure probability, P
f
, of 0.3 is acceptable (just barely). If
the component were a ceramic cutting tool, a failure probability of 1 in 100 (P
f
= 10
−2
)
might be acceptable, because a tool is easily replaced. But if it were the window of a
vacuum system, the failure of which can cause injury, one might aim for a P
f
of 10
−6
;
and for a ceramic protective tile on the re-entry vehicle of a space shuttle, when one
failure in any one of 10,000 tiles could be fatal, you might calculate that a P
f
of 10
−8
was
needed.
When using a brittle solid under load, it is not possible to be certain that a compon-
ent will not fail. But if an acceptable risk (the failure probability) can be assigned to the
function filled by the component, then it is possible to design so that this acceptable
risk is met. This chapter explains why ceramics have this dispersion of strength; and
shows how to design components so they have a given probability of survival. The
method is an interesting one, with application beyond ceramics to the malfunctioning
of any complex system in which the breakdown of one component will cause the
entire system to fail.
The statistics of strength and the Weibull distribution
Chalk is a porous ceramic. It has a fracture toughness of 0.9 MPa m
1/2
and, being
poorly consolidated, is full of cracks and angular holes. The average tensile strength of
a piece of chalk is 15 MPa, implying an average length for the longest crack of about
1 mm (calculated from eqn. 17.1). But the chalk itself contains a distribution of crack
lengths. Two nominally identical pieces of chalk can have tensile strengths that differ
greatly – by a factor of 3 or more. This is because one was cut so that, by chance, all the
cracks in it are small, whereas the other was cut so that it includes one of the longer
186 Engineering Materials 2
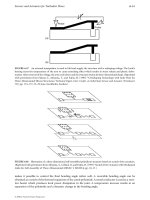
Fig. 18.1. If small samples are cut from a large block of a brittle ceramic, they will show a dispersion of
strengths because of the dispersion of flaw sizes. The average strength of the small samples is greater than
that of the large sample.
flaws of the distribution. Figure 18.1 illustrates this: if the block of chalk is cut into
pieces, piece A will be weaker than piece B because it contains a larger flaw. It is
inherent in the strength of ceramics that there will be a statistical variation in strength.
There is no single “tensile strength”; but there is a certain, definable, probability that a
given sample will have a given strength.
The distribution of crack lengths has other consequences. A large sample will fail at
a lower stress than a small one, on average, because it is more likely that it will contain
one of the larger flaws (Fig. 18.1). So there is a volume dependence of the strength. For
the same reason, a ceramic rod is stronger in bending than in simple tension: in
tension the entire sample carries the tensile stress, while in bending only a thin layer
close to one surface (and thus a relatively smaller volume) carries the peak tensile
stress (Fig. 18.2). That is why the modulus of rupture (Chapter 17, eqn. 17.2) is larger
than the tensile strength.
The Swedish engineer, Weibull, invented the following way of handling the statist-
ics of strength. He defined the survival probability P
s
(V
0
) as the fraction of identical
samples, each of volume V
0
, which survive loading to a tensile stress
σ
. He then
proposed that
PV
s
m
( ) exp
0
0
=−
σ
σ
(18.2)
where
σ
0
and m are constants. This equation is plotted in Fig. 18.3(a). When
σ
= 0 all
the samples survive, of course, and P
s
(V
0
) = 1. As
σ
increases, more and more samples
fail, and P
s
(V
0
) decreases. Large stresses cause virtually all the samples to break, so
P
s
(V
0
) → 0 and
σ
→ ∞.
If we set
σ
=
σ
0
in eqn. (18.2) we find that P
s
(V
0
) = 1/e (=0.37). So
σ
0
is simply the
tensile stress that allows 37% of the samples to survive. The constant m tells us how
The statistics of brittle fracture and case study 187
Fig. 18.2. Ceramics appear to be stronger in bending than in tension because the largest flaw may not be
near the surface.
Fig. 18.3. (a) The Weibull distribution function. (b) When the modulus,
m
, changes, the survival probability
changes as shown.
rapidly the strength falls as we approach
σ
0
(see Fig. 18.3b). It is called the Weibull
modulus. The lower m, the greater the variability of strength. For ordinary chalk, m is
about 5, and the variability is great. Brick, pottery and cement are like this too. The
engineering ceramics (e.g. SiC, Al
2
O
3
and Si
3
N
4
) have values of m of about 10; for these,
the strength varies rather less. Even steel shows some variation in strength, but it is
small: it can be described by a Weibull modulus of about 100. Figure 18.3(b) shows
that, for m ≈ 100, a material can be treated as having a single, well-defined failure
stress.
σ
0
and m can be found from experiment. A batch of samples, each of volume V
0
, is
tested at a stress
σ
1
and the fraction P
s1
(V
0
) that survive is determined. Another batch
is tested at
σ
2
and so on. The points are then plotted on Fig. 18.3(b). It is easy to
determine
σ
0
from the graph, but m has to be found by curve-fitting. There is a better
way of plotting the data which allows m to be determined more easily. Taking natural
logs in eqn. (18.2) gives
ln
()
1
00
PV
s
m
=
σ
σ
. (18.3)
188 Engineering Materials 2
Fig. 18.4. Survival probability plotted on “Weibull probability” axes for samples of volume
V
0
. This is just
Fig. 18.3(b) plotted with axes that straighten out the lines of constant
m
.
And taking logs again gives
ln ln
()
ln .
1
00
PV
m
s
=
σ
σ
(18.4)
Thus a plot of ln {ln (1/P
s
(V
0
)) } against 1n (
σ
/
σ
0
) is a straight line of slope m. Weibull-
probability graph paper does the conversion for you (see Fig. 18.4).
So much for the stress dependence of P
s
. But what of its volume dependence? We
have already seen that the probability of one sample surviving a stress
σ
is P
s
(V
0
). The
probability that a batch of n such samples all survive the stress is just {P
s
(V
0
)}
n
. If these
n samples were stuck together to give a single sample of volume V = nV
0
then its
survival probability would still be {P
s
(V
0
)}
n
. So
PV PV PV
ss
n
s
VV
() {( )} {( )} .==
00
0
/
(18.5)
This is equivalent to
ln ( ) ln ( )PV
V
V
PV
ss
=
0
0
(18.6)
or
PV
V
V
PV
ss
( ) exp ln ( ) .=
0
0
(18.7)
The Weibull distribution (eqn. 18.2) can be rewritten as
ln ( ) .PV
s
m
0
0
=−
σ
σ
(18.8)
The statistics of brittle fracture and case study 189
If we insert this result into eqn. (18.7) we get
P V
V
V
s
m
( ) exp ,=−
00
σ
σ
(18.9)
or
ln ( ) PV
V
V
s
m
=−
00
σ
σ
.
This, then, is our final design equation. It shows how the survival probability depends
on both the stress
σ
and the volume V of the component. In using it, the first step is to
fix on an acceptable failure probability, P
f
: 0.3 for chalk, 10
−2
for the cutting tool, 10
−6
for the vacuum-chamber window. The survival probability is then given by P
s
= 1 − P
f
.
(It is useful to remember that, for small P
f
, 1n P
s
= ln (1 − P
f
) ≈ −P
f
.) We can then
substitute suitable values of
σ
0
, m and V/V
0
into the equation to calculate the design
stress.
The time-dependence of ceramic strength
Most people, at some point in their lives, have been startled by the sudden disintegra-
tion, apparently without cause, of a drinking glass (a “toughened” glass, almost always),
or the spontaneous failure of an automobile windshield. These poltergeist-like happen-
ings are caused by slow crack growth.
To be more specific, if a glass rod at room temperature breaks under a stress
σ
in a
short time t, then an identical rod stressed at 0.75
σ
will break in a time of order 10t.
Most oxides behave like this, which is something which must be taken into account in
engineering design. Carbides and nitrides (e.g. SiC or Si
3
N
4
) do not suffer from this
time-dependent failure at room temperature, although at high temperatures they may do
so. Its origin is the slow growth of surface microcracks caused by a chemical interac-
tion between the ceramic and the water in its environment. Water or water vapour
reaching the crack tip reacts chemically with molecules there to form a hydroxide,
breaking the Si–O–Si or M–O–M bonds (Fig. 18.5). When the crack has grown to the
critical length for failure at that stress level (eqn. 17.1) the part fails suddenly, often
after a long period. Because it resembles fatigue failure, but under static load, it is
sometimes called “static fatigue”. Toughened glass is particularly prone to this sort of
failure because it contains internal stresses which can drive the slow crack growth, and
which drive spontaneous fast fracture when the crack grows long enough.
Fracture mechanics can be applied to this problem, much as it is to fatigue. We use
only the final result, as follows. If the standard test which was used to measure
σ
TS
takes a time t(test), then the stress which the sample will support safely for a time t is
σ
σ
TS
(test)
=
n
t
t
(18.10)
190 Engineering Materials 2
where n is the slow crack-growth exponent. Its value for oxides is between 10 and 20
at room temperature. When n = 10, a factor of 10 in time reduces the strength by 20%.
For carbides and nitrides, n can be as large as 100; then a factor of 10 in time reduces
the strength by only 2%. (Data for n are included in Table 15.7) An example of the use
of this equation is given in the following case study.
C
ASE
STUDY
:
THE
DESIGN
OF
PRESSURE
WINDOWS
Glass can support large static loads for long times. Aircraft windows support a pres-
sure difference of up to 1 atmosphere. Windows of tall buildings support wind loads;
diving bells have windows which support large water pressures; glass vacuum equip-
ment carries stress due to the pressure differences at which it operates. In Cambridge
(UK) there is a cake shop with glass shelves, simply supported at both ends, which on
weekdays are so loaded with cakes that the centre deflects by some centimetres. The
owners (the Misses Fitzbillies) say that they have loaded them like this, without
mishap, for decades. But what about cake-induced slow crack growth? In this case
study, we analyse safe design with glass under load.
Consider the design of a glass window for a vacuum chamber (Fig. 18.6). It is a
circular glass disc of radius R and thickness t, freely supported in a rubber seal around
its periphery and subjected to a uniform pressure difference ∆p = 0.1 MPa (1 atmo-
sphere). The pressure bends the disc. We shall simply quote the result of the stress
analysis of such a disc: it is that the peak tensile stress is on the low-pressure face of
the window and has magnitude
σ
max
(
.=
+33
8
2
2
v
p
R
t
)
∆
(18.11)
Fig. 18.5. Slow crack growth caused by surface hydration of oxide ceramics.
The statistics of brittle fracture and case study 191
Table 18.1 Properties of soda glass
Modulus
E
(GPa) 74
Compressive strength s
c
(MPa) 1000
Modulus of rupture s
r
(MPa) 50
Weibull modulus
m
10
Time exponent
n
10
Fracture toughness
K
IC
(MPa m
1/2
) 0.7
Thermal shock resistance D
T
(K) 84
Fig. 18.6. A flat-faced pressure window. The pressure difference generates tensile stresses in the low-
pressure face.
Poisson’s ratio v for ceramics is close to 0.3 so that
σ
max
.≈∆p
R
t
2
2
(18.12)
The material properties of window glass are summarised in Table 18.1. To use these
data to calculate a safe design load, we must assign an acceptable failure probability to
the window, and decide on its design life. Failure could cause injury, so the window is
a critical component: we choose a failure probability of 10
−6
. The vacuum system is
designed for intermittent use and is seldom under vacuum for more than 1 hour, so
the design life under load is 1000 hours.
The modulus of rupture (
σ
r
= 50 MPa) measures the mean strength of the glass in a
short-time bending test. We shall assume that the test sample used to measure
σ
r
had
dimensions similar to that of the window (otherwise a correction for volume is neces-
sary) and that the test time was 10 minutes. Then the Weibull equation (eqn. 18.9) for
a failure probability of 10
−6
requires a strength-reduction factor of 0.25. And the static
fatigue equation (eqn. 18.10) for a design life of 1000 hours [t/t(test) ≈ 10
4
] requires
a reduction factor of 0.4. For this critical component, a design stress
σ
= 50 MPa × 0.25
× 0.4 = 5.0 MPa meets the requirements. We apply a further safety factor of S = 1.5
to allow for uncertainties in loading, unforeseen variability and so on.
192 Engineering Materials 2
We may now specify the dimensions of the window. Inverting eqn. (18.12) gives
t
R
Sp
. .=
∆
=
σ
12
017
/
(18.13)
A window designed to these specifications should withstand a pressure difference of
1 atmosphere for 1000 hours with a failure probability of better than 10
−6
– provided,
of course, that it is not subject to thermal stresses, impact loads, stress concentrations
or contact stresses. The commonest mistake is to overtighten the clamps holding
the window in place, generating contact stresses: added to the pressure loading, they
can lead to failure. The design shown in Fig. 18.6 has a neoprene gasket to distribute
the clamping load, and a large number of clamping screws to give an even clamping
pressure.
If, for reasons of weight, a thinner window is required, two options are open to the
designer. The first is to select a different material. Thermally toughened glass (quenched
in such a way as to give compressive surface stress) has a modulus of rupture which is
3 times greater than that of ordinary glass, allowing a window
3
times thinner than
before. The second is to redesign the window itself. If it is made in the shape of a
hemisphere (Fig. 18.7) the loading in the glass caused by a pressure difference is
purely compressive (
σ
max
= [∆pR/2t]). Then we can utilise the enormous compressive
strength of glass (1000 MPa) to design a window for which t/R is 7 × 10
−5
with the
same failure probability and life.
There is, of course, a way of cheating the statistics. If a batch of components has a
distribution of strengths, it is possible to weed out the weak ones by loading them all
up to a proof stress (say
σ
0
); then all those with big flaws will fail, leaving the fraction
which were stronger than
σ
0
. Statistically speaking, proof testing selects and rejects the
low-strength tail of the distribution. The method is widely used to reduce the prob-
ability of failure of critical components, but its effectiveness is undermined by slow
crack growth which lets a small, harmless, crack grow with time into a large, dangerous
Fig. 18.7. A hemispherical pressure window. The shape means that the glass is everywhere in compression.
The statistics of brittle fracture and case study 193
one. The only way out is to proof test regularly throughout the life of the structure
– an inconvenient, often impractical procedure. Then design for long-term safety is
essential.
Further reading
R. W. Davidge, Mechanical Properties of Ceramics, Cambridge University Press, 1979.
W. E. C. Creyke, I. E. J. Sainsbury, and R. Morrell, Design with Non-ductile Materials, Applied
Science Publishers, 1982.
D. W. Richardson, Modern Ceramic Engineering, Marcel Dekker, 1982.
Problems
18.1 In order to test the strength of a ceramic, cylindrical specimens of length 25 mm
and diameter 5 mm are put into axial tension. The tensile stress σ which causes
50% of the specimens to break is 120 MPa. Cylindrical ceramic components of
length 50 mm and diameter 11 mm are required to withstand an axial tensile
stress σ
1
with a survival probability of 99%. Given that m = 5, use eqn. (18.9) to
determine σ
1
.
Answer: 32.6 MPa.
18.2 Modulus-of-rupture tests were carried out on samples of silicon carbide using the
three-point bend test geometry shown in Fig. 17.2. The samples were 100 mm
long and had a 10 mm by 10 mm square cross section. The median value of the
modulus of rupture was 400 MPa. Tensile tests were also carried out using
samples of identical material and dimensions, but loaded in tension along their
lengths. The median value of the tensile strength was only 230 MPa. Account in a
qualitative way for the difference between the two measures of strength.
Answer: In the tensile test, the whole volume of the sample is subjected to a
tensile stress of 230 MPa. In the bend test, only the lower half of the sample is
subjected to a tensile stress. Furthermore, the average value of this tensile stress
is considerably less than the peak value of 400 MPa (which is only reached at
the underside of the sample beneath the central loading point). The probability of
finding a fracture-initiating defect in the small volume subjected to the highest
stresses is small.
18.3 Modulus-of-rupture tests were done on samples of ceramic with dimensions
l = 100 mm, b = d = 10 mm. The median value of
σ
r
(i.e.
σ
r
for P
s
= 0.5) was
300 MPa. The ceramic is to be used for components with dimensions l = 50 mm,
b = d = 5 mm loaded in simple tension along their length. Calculate the tensile
stress σ that will give a probability of failure, P
f
, of 10
–6
. Assume that m = 10. Note
that, for m = 10,
σ
TS
=
σ
r
/1.73.
Answer: 55.7 MPa.
194 Engineering Materials 2
Chapter 19
Production, forming and joining of ceramics
Introduction
When you squeeze snow to make a snowball, you are hot-pressing a ceramic. Hot-
pressing of powders is one of several standard sintering methods used to form ceramics
which require methods appropriate to their special properties.
Glass, it is true, becomes liquid at a modest temperature (1000°C) and can be cast
like a metal. At a lower temperature (around 700°C) it is very viscous, and can again
be formed by the methods used for metals: rolling, pressing and forging. But the
engineering ceramics have high melting points – typically 2000°C – precluding the
possibility of melting and casting. And they lack the plasticity which allows the wide
range of secondary forming processes used for metals: forging, rolling, machining and
so forth. So most ceramics are made from powders which are pressed and fired, in
various ways, to give the final product shape.
Vitreous ceramics are different. Clay, when wet, is hydroplastic: the water is drawn
between the clay particles, lubricating their sliding, and allowing the clay to be formed
by hand or with simple machinery. When the shaped clay is dried and fired, one com-
ponent in it melts and spreads round the other components, bonding them together.
Low-grade ceramics – stone, and certain refractories – are simply mined and shaped.
We are concerned here not with these, but with the production and shaping of high-
performance engineering ceramics, clay products and glasses. Cement and concrete
are discussed separately in Chapter 20. We start with engineering ceramics.
The production of engineering ceramics
Alumina powder is made from bauxite, a hydrated aluminium oxide with the formula
Al(OH)
3
, of which there are large deposits in Australia, the Caribbean and Africa.
After crushing and purification, the bauxite is heated at 1150°C to decompose it to
alumina, which is then milled and sieved
2Al(OH)
3
= Al
2
O
3
+ 3H
2
O. (19.1)
Zirconia, ZrO
2
, is made from the natural hydrated mineral, or from zircon, a silicate.
Silicon carbide and silicon nitride are made by reacting silicon with carbon or nitro-
gen. Although the basic chemistry is very simple, the processes are complicated by the
need for careful quality control, and the goal of producing fine (<1
µ
m) powders
which, almost always, lead to a better final product.
These powders are then consolidated by one of a number of methods.
Production, forming and joining of ceramics 195
Fig. 19.2. The microscopic mechanism of sintering. Atoms leave the grain boundary in the neck between two
particles and diffuse into the pore, filling it up.
Fig. 19.1. Powder particles pressed together at (a) sinter, as shown at (b), reducing the surface area (and
thus energy) of the pores; the final structure usually contains small, nearly spherical pores (c).
Forming of engineering ceramics
The surface area of fine powders is enormous. A cupful of alumina powder with a
particle size of 1
µ
m has a surface area of about 10
3
m
2
. If the surface energy of alumina
is 1 J m
−2
, the surface energy of the cupful of powder is 1 kJ.
This energy drives sintering (Fig. 19.1). When the powder is packed together and
heated to a temperature at which diffusion becomes very rapid (generally, to around
2
3
T
m
), the particles sinter, that is, they bond together to form small necks which then
grow, reducing the surface area, and causing the powder to densify. Full density is not
reached by this sort of sintering, but the residual porosity is in the form of small,
rounded holes which have only a small effect on mechanical strength.
Figure 19.2 shows, at a microscopic level, what is going on. Atoms diffuse from the
grain boundary which must form at each neck (since the particles which meet there
have different orientations), and deposit in the pore, tending to fill it up. The atoms
move by grain boundary diffusion (helped a little by lattice diffusion, which tends to be
slower). The reduction in surface area drives the process, and the rate of diffusion
controls its rate. This immediately tells us the two most important things we need to
know about solid state sintering:
(a) Fine particles sinter much faster than coarse ones because the surface area (and
thus the driving force) is higher, and because the diffusion distances are smaller.
196 Engineering Materials 2
(b) The rate of sintering varies with temperature in exactly the same way as the diffu-
sion coefficient. Thus the rate of densification is given by
d
d
/
ρ
t
C
a
QRT
n
exp ( ).=−
(19.2)
Here
ρ
is the density, a is the particle size, C and n are constants, Q is the activation
energy for sintering, R is the gas constant and T is the absolute temperature. n is
typically about 3, and Q is usually equal to the activation energy for grain boundary
diffusion.
The sintering of powder is a production method used not only for ceramics but for
metals and polymers too (see Chapter 14). In practice, the powder is first pressed to an
initial shape in a die, mixing it with a binder, or relying on a little plasticity, to give a
“green compact” with just enough strength to be moved into a sintering furnace.
Considerable shrinkage occurs, of course, when the compact is fired. But by mixing
powders of different sizes to get a high density to start with, and by allowing for the
shrinkage in designing the die, a product can be produced which requires the min-
imum amount of finishing by machining or grinding. The final microstructure shows
grains with a distribution of small, nearly spherical pores at the edges of the grains
(see Fig. 16.7). The pore size and spacing are directly proportional to the original
particle size, so the finer the particles, the smaller are these defects, and the better the
mechanical strength (see Chapter 17). During sintering the grains in the ceramic grow, so
the final grain size is often much larger than the original particle size (see Chapter 5).
Higher densities and smaller grains are obtained by hot-pressing: the simultaneous
application of pressure and temperature to a powder. The powder is squeezed in a die
(die pressing, Fig. 19.3), or in a pressure vessel which is pumped up to a high gas
pressure (hot-isostatic pressing, or “HIPing”, Fig. 19.4). At the same time the powder
is heated to the sintering temperature. The pressure adds to the surface energy to drive
sintering more quickly than before. The rate is still controlled by diffusion, and so it
still varies with temperature according to eqn. (19.2). But the larger driving force
shortens the sintering time from hours to minutes, and increases the final density.
Indeed, full density can only be reached by pressure sintering, and the short time gives
no opportunity for grain growth, so the mechanical properties of the product are good.
Fig. 19.3. Hot pressing: the powder is heated and compressed in a shaped die.
Production, forming and joining of ceramics 197
Fig. 19.4. Hot-isostatic pressing (“HIPing”): the powder, in a thin steel preform, is heated and compressed
by high-pressure argon.
Fig. 19.5. Liquid phase sintering: a small amount of additive forms a liquid which accelerates sintering and
gives fully dense products but with some loss of high-temperature strength.
Die pressing allows such precision that no subsequent finishing processes are neces-
sary; but the dies, and thus the process, are expensive.
Full density can be reached by another route – though with some loss of mechanical
strength. Small amounts of additive, such as MgO in the sintering of Al
2
O
3
or Si
3
N
4
,
greatly increase the rate of sintering. The additive reacts with the powder (and any
impurities it may contain) to form a low-melting point glass which flows between the
powder particles at the sintering temperature. Diffusional transport through the melt
is high – it is like squeezing wet sugar – and the rate of sintering of the solid is
increased. As little as 1% of glass is all that is needed, but it remains at the boundaries
of the grains in the final product, and (because it melts again) drastically reduces their
high-temperature strength. This process of liquid phase sintering (Fig. 19.5) is widely
used to produce dense ceramics. It can be applied to metals too. The unhappy reader
with bad teeth will know this only too well: it is the way dental amalgam works
(silver, sintered at 36.9°C in the presence of a liquid phase, mercury).
There are two further processes. Silicon-based ceramics can be fabricated by sintering
or by hot-pressing. But a new route, reaction bonding (Fig. 19.6), is cheaper and gives
good precision. If pure silicon powder is heated in nitrogen gas, or a mixture of silicon
and carbon powders is sintered together, then the reactions
3Si + 2N
2
= Si
3
N
4
(19.3)
and
Si + C = SiC (19.4)
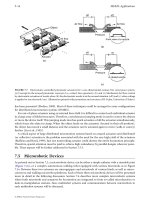
198 Engineering Materials 2
Fig. 19.6. Silicon ceramics (SiC, Si
3
N
4
) can be shaped by reaction bonding.
occur during the sintering, and bonding occurs simultaneously. In practice silicon, or
the silicon–carbon mixture, is mixed with a polymer to make it plastic, and then
formed by rolling, extrusion or pressing, using the methods which are normally used
for polymer forming (Chapter 24): thin shells and complicated shapes can be made in
this way. The polymer additive is then burnt out and the temperature raised so that
the silicon and carbon react. The final porosity is high (because nitrogen or carbon
must be able to penetrate through the section), but the dimensional change is so small
(0.1%) that no further finishing operations need be necessary.
Finally, some ceramics can be formed by chemical–vapour deposition (CVD) processes.
Silicon nitride is an example: Si
3
N
4
can be formed by reacting suitable gases in such a
way that it deposits on (or in) a former to give a shell or a solid body. When solids
grow from the vapour they usually have a structure like that of a casting: columnar
grains grow from the original surface, and may extend right through the section. For
this reason, CVD products often have poor mechanical properties.
Production and forming of glass
Commercial glasses are based on silica, SiO
2
, with additives: 30% of additives in a soda
glass, about 20% in high-temperature glass like Pyrex. The additives, as you will
remember from Chapter 15, lower the viscosity by breaking up the network. Raw
glasses are produced, like metals, by melting the components together and then casting
them.
Glasses, like metals, are formed by deformation. Liquid metals have a low viscosity
(about the same as that of water), and transform discontinuously to a solid when they
are cast and cooled. The viscosity of glasses falls slowly and continuously as they are
heated. Viscosity is defined in the way shown in Fig. 19.7. If a shear stress
σ
s
is applied
to the hot glass, it shears at a shear strain rate
˙
γ
. Then the viscosity,
η
, is defined by
η
σ
γ
˙
.=
s
10
(19.5)
It has units of poise (P) or 10
−1
Pa s. Glasses are worked in the temperature range in
which their viscosity is between 10
4
and 10
7
poise (Fig. 19.8).
Production, forming and joining of ceramics 199
Fig. 19.7. A rotation viscometer. Rotating the inner cylinder shears the viscous glass. The torque (and thus
the shear stress s
s
) is measured for a given rotation rate (and thus shear strain rate
˙g
).
Viscous flow is a thermally activated process. For flow to take place, the network
must break and reform locally. Below the glass temperature, T
g
, there is insufficient
thermal energy to allow this breaking and reforming to occur, and the glass ceases to
flow; it is convenient to define this as the temperature at which the viscosity reaches
10
17
P. (At T
g
, it would take a large window 10,000 years to deform perceptibily under
its own weight. The story that old church windows do so at room temperature is a
myth.) Above T
g
, the thermal energy of the molecules is sufficient to break and remake
bonds at a rate which is fast enough to permit flow. As with all simple thermally
activated processes, the rate of flow is given by
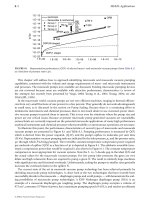
Fig. 19.8. The variation of glass viscosity with temperature. It follows an Arrhenius law (h ∝ exp(
Q
/
RT
)) at
high temperature.
200 Engineering Materials 2
Fig. 19.9. Forming methods for glass: pressing, rolling, float-moulding and blow-moulding.
rate of flow ∝ exp(–Q/RT) (19.6)
where Q (this time) is the activation energy for viscous flow. The viscosity,
η
, is
proportional to (rate of flow)
−1
, so
η
∝ exp(Q/RT). (19.7)
The figure shows how the viscosity of three sorts of glass, and of silica itself, vary
with temperature. On it, log
η
is plotted against 1/T, to give lines with slope Q/R. The
viscosity corresponding to the glass temperature is at the top of the figure. The work-
ing range is shown as a shaded band: it is wide because working procedures vary.
Typical processes, shown in Fig. 19.9, are:
(a) Hot-pressing, in which a slug of hot glass is pressed between dies (like the forging
of metals); it is used to make heavy glass insulators, and requires a high viscosity.
(b) Rolling, to produce a glass sheet; again, requires a high viscosity.
(c) Float moulding, to produce optically smooth window glass; needs a low viscosity.
(d) Blow moulding, to produce bottles or the thin envelopes for light bulbs, at rates of
several thousand per hour; requires a low viscosity.
Two other temperatures are important in the working of glass. At the annealing
point (
η
= 10
13
poise) there is still enough fluidity to relax internal stresses in about
Production, forming and joining of ceramics 201
15 minutes. Most glass products are held briefly at this temperature to remove tensile
stresses that might otherwise induce fracture. At the strain point (
η
= 10
14
poise) atom
motion in the glass is so sluggish that rapid cooling from this temperature does not
introduce new stresses. So, in processing, the product is cooled slowly from the an-
nealing point to the strain point and faster from there to room temperature.
Residual tensile stresses, as we have seen, are a problem. But compressive residual
stresses, in the right place, can be used to advantage. Toughened glass is made by
heating the product above its annealing point, and then cooling rapidly. The surface
contracts and hardens while the interior is still hot and more fluid; it deforms, allow-
ing the tensile stress in the surface to relax. Then the interior cools and contracts. But
the surface is below its strain point; it cannot flow, so it is put into compression by the
contracting interior. With the surface in compression, the glass is stronger, because the
microcracks which initiate failure in a glass are always in the surface (caused by
abrasion or corrosion). The interior, of course, is in tension; and if a crack should
penetrate through the protective compressive layer it is immediately unstable and the
toughened glass shatters spontaneously.
The production and forming of pottery, porcelain and brick
Pottery is one of the oldest materials. Clay artefacts as old as the pyramids (5000 bc)
are sophisticated in their manufacture and glazing; and shards of pottery of much
earlier date are known. Then, as now, the clay was mined from sites where weathering
had deposited them, hydroplastically formed, fired and then glazed.
Clays have plate-like molecules with charges on their surfaces (Chapter 16). The
charges draw water into the clay as a thin lubricating layer between the plates. With
the right moisture content, clays are plastic: they can be moulded, extruded, turned or
carved. But when they are dried, they have sufficient strength to be handled and
stacked in kilns for firing.
In slip casting a thin slurry, or suspension, of clay in water is poured into a porous
mould. Water is absorbed into the mould wall, causing a layer of clay to form and
adhere to it. The excess slurry is tipped out of the mould and the slip-cast shell, now
dry enough to have strength, is taken out and fired. The process allows intricate
shapes (like plates, cups, vases) to be made quickly and accurately.
When a clay is fired, the water it contains is driven off and a silicate glass forms by
reaction between the components of the clay. The glass melts and is drawn by surface
tension into the interstices between the particles of clay, like water into a sponge.
Clays for brick and pottery are usually a blend of three constituents which occur
together naturally: pure clay, such as the Al
2
O
3
2SiO
2
2H
2
O (kaolinite) described in
Chapter 16; a flux (such as feldspar) which contains the Na or K used to make the
glass; and a filler such as quartz sand, which reduces shrinkage but otherwise plays no
role in the firing. Low-fire clays contain much flux and can be fired at 1000°C. High-
fire clays have less, and require temperatures near 1200°C. The final microstructure
shows particles of filler surrounded by particles of mullite (the reaction product of
SiO
2
and Al
2
O
3
in the clay) all bonded together by the glass.
202 Engineering Materials 2
Vitreous ceramics are made waterproof and strengthened by glazing. A slurry of
powdered glass is applied to the surface by spraying or dipping, and the part is refired
at a lower temperature (typically 800°C). The glass melts, flows over the surface, and is
drawn by capillary action into pores and microcracks, sealing them.
Improving the performance of ceramics
When we speak of the “strength” of a metal, we mean its yield strength or tensile
strength; to strengthen metals, they are alloyed in such a way as to obstruct dislocation
motion, and thus raise the yield strength. By contrast, the “strength” of a ceramic is its
fracture strength; to strengthen ceramics, we must seek ways of making fracture more
difficult.
There are two, and they are complementary. The tensile fracture strength (Chapter 17) is
roughly
σ
π
TS
IC
=
K
a
(19.8)
and the compressive strength is about 15 times this value. First, we can seek to reduce
the inherent flaw size, a; and second (though this is more difficult) we can seek to
increase the fracture toughness, K
IC
.
Most ceramics (as we have seen) contain flaws: holes and cracks left by processing,
cracks caused by thermal stress, corrosion or abrasion. Even if there are no cracks to
start with, differences in elastic moduli between phases will nucleate cracks on load-
ing. And most of these flaws have a size which is roughly that of the powder particles
from which the ceramic was made. If the flaw size can be reduced, or if samples
containing abnormally large flaws can be detected and rejected, the mean strength of
the ceramic component is increased.
This is largely a problem of quality control. It means producing powders of a control-
led, small size; pressing and sintering them under tightly controlled conditions to
avoid defects caused by poor compaction, or by grain growth; and careful monitoring
of the product to detect any drop in standard. By these methods, the modulus of
rupture for dense Al
2
O
3
and silicon carbide can be raised to 1000 MPa, making them as
strong in tension as a high-strength steel; in compression they are 15 times stronger
again.
The other alternative is to attempt to increase K
IC
. Pure ceramics have a fracture
toughness between 0.2 and 2 MPa m
1/2
. A dispersion of particles of a second phase can
increase this a little: the advancing crack is pinned by the particles and bows between
them, much as a dislocation is pinned by strong second phase particles (Chapter 10).
A more complicated, and more effective, mechanism operates in partially stabilised
zirconia (PSZ), which has general application to other ceramics. Consider the analogy
of a chocolate bar. Chocolate is a brittle solid and because of this it is notch-sensitive:
notches are moulded into chocolate to help you break it in a fair, controlled way. Some
chocolate bars have raisins and nuts in them, and they are less brittle: a crack, when it
Production, forming and joining of ceramics 203
Fig. 19.10. A cermet is a particulate composite of a ceramic (WC) in a metal (Co). A crack in the ceramic
is arrested by plasticity in the cobalt.
runs into a raisin, is arrested; and more energy is needed to break the bar in half. PSZ
works in rather the same way. When ZrO
2
is alloyed with MgO, a structure can be
created which has small particles of tetragonal zirconia (the raisins). When a crack
approaches a particle, the particle transforms by a displacive transformation to a new
(monoclinic) crystal structure, and this process absorbs energy. The details are complic-
ated, but the result is simple: the toughness is increased from 2 to 8 MPa m
1/2
. This
may not seem much compared with 100 MPa m
1/2
for a tough steel, but it is big for a
ceramic, dramatically increasing its strength and resistance to thermal shock, and open-
ing up new applications for it.
Ceramics can be fibre-strengthened to improve their toughness. The plaster in old
houses contains horse hair; and from the earliest times straw has been put into mud
brick, in both cases to increase the toughness. In Arctic regions, ice is used for aircraft
runways; the problem is that heavy aircraft knock large chips out of the brittle surface.
One solution is to spread sawdust or straw onto the surface, flood it with water, and
refreeze it; the fibres toughen the ice and reduce cracking. More recently, methods
have been developed to toughen cement with glass fibres to produce high-strength
panels and pipes. The details of the toughening mechanisms are the same as those for
fibre-reinforced polymers, which we will discuss in Chapter 25. The effect can be
spectacular: toughnesses of over 10 MPa m
1/2
are possible.
An older and successful way of overcoming the brittleness of ceramics is to make a
sort of composite called a cermet. The best example is the cemented carbide used for
cutting tools. Brittle particles of tungsten carbide (WC) are bonded together with a film
of cobalt (Co) by sintering the mixed powders. If a crack starts in a WC particle, it
immediately runs into the ductile cobalt film, which deforms plastically and absorbs
energy (Fig. 19.10). The composite has a fracture toughness of around 15 MPa m
1/2
,
even though that of the WC is only 1 MPa m
1/2
.
The combination of better processing to give smaller flaws with alloying to improve
toughness is a major advance in ceramic technology. The potential, not yet fully real-
ised, appears to be enormous. Table 19.1 lists some of the areas in which ceramics
have, or may soon replace other materials.
204 Engineering Materials 2
Table 19.1 Applications of high-performance ceramics
Application Property Material
Cutting tools Hardness, toughness Alumina, sialons
Bearings, liners, seals Wear resistance Alumina, zirconia
Agricultural machinery Wear resistance Alumina, zirconia
Engine and turbine parts, Heat and wear resistance SiC, Si
3
N
4
, alumina, sialons,
burner nozzles ceramic–ceramic composites
Shielding, armour Hardness, toughness Alumina, boron carbide
High-performance windows Translucence and strength Alumina, magnesia
Artificial bone, teeth, joints Wear resistance, strength Zirconia, alumina
Integrated circuit substrates Insulation, heat resistance Alumina, magnesia
Fig. 19.11. Joining methods for ceramics: (a) glaze bonding, (b) diffusion bonding, (c) metallisation plus
brazing. In addition, ceramics can be clamped, and can be joined with adhesives.
Joining of ceramics
Ceramics cannot be bolted or riveted: the contact stresses would cause brittle failure.
Instead, ceramic components are bonded to other ceramic or metal parts by techniques
which avoid or minimise stress concentrations.
Two such techniques are diffusion bonding and glaze bonding (Fig. 19.11). In diffusion
bonding, the parts are heated while being pressed together; then, by processes like
those which give sintering, the parts bond together. Even dissimilar materials can be
bonded in this way. In glaze bonding the parts are coated with a low-melting (600°C)
glass; the parts are placed in contact and heated above the melting point of the glass.
Ceramics are joined to metals by metal coating and brazing, and by the use of adhes-
ives. In metal coating, the mating face of the ceramic part is coated in a thin film of a
refractory metal such as molybdenum (usually applied as a powder and then heated).