Engineering Materials Vol II (microstructures_ processing_ design) 2nd ed. - M. Ashby_ D. Jones (1999) WW Part 13 pdf
Bạn đang xem bản rút gọn của tài liệu. Xem và tải ngay bản đầy đủ của tài liệu tại đây (713.71 KB, 27 trang )
Case studies in design 315
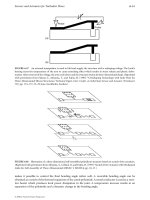
Fig. 28.18. Idealized vibration modes of a soundboard. The natural frequencies of the modes are
proportional to
n
2
.
and
fn
l
EI
bd
ww
ww
⊥
⊥
⊥
⊥
=
/
2
2
12
2
π
ρ
(28.23)
where E
w||
is the axial modulus and E
w⊥
is the radial modulus.
In order to estimate the soundboard frequencies, we set d
w
= 3 mm, l
||
= 356 mm, and
l
⊥
= 93 or 123 mm (Fig. 28.20). Violin soundboards are usually made from spruce,
Fig. 28.19. A wooden soundboard has both along-grain and across-grain vibrations. Although not shown
here, both types of vibration have a full set of modes, with
n
= 1, 2, 3 . . .
316 Engineering Materials 2
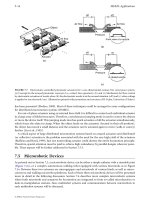
Fig. 28.20. Dimensions of a violin soundboard. The dashed outline marks the position of the
bass bar
–
a wooden “girder” stuck underneath the soundboard in an off-centre position. This effectively divides the
soundboard into two different across-grain regions.
which typically has E
w||
= 11.6 GPa, E
w⊥
= 0.71 GPa and
ρ
w
= 0.39 Mg m
−3
. Equations
(28.22) and (28.23) then give us the following data.
f
||
(s
−1
) ≈ 59 236 531 944 1475 2124 2891 etc.
! 217 868 1953 3472 etc.
f
⊥
(s
−1
) ≈
@
124 496 1116 1984 3100 etc.
For all the crudity of our calculations, these results show clearly that wooden violin
soundboards have an impressive number of natural frequencies.
Replacement materials
Spruce soundboards have a Young’s modulus anisotropy of about (11.6 GPa/0.71 GPa)
= 16. A replacement material must therefore have a similar anisotropy. This require-
ment immediately narrows the choice down to composites (isotropic materials like
metals or polymers will probably sound awful).
Because it is fairly cheap, we should begin by looking at GFRP. The moduli of glass
fibres and resin matrices are 72 GPa and 3 GPa respectively, giving us
E
c||
= 72V
f
+ 3(1 − V
f
) (28.24)
Case studies in design 317
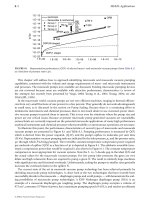
Fig. 28.21. Modulus anisotropies
Ec
||
/
E
c
⊥
for aligned GFRP and CFRP composites.
and
E
c⊥
=
VV
ff
72
1
3
1
.+
−
−
(28.25)
Now, as Fig. 28.21 shows, E
c||
/E
c⊥
can never be greater than 6.6 for GFRP; and this is far
too small to give a useful soundboard.
We must therefore hope that CFRP can give us the required anisotropy. The modu-
lus of type-1 carbon fibres is 390 GPa along the fibre axis (although it is only 12 GPa at
right angles to this). So
E
c||
= 390V
f
+ 3(1 − V
f
) (28.26)
and
E
c⊥
=
VV
ff
12
1
3
1
.+
−
−
(28.27)
This gives a maximum ratio of 43, which is more than enough. In fact, to bring the
anisotropy down to the target figure of 16 we need to reduce the volume fraction of
fibres to only 0.13!
Having matched f
||
/f
⊥
in this way we must now go on to match the frequencies
themselves. We can see from eqn. (28.22) that this requires
n
l
Ebd
bd
n
l
Ebd
bd
ww
ww
cc
cc
2
2
3
12
2
2
3
12
212212
π
ρ
π
ρ
||
|| ||
|| ||
|| ||
||
=
//
(28.28)
which tells us that the composite plate must have a thickness of
318 Engineering Materials 2
Fig. 28.22. Sandwich-type sectional composites give a much-improved stiffness-to-mass ratio.
d
c
= d
w
E
E
wc
cw
||
||
ρ
ρ
12/
.
(28.29)
Now we already know three of the terms in this equation: d
w
is 3 mm, E
w||
is 11.6 GPa
and
ρ
w
is 0.39 Mg m
−3
. The last two unknowns, E
c||
and
ρ
c
, can be calculated very easily.
When V
f
= 0.13 eqn. (28.24) tells us that E
c||
= 53 GPa.
ρ
c
can be found from the simple
rule of mixtures for density, with
ρ
c
= (0.13 × 1.9 + 0.87 × 1.15) Mg m
−3
= 1.25 Mg m
−3
. (28.30)
Equation (28.29) then tells us that d
c
= 2.52 mm.
This value for the thickness of the substitute CFRP soundboard sets us a difficult
problem. For the mass of the CFRP plate is greater than that of the spruce plate by the
factor
252 125
3039
269
3
3
. .
.
mm Mg m
mm Mg m
×
×
=
−
−
(28.31)
This excessive mass is quite unacceptable – the CFRP plate will need far too much
energy to get it vibrating. But how can we reduce the mass without shifting the
vibration frequency?
Sectional composites
The solution that has been adopted by makers of composite soundboards is to fabric-
ate a sandwich structure where a layer of high-quality cardboard is glued between two
identical layers of CFRP (Fig. 28.22). The philosophy of this design modification is to
replace some CFRP by a much lighter material in those regions that contribute least to
the overall stiffness of the section.
The density of the cardboard layer is around 0.2 Mg m
−3
. To match the mass of the
sandwich to that of the spruce soundboard we must then have
0.39d
w
= 1.25(d
2
− d
1
) + 0.2d
1
(28.32)
or
d
w
= 3.21d
2
− 2.69d
1
. (28.33)
Case studies in design 319
In order to formulate the criterion for frequency matching we can make the very
reasonable assumption that the CFRP dominates the stiffness of the sandwich section.
We also simplify eqn. (28.22) to
fn
l
EI
m
ww
w
||
||
||
=
2
32
12
2
π
/
/
(28.34)
where m
w
=
ρ
w
b
||
l
||
d
w
is the total mass of the wooden soundboard. Then, because we
want m
w
= m
sandwich
, frequency matching requires
E
w||
I
w
= E
c||
I
c
(28.35)
or
E
bd
Eb
dd
w
w
c||
||
|| ||
( )
.
3
2
3
1
3
12 12
=
−
(28.36)
We know that E
c||
/E
w||
= 53/11.6 = 4.6 so that eqn. (28.36) reduces to
ddd
w
3
2
3
1
3
46 .( ).=−
(28.37)
Finally, combining eqns. (28.33) and (28.37) gives us
(3.21d
2
− 2.69d
1
)
3
=
46
2
3
1
3
.( ).dd−
(28.38)
This result can be solved numerically to give d
1
= 0.63d
2
; and, using eqn. (28.33), we can
then show that d
2
= 0.66d
w
.
Conclusions
This design study has shown that it is possible to design a sectional composite that
will reproduce both the vibrational frequencies and the mass of a traditional wooden
soundboard. For a soundboard made out of spruce the equivalent composite is a
sandwich of cardboard glued between two identical layers of aligned CFRP with a
fibre volume fraction of 0.13. If the wooden soundboard is 3 mm thick the replacement
composite must be 1.98 mm thick with a cardboard core of 1.25 mm.
Background reading
M. F. Ashby and D. R. H. Jones, Engineering Materials I, 2nd edition, Butterworth-Heinemann,
1996, Chapter 6 (section on composites).
Further reading
C. M. Hutchins, “The physics of violins”, Scientific American, November 1962.
S. Timoshenko, D. H. Young and W. Weaver, Vibration Problems in Engineering, 4th edition,
Wiley, 1974.
320 Engineering Materials 2
Appendix 1
Teaching yourself phase diagrams
To the student
If you work through this course, doing the problems, you will get a working know-
ledge of what a phase diagram (or equilibrium diagram) means, and how to use it.
Don’t rush it: learn the definitions and meditate a little over the diagrams themselves,
checking yourself as you go. Some parts (the definitions, for instance) are pretty con-
centrated stuff. Others (some of the problems, perhaps) may strike you as trivial. That
is inevitable in a “teach yourself” course which has to accommodate students with
differing backgrounds. Do them anyway. The whole thing should take you about
4 hours. The material given here broadly parallels the introductory part of the excel-
lent text by Hansen and Beiner (referenced below); if you can read German, and want
to learn more, work through this.
Phase diagrams are important. Whenever materials engineers have to report on the
properties of a metallic alloy, or a ceramic, the first thing they do is reach for the phase
diagram. It tells them what, at equilibrium, the structure of the alloy or ceramic is. The
real structure may not be the equilibrium one, but equilibrium structure gives a base
line from which other (non-equilibrium) structures can be inferred.
Where do you find these summaries-of-structure? All engineering libraries contain:
Source books
M. Hansen and K. Anderko, Constitution of Binary Alloys, McGraw-Hill, 1958; and supplements,
by R. P. Elliott, 1965, and F. A. Shunk, 1969.
J. Hansen and F. Beiner, Heterogeneous Equilibrium, De Gruyter, 1975.
W. Hume-Rothery, J. W. Christian and W. B. Pearson, Metallurgical Equilibrium Diagrams, Insti-
tute of Physics, 1952.
E. M. Levin, C. R. Robbins and H. F. McMurdie, Phase Diagrams for Ceramicists, American
Ceramic Society, 1964.
Smithells’ Metals Reference Book, 7th edition, Butterworth-Heinemann, 1992.
ASM Metals Handbook, 10th edition, ASM International, 1990, vol. 8.
T
EACHING
YOURSELF
PHASE
DIAGRAMS
,
PART
1
COMPONENTS
,
PHASES
AND
STRUCTURES
Definitions are enclosed in boxes and signalled by “DEF.” These you have to learn.
The rest follows in a logical way.
Teaching yourself phase diagrams 321
Alloys
DEF.A metallic alloy is a mixture of a metal with other
metals or non-metals. Ceramics, too, can be mixed
to form alloys.
Copper (Cu) and zinc (Zn), when mixed, form the alloy brass. Magnesia (MgO) and
alumina (Al
2
O
3
) when mixed in equal proportions form spinel. Iron (Fe) and carbon (C)
mix to give carbon steel.
Components
Alloys are usually made by melting together and mixing the components.
DEF. The components are the chemical elements which
make up the alloy.
In brass the components are Cu and Zn. In carbon steel the components are Fe and C.
In spinel, they are Mg, Al and O.
DEF.A binary alloy contains two components. A ternary
alloy contains three; a quaternary, four, etc.
Symbols
Components are given capital letters: A, B, C or the element symbols Cu, Zn, C.
Concentration
An alloy is described by stating the components and their concentrations.
DEF. The weight % of component A:
W
A
=
weight of component A
weights of all components∑
× 100
The atom (or mol) % of component A:
X
A
=
number of atoms (or mols) of component A
number of atoms (or mols) of all components∑
× 100
322 Engineering Materials 2
(Weight in g)/(atomic or molecular wt in g/mol) = number of mols.
(Number of mols) × (atomic or molecular wt in g/mol) = weight in g.
Questions*
1.1 (a) Calculate the concentration in wt% of copper in a brass containing 40 wt% zinc.
Concentration of copper, in wt%: W
Cu
=
–––––––––––––––––––––––
(b) 1 kg of an
α
-brass contains 0.7 kg of Cu and 0.3 kg of Zn.
The concentration of copper in
α
-brass, in wt%: W
Cu
=
––––––––––––––
The concentration of zinc in
α
-brass, in wt%: W
Zn
=
––––––––––––––––
(c) The atomic weight of copper is 63.5 and of zinc 65.4.
The concentration of copper in the
α
-brass, in at%: X
Cu
=
––––––––––– –
The concentration of zinc in the
α
-brass, in at%: X
Zn
=
––––––––––––– –
1.2 A special brazing alloy contains 63 wt% of gold (Au) and 37 wt% of nickel (Ni).
The atomic weight of Au (197.0) is more than three times that of Ni (58.7). At a
glance, which of the two compositions, in at%, is likely to be the right one?
(a) X
Au
= 0.34, X
Ni
= 0.66.
(b) X
Au
= 0.66, X
Ni
= 0.34.
1.3 Your favourite vodka is 100° proof (49 wt% of alcohol). The molecular weight of
water is 18; that of ethyl alcohol – C
2
H
5
OH – is 46. What is the mol% of alcohol in
the vodka?
Mol% of alcohol:
X
C
HOH
25
=
––––––––––––––––––––––––––––––––
1.4 An alloy consists of X
A
at% of A with an atomic weight a
A
, and X
B
at% of B with an
atomic weight of a
B
. Derive an equation for the concentration of A in wt%. By
symmetry, write down the equation for the concentration of B in wt%.
Structure
Alloys are usually made by melting the components and mixing them together while
liquid, though you can make them by depositing the components from the vapour, or
by diffusing solids into each other. No matter how you make it, a binary alloy can take
one of four forms:
(a) a single solid solution;
(b) two separated, essentially pure, components;
(c) two separated solid solutions;
(d) a chemical compound, together with a solid solution.
* Answers are given at the end of each section. But don’t look at them until you have done your best to
answer all the questions in a given group.
Teaching yourself phase diagrams 323
How can you tell which form you have got? By examining the microstructure. To do
this, the alloy is cut to expose a flat surface which is then polished, first with success-
ively finer grades of emery paper, and then with diamond pastes (on rotating felt
discs) until it reflects like a brass doorknob. Finally, the polished surface is etched,
usually in a weak acid or alkali, to reveal the microstructure – the pattern of grains
and phases; brass doorknobs often show this pattern, etched by the salts from sweaty
hands. Grain boundaries show up because the etch attacks them preferentially. The
etch also attacks the crystals, leaving densely packed crystallographic planes exposed;
light is reflected from these planes, so some grains appear light and others dark,
depending on whether the light is reflected in the direction in which you are looking.
Phases can be distinguished, too, because the phase boundaries etch, and because
many etches are designed to attack one phase more than another, giving a contrast
difference between phases.
The Al–11 wt% Si casting alloy is typical of (b): the Si separates out as fine needles
(≈ 1 µm diameter) of essentially pure Si in a matrix of pure Al. The Cd–60 wt% Zn alloy
typifies (c): it consists of a zinc-rich phase of Zn with 0.1 wt% Cd dissolved in it plus
a cadmium-rich phase of Cd with 0.8 wt% Zn dissolved in it. Finally, slow-cooled
Al–4 wt% Cu is typical of (d) (p. 311).
Questions
1.5 List the compositions of the alloy and the phases mentioned above.
wt% Cd wt% Zn
Cadmium-zinc alloy
Zinc-rich phase
Cadmium-rich phase
Phases
DEF. All parts of an alloy with the same physical and
chemical properties and the same composition are
parts of a single phase.
The Al–Si, Cd–Zn and Al–Cu alloys are all made up of two phases.
Questions
1.6 You heat pure copper. At 1083°C it starts to melt. While it is melting, solid and liquid
copper co-exist. Using the definition above, are one or two phases present?
– ––
Why?
–––––––––––––––––––––––––––––––––––––––––––– –
324 Engineering Materials 2
1.7 Three components A, B and C of an alloy dissolve completely when liquid but
have no mutual solubility when solid. They do not form any chemical compounds.
How many phases, and of what compositions, do you think would appear in the
solid state?
Phases
–––––––––––––––––––––––––––––––––––––––––
Compositions
–––––––––––––––––––––––––––––––––––––––––
The constitution of an alloy
DEF. The constitution of an alloy is described by:
(a) The phases present.
(b) The weight fraction of each phase.
(c) The composition of each phase.
The properties of an alloy (yield strength, toughness, oxidation resistance, etc.)
depend critically on its constitution and on two further features of its structure: the
scale (nm or µm or mm) and shape (round, or rod-like, or plate-like) of the phases, not
described by the constitution. The constitution, and the scale and shape of the phases,
depend on the thermal treatment that the material has had.
E
XAMPLE
The alloy aluminium–4 wt% copper forms the basis of the 2000 series (Duralumin, or
Dural for short). It melts at about 650°C. At 500°C, solid Al dissolves as much as 4 wt%
of Cu completely. At 20°C its equilibrium solubility is only 0.1 wt% Cu. If the material
is slowly cooled from 500°C to 20°C, 4 wt% − 0.1 wt% = 3.9 wt% copper separates out
from the aluminium as large lumps of a new phase: not pure copper, but of the
compound CuAl
2
. If, instead, the material is quenched (cooled very rapidly, often by
dropping it into cold water) from 500°C to 20°C, there is not time for the dissolved
copper atoms to move together, by diffusion, to form CuAl
2
, and the alloy remains a
solid solution.
At room temperature, diffusion is so slow that the alloy just stays like this, frozen as
a single phase. But if you heat it up just a little – to 160°C, for example – and hold it
there (“ageing”), the copper starts to diffuse together to form an enormous number of
very tiny (nm) plate-like particles, of composition roughly CuAl
2
. On recooling to
room temperature, this new structure is again frozen in.
The yield strength and toughness of Dural differ enormously in these three condi-
tions (slow-cooled, quenched, and quenched and aged); the last gives the highest yield
and lowest toughness because the tiny particles obstruct dislocations very effectively.
It is important to be able to describe the constitution and structure of an alloy
quickly and accurately. So do the following, even if they seem obvious.
Teaching yourself phase diagrams 325
Questions
1.8 In the example above:
(a) How many phases are present at 500°C?
––––––––––––––––––––––
(b) How many phases after slow cooling to 20°C?
–––––––––––––––––––
(c) How many phases after quenching to 20°C?
––––––––––––––––––––
(d) How many phases after quenching and ageing?
––––––––––––––––––
1.9 An alloy of 120 g of lead (Pb) and 80 g of tin (Sn) is melted and cast. At 100°C, two
phases are found. There is 126.3 g of the lead-rich phase and 73.7 g of the tin-rich
phase. It is known that the lead-rich phase contains W
Pb
= 95% of lead. The con-
stitution of the alloy at room temperature is described by:
(a) Number of phases
–––––––––––––––––––––––––––––––––––
(b) Weight% of lead-rich phase
––––––––––––––––––––––––––––––
Weight% of tin-rich phase
–––––––––––––––––––––––––––––––
(c) Composition of lead-rich phase, in wt%: W
Pb
=
–––––––––––––––––––
W
Sn
=
–––––––––––––––––––
(d) Composition of tin-rich phase, in wt%: W
Pb
=
––––––––––––––––––––
W
Sn
=
––––––––––––––––––––
Equilibrium constitution
The Al–4 wt% Cu alloy of the example can exist at 20°C in three different states. Only
one – the slowly cooled one – is its equilibrium state, though given enough time the
others would ultimately reach the same state. At a given temperature, then, there is an
equilibrium constitution for an alloy, to which it tends.
DEF. A sample has its equilibrium constitution when, at a given,
constant temperature T and pressure p, there is no further
tendency for its constitution to change with time. This
constitution is the stable one.
Alloys can exist in non-equilibrium states – the Al–Cu example was an illustration.
But it is always useful to know the equilibrium constitution. It gives a sort of base-line
for the constitution of the real alloy, and the likely non-equilibrium constitutions can
often be deduced from it.
State variables
Ten different samples with the same composition, held at the same T and p, have the
same equilibrium constitution. Ten samples each of different composition, or each
held at different T or p values, have ten different equilibrium constitutions.
326 Engineering Materials 2
DEF. The independent constitution variables or state
variables are T, p and composition.
E
XAMPLE
FOR
THE
A
L
-C
U
ALLOY
(
DESCRIBED
ON
PAGE
311):
Values of the state variables Equilibrium constitution
5
(a) T = 500°C
4
p = 1 atm.
6
→ Single-phase solid solution of copper in aluminium
W
Al
= 96%
4
W
Cu
= 4% 7
(b) T = 20°C
5
p = 1 atm.
4
→ Two phases: Al containing 0.1 wt% Cu, and CuAl
2
W
Al
= 96%
6
W
Cu
= 4%
4
7
They are equilibrium constitutions because they are the ones reached by very slow
cooling; slow cooling gives time for equilibrium to be reached.
Certain thermodynamic relations exist between the state variables. In general for a
binary alloy we choose p, T and X
B
(the at% of component B) as the independ-
ent variables – though presently we shall drop p. The volume V and the composition
X
A
(= 1 − X
B
) are then determined: they are the dependent variables. Of course, the
weight percentages W
A
and W
B
can be used instead.
Equilibrium constitution (or phase) diagrams
The equilibrium constitution of an alloy can be determined experimentally by metal-
lography and thermal analysis (described later). If the pressure is held constant at
1 atm., then the independent variables which control the constitution of a binary alloy
are T and X
B
or W
B
.
DEF. An equilibrium-constitution diagram or equilibrium
diagram for short (or, shorter still, phase diagram),
is a diagram with T and X
B
(or W
B
) as axes. It shows
the results of experiments which measure the
equilibrium constitution at each T and X
B
(or W
B
).
Figure A1.1 shows a phase diagram for the lead–tin system (the range of alloys
obtained by mixing lead and tin, which includes soft solders). The horizontal axis is
composition X
Pb
(at%) below and W
Pb
(wt%) above. The vertical axis is temperature
Teaching yourself phase diagrams 327
Fig. A1.1.
in °C. The diagram is divided into fields: regions in which the number of phases is con-
stant. In the unshaded fields the equilibrium constitution is single phase: liquid (above),
or tin containing a little dissolved lead (left), or lead containing a little dissolved tin
(right). In the shaded fields the equilibrium constitution has two phases: liquid plus
solid Sn, or liquid plus solid Pb, or solid Pb mixed with solid Sn (each containing a
little of the other in solution).
DEF. The diagram shows the equilibrium constitution for
all the binary alloys that can be made of lead and tin,
in all possible proportions, or, in short, for the
lead–tin system.
A binary system is a system with two components.
A ternary system is a system with three components.
The constitution point
The state variables define a point on the diagram: the “constitution point”. If this point
is given, then the equilibrium number of phases can be read off. So, too, can their
composition and the quantity of each phase – but that comes later. So the diagram tells
you the entire constitution of any given alloy, at equilibrium. Refer back to the defini-
tion of constitution (p. 311) and check that this is so.
Questions
1.10 Figure A1.2 shows the Pb–Sn diagram again, but without shading.
(a) What is the composition and temperature (the state variables) of point 1?
Composition
––––––––––
at% Pb and
––––––––––
at% Sn
Temperature
––––––––––
°C
328 Engineering Materials 2
(b) Mark the constitution point for a Pb–70 at% Sn alloy at 250°C onto Fig. A1.2.
What does the alloy consist of at 250°C?
––––––––––––––––––––––
How many phases?
––––––––––––––––––––––––––––––––––
(c) Mark the point for a Pb–30 at% Sn at 250°C.
What does it consist of?
––––––––––––––––––––––––––––––––
How many phases?
––––––––––––––––––––––––––––––––– –
(d) Describe what happens as the alloy corresponding initially to the constitution
point 1 is cooled to room temperature.
At which temperatures do changes in the number or type of phases occur?
–––––––––––––––––––––––––––––––––––––––––––––––
What phases are present at point 2?
–––––––––––––––––––––––––
What phases are present at point 3?
–––––––––––––––––––––––––
(e) Describe similarly what happens when the alloy corresponding to the con-
stitution point 4 is cooled to room temperature.
Initial composition and temperature
––––––––––––––––––––––––
Initial number of phases
–––––––––––––––––––––––––––––––
Identify initial phase(s)
––––––––––––––––––––––––––––– – –
Temperature at which change of phase occurs
––––––––––––––––––
Number of phases below this temperature
–––––––––––––––––– – –
Identify phases
–––––––––––––––––––––––––––––––––––––
Part 1: final questions
1.11 Is a mixture of a metal and a non-metal called an alloy?
Yes No
1.12 Pernod is a transparent yellow fluid consisting of water, alcohol and Evil Esters.
The Evil Esters dissolve in strong water–alcohol solutions but precipitate out as
tiny whitish droplets if the solution is diluted with more water. It is observed that
Pernod turns cloudy at 60 wt% water at 0°C, at 70 wt% water at 20°C, and at
85 wt% water at 40°C. Using axes of T and concentration of water in wt%, sketch
an approximate phase diagram (Fig. A1.3) for the Pernod–water system, indicating
the single-phase and two-phase fields.
Fig. A1.2.
Teaching yourself phase diagrams 329
1.13 A micrograph reveals 10 black-etching needles and 8 globular regions that etch
grey, set in a white-etching matrix.
(a) How many phases would you judge there to be?
–––––––––––––––––
(b) Does the constitution of the alloy depend on the shape of the phases?
––––
(c) Can the constitution of the alloy depend on its thermal history?
––––––––
(d) What do you call the entire range of alloys which can be made of lead and
tin?
––––––––––––––––––––––––––––––––––––––––––– –
Answers to questions: part 1
1.1 (a) W
Cu
= 60%.
(b) W
Cu
= 70%, W
Zn
= 30%.
(c) X
Cu
= 71%, X
Zn
= 29%.
1.2 (a) is the correct composition.
1.3 Your vodka contains 27 mol% of alcohol.
1.4 W
A
=
aX
aX aX
AA
AA BB
.
+
W
B
=
aX
aX aX
BB
AA BB
.
+
1.5 wt% Cd wt% Zn
Cadmium–zinc alloy 40 60
Zinc-rich phase 0.1 99.9
Cadmium-rich phase 99.2 0.8
Fig. A1.3.
330 Engineering Materials 2
1.6 Two phases: liquid and solid. Although they have the same chemical composi-
tion, they differ in physical properties.
1.7 Three phases: pure A, pure B and pure C.
1.8 (a) 1.
(b) 2.
(c) 1.
(d) 2.
1.9 (a) 2.
(b) 63%, 37%.
(c) 95%, 5%.
(d) 0%, 100%.
1.10 (a) 50%, 50%, 300°C.
(See Fig. A1.4.)
Fig. A1.4.
(b) Liquid; 1.
(c) Liquid plus lead-rich solid; 2.
(d) 240°C, 183°C.
At point 2: liquid plus solid (Pb).
At point 3: two solids, (Sn) and (Pb).
(e) X
Pb
= 80%, T = 200°C.
1 phase.
Lead-rich solid.
155°C.
Two phases: lead-rich solid (Pb) and tin-rich solid (Sn).
1.11 Yes (see definition, on p. 308).
1.12 (See Fig. A1.5.)
Teaching yourself phase diagrams 331
Fig. A1.5.
1.13 (a) 3.
(b) Not at all.
(c) Yes (see example of Dural on p. 311).
(d) The lead–tin alloy system.
T
EACHING
YOURSELF
PHASE
DIAGRAMS
PART
2
ONE
AND
TWO
COMPONENT
SYSTEMS
Phase diagrams are mostly determined by thermal analysis. We now discuss one-
component systems to show how it works. The more complicated diagrams for binary,
ternary or quaternary alloys are determined by the same method.
Reminder
One-component systems independent variables p and T
Binary (A + B) systems independent variables p, T and X
B
Ternary (A + B + C) systems independent variables p, T, X
B
and X
C
Quaternary (A + B + C + D) systems independent variables p, T, X
B
, X
C
and X
D
One-component systems
The equilibrium constitution of a one-component system is fixed by the variables p
and T and so the equilibrium phases can be shown on a diagram with p and T axes.
The one shown in Fig. A1.6 has only one solid phase. Some, like ice, or iron, have
several.
Single-phase regions are areas.
Two phases co-exist along lines.
Three phases co-exist at a point: the triple point.
332 Engineering Materials 2
The behaviour at constant p is given by a horizontal cut through the diagram. The
solid melts at T
m
and vaporises at T
v
. The phase diagram at constant pressure is a line
(shown on the right) along which the span of stability of each phase is marked, as
shown in Fig. A1.7.
Fig. A1.8.
Fig. A1.7.
Fig. A1.6.
Questions
2.1 List the phases shown on the T–p diagram (Fig. A1.7)
–––
–––––––––––––– ––––––––––––––––––––
2.2 If the pressure is increased, does the melting point of the
material of the diagram increase
–––––––––
, decrease
–––––––––
or stay constant
–––––––––
?
2.3 At 1 atmosphere, iron melts at 1536°C and boils at 2860°C.
When it solidifies (a phase change), it does so in the b.c.c.
crystal structure and is called
δ
-iron. On cooling further it
undergoes two further phase changes. The first is at 1391°C
when it changes to the f.c.c. crystal structure, and is then
called
γ
-iron. The second is at 914°C when it changes back
to the b.c.c. crystal structure, and is called
α
-iron.
Teaching yourself phase diagrams 333
(a) Construct the one-dimensional phase diagram at constant pressure (1 atmo-
sphere) for iron (Fig. A1.8).
(b) Mark on it the regions in which each phase is stable. Label them with the
names of the phases.
(c) Indicate with arrows the points or regions where two phases coexist in
equilibrium.
Cooling curves
If a one-component system is allowed to cool at constant pressure, and the temper-
ature is recorded as a function of time, it looks as shown in Fig. A1.9. It shows five
regions:
Fig. A1.9.
1. Vapour;
2. Vapour-to-liquid phase change;
3. Liquid;
4. Liquid-to-solid phase change;
5. Solid.
The system is a single phase in regions 1, 3 and 5. Phase changes occur at the
temperatures corresponding to regions 2 and 4. When a phase transformation takes
place, the latent heat of the transformation is released (on cooling) or absorbed
(on heating). Because of this the temperature stays almost constant during the trans-
formation, giving shelves 2 and 4; cooling continues only when the transformation is
complete.
Phase transformations in the solid state (like those in iron), too, have latent heats.
They may be small, but with sensitive equipment for measuring cooling curves or
heating curves, they are easily detected.
The shelves of the cooling curve are called arrest points. The two shown in the
picture are at the boiling point and the melting point of the material, at the given
pressure.
334 Engineering Materials 2
Differential thermal analysis, DTA
Even in complicated, multi-component alloys, phase changes can be determined by
cooling (or heating) a sample, recording temperature as a function of time, and observ-
ing the arrest points. Greater accuracy is possible with differential thermal analysis. A
sample with the same thermal mass as the test sample, but showing no phase transforma-
tions, is cooled (or heated) side-by-side with the test sample, and the difference ∆T
between the cooling (or heating) curves is plotted. Sometimes the difference in power
needed to heat the two samples at the same rate is measured instead: there is a sudden
difference in power at the phase transformation. Both are just sophisticated ways of
getting the information shown in the cooling curve.
Questions
2.4 Construct the general shape of a cooling curve for iron, starting at 3000°C, and
ending at 0°C, using the data given in problem 2.3 (see Fig. A1.10).
Fig. A1.10.
2.5 Which phases do you expect at each of the following constitution points, for the
lead–tin system?
(a) X
Pb
= 40%, T = 175°C
–––––––––––––––––––––––––––––––––
(b) W
Pb
= 15%, T = 200°C
–––––––––––––––––––––––––––––––––
(c) W
Sn
= 10%, T = 200°C
–––––––––––––––––––––––––––––––––
(d) W
Pb
= 35%, T = 200°C
–––––––––––––––––––––––––––––––––
2.6 You cool a sample of X
Pb
= 80% from 325°C to 125°C sufficiently slowly that
equilibrium is maintained. Mark the two points on Fig. A1.11 and join them to
show the cooling path. In sequence, what phases appear as the alloy is cooled?
Teaching yourself phase diagrams 335
(a)
––––––––––––––––––––––––––––––––––––––––––––––
(b)
––––––––––––––––––––––––––––––––––––––––––––––
(c)
––––––––––––––––––––––––––––––––––––––––––––––
2.7 Figure A1.12 shows the phase diagram for ice. (The pressures are so large that
steam appears only at the extreme upper left.) There are eight different solid
phases of ice, each with a different crystal structure.
Current ideas of the evolution of the large satellite of Jupiter, Ganymede, assume
it to be largely made of ice. The pressure caused by gravitational forces rises
about linearly from the surface to the centre, reaching a peak of around 2 GPa.
Radioactive decay causes the centre to have a temperature of about 30°C, but at
the surface the temperature is below −100°C. Assuming a linear temperature
gradient from the surface to the centre, which phases of ice would be found in
Ganymede?
Fig. A1.11.
Fig. A1.12.
336 Engineering Materials 2
Binary systems
What defines the constitution of an alloy? If you can’t remember, refer back to the
definition on p. 311 and revise. The phase diagram gives all three pieces of informa-
tion. The first you know already. This section explains how to get the other two.
At first sight there is a problem in drawing phase diagrams for binary systems: there
are three state variables (p, T and X
B
).
The pressures on the ice phase diagram (above) are enormous, and when they are
this large they do affect phase equilibrium. But, almost always, we are interested only
in pressures near atmospheric (maybe up to 100 atmospheres), and such small pres-
sures have almost no effect on phase diagrams for solids and liquids. So we can drop
p as a variable and plot the phase diagram in two dimensions, with T and X
B
as axes.
For ternary (or higher) systems there is no way out – even after dropping p there are
three (or more) variables. Then we can only show sections through the phase diagram
of constant T or of constant X
C
, for example.
Composition of the phases
The phase diagram for a binary alloy (Fig. A1.13) shows single-phase fields (e.g. liquid)
and two-phase fields (e.g. liquid plus A). The fields are separated by phase boundaries.
When a phase boundary is crossed, a phase change starts, or finishes, or both.
Fig. A1.13.
DEF. When the constitution point lies in a single-phase
region, the alloy consists of a single, homogeneous,
phase. Its composition must (obviously) be that
of the alloy. The phase composition and the alloy
composition coincide in single-phase fields.
When the constitution point lies in a two-phase region the alloy breaks up into two
phases which do not have the same composition as the alloy (though a properly
weighted mean of the two compositions must equal that of the alloy).
Teaching yourself phase diagrams 337
What are these compositions? Well, if the alloy is at a temperature T, the two phases
(obviously) are at this temperature. Consider a Sn–20 at% Pb alloy, at 150°C. Fig-
ure A1.13 shows that, at this temperature, tin dissolves 1 at% of lead and lead dissolves
17 at% of tin. The compositions are shown as Xs on the 150°C isotherm (horizontal
line): they are the equilibrium phases at 150°C. The line joining them is called a tie line.
DEF. When the constitution point for an alloy lies in the two-phase
field the alloy breaks up into a mixture of two phases. The
composition of each phase is obtained by constructing the
tie line (the isotherm spanning the two-phase region,
terminating at the nearest phase boundary on either side).
The composition of each phase is defined by the ends of
the tie line.
Any alloy which lies on the tie line breaks up into the same two phases at its ends.
The proportions of each phase, of course, depend on the alloy composition.
Questions
2.8 (a) The constitution point for a Sn–60 at% Pb alloy at 250°C lies in a two-phase
field. Construct a tie line on Fig. A1.14 and read off the two phases and their
compositions.
The phases are
–––––––––––––––––––––––––––––––––––––
The composition of phase 1 is
–––––––––––––––––––––––––––––
The composition of phase 2 is
–––––––––––––––––––––––––––––
(b) The alloy is slowly cooled to 200°C. At 200°C:
The phases are
–––––––––––––––––––––––––––––––––––––
The composition of phase 1 is
–––––––––––––––––––––––––––––
The composition of phase 2 is
–––––––––––––––––––––––––––––
(c) The alloy is cooled further to 150°C. At this temperature:
The phases are
–––––––––––––––––––––––––––––––––––––
Fig. A1.14.
338 Engineering Materials 2
The composition of phase 1 is
–––––––––––––––––––––––––––––
The composition of phase 2 is
–––––––––––––––––––––––––––––
(d) Indicate with arrows on the figure the lines along which:
1. The composition of phase 1 moves
2. The composition of phase 2 moves
The overall composition of the alloy stays the same, of course. How can the
composi-tions of the phases change?
Proportions of phases in two-phase alloys
You can get the relative amounts of each phase in a two-phase alloy from the phase
diagram.
DEF. The weight fraction of phase
α
is designated W
α
.
That of phase
β
is W
β
. In a binary alloy W
α
+ W
β
= 1.
Prove this result to yourself. Notice that, for the first time in these notes, we have not
given a parallel result for atomic (or mol) fraction. You cannot have an atom fraction of
a phase because a phase (as distinct from a pure element, or a chemical compound of a
specific composition) does not have an atomic weight. Its composition can vary within
the limits given by the phase diagram.
To find the relative amounts of each phase, start off by constructing a tie line through
the constitution point and read off the compositions of the phases (Fig. A1.15).
EXAMPLE
At 250°C the Sn–Pb alloy with W
Pb
= 80% consists of two phases:
Liquid with
W
Pb
LIQ
= 65%;
Solid with
W
Pb
SOL
= 87%.
Fig. A1.15.
Teaching yourself phase diagrams 339
The weight fractions of each phase, W
LIQ
and W
SOL
, are fixed by the requirement that
matter is conserved. Then:
The weight fraction of solid in the alloy is
5
W
SOL
=
a
l
4
4 the
and the weight fraction of liquid is 6 “lever”
4 rule
W
LIQ
=
b
l
4
7
and W
SOL
+ W
LIQ
= 1 as they obviously must.
The easiest way to understand this result is to notice that, if the constitution point
coincides with the left-hand X (the left-hand end of the tie line), the alloy is all liquid;
and when it coincides with the right-hand X it is all solid; provided the phase diagram
has a linear wt% scale, the weight fraction of each phase is proportional to distance
measured along the tie line. Figure A1.16 shows how this relates to our example of an
80 wt% Pb alloy. The weight percentages of other alloys along the tie line can be found
in exactly the same way: the results can be calculated using the lever rule, or, more
approximately, can be read straight off the linear graphs in the figure.
Fig. A1.16.