Structure and Function in Agroecosystem Design and Management - Chapter 15 ppsx
Bạn đang xem bản rút gọn của tài liệu. Xem và tải ngay bản đầy đủ của tài liệu tại đây (3.53 MB, 21 trang )
PART III
Effects of Environmental Changes on
the Structure of Agroecosystems
920103_CRC20_0904_CH15 1/13/01 11:14 AM Page 313
920103_CRC20_0904_CH15 1/13/01 11:14 AM Page 314
CHAPTER 15
Impact of Grazing on Soil
Properties in Steppe Ecosystems
Zuozhong Chen and Xiaoyong Cui
CONTENTS
Introduction to Steppe Ecosystems in China . . . . . . . . . . . . . . . . . . . . . . . . . 316
Brief Account of Steppe Ecosystems . . . . . . . . . . . . . . . . . . . . . . . . . . 316
Main Types of Steppe Ecosystems and Their Features . . . . . . . . . . . 316
Temperate Meadow Steppe . . . . . . . . . . . . . . . . . . . . . . . . . . . . . 317
Temperate Typical Steppe. . . . . . . . . . . . . . . . . . . . . . . . . . . . . . . 317
Temperate Desert Steppe . . . . . . . . . . . . . . . . . . . . . . . . . . . . . . . 318
Effect of Grazing on Soil Properties in Steppe Ecosystems . . . . . . . . . . . . . 318
Effect of Grazing on Soil Physical Properties . . . . . . . . . . . . . . . . . . . 319
Effect on Soil Bulk Density . . . . . . . . . . . . . . . . . . . . . . . . . . . . . . 319
Effect on Capillary Water Content. . . . . . . . . . . . . . . . . . . . . . . . 319
Effect on Soil Hardness . . . . . . . . . . . . . . . . . . . . . . . . . . . . . . . . . 319
Effect on Soil Mechanical Composition . . . . . . . . . . . . . . . . . . . 319
Effect on Soil Microgranule and Structure . . . . . . . . . . . . . . . . . 322
Effect on Clay Minerals . . . . . . . . . . . . . . . . . . . . . . . . . . . . . . . . . 323
Effect on Submicroscopic Characters . . . . . . . . . . . . . . . . . . . . . 324
Effect of Grazing on Soil Nutrient Content . . . . . . . . . . . . . . . . . . . . 325
Effect on Organic Matter (OM), Total Nitrogen, (TN), and
Total Phosphorous (TP) Contents . . . . . . . . . . . . . . . . . . . . . . 325
Effect on Soil Available Nutrient Contents. . . . . . . . . . . . . . . . . 327
Effect on Soil Humus Features . . . . . . . . . . . . . . . . . . . . . . . . . . . . . . . 327
Composition of Soil Humus . . . . . . . . . . . . . . . . . . . . . . . . . . . . . 327
Elemental Composition of Humus . . . . . . . . . . . . . . . . . . . . . . . 329
Oxygen-contained Function Groups (OFGs) . . . . . . . . . . . . . . . 329
References . . . . . . . . . . . . . . . . . . . . . . . . . . . . . . . . . . . . . . . . . . . . . . . . . . . . . . 333
315
0-8493-0904-2/01/$0.00+$.50
© 2001 by CRC Press LLC
920103_CRC20_0904_CH15 1/13/01 11:14 AM Page 315
INTRODUCTION TO STEPPE ECOSYSTEMS IN CHINA
Brief Account of Steppe Ecosystems
Grassland, which is considered to be a soil type in China, is defined as “a
multi-functional natural complex composed of herbaceous and wooden for-
age plants together with the soil supporting them.” Grasslands are classified
into several types, including natural grasslands with total coverage over 5%,
campos cerrados whose crown density is under 0.3 and primarily used for
grazing, shrub herbosas with crown density under 0.4, secondary grasslands
after fallowed over 5 years, artificial ranges, and various greenbelts domi-
nated by perennial herbaceous plants. In general, grasslands are divided into
two categories—natural grasslands and artificial grasslands. The former,
which is also called steppe (Li, 1979), referred to plant communities domi-
nantly constituent of microthermic and xerophilous perennial herbage, on
some occasions of small xeric half-shrubs. Steppe is the principal component
of grassland in China. This chapter’s discussion is also confined to steppes.
In Eurasia, the steppe stretches about 110 degrees of longitude from
lower reaches of Danube eastward to the northeast of China, crossing
Romania, Russia, and Mongolia. It is the largest in the world, and unique,
and generally called the Eurasian Steppe Belt. It extends from west to east
between 45° and 55°N, then turns southwestward in northeast China, ending
at about 28°N. Such a distributive pattern closely correlates with the config-
uration of ocean and continent, as well as effects of atmospheric circulation
of this region. Because the effect of monsoons from the seas in the southeast
of China weakens, and the climate effect from Siberia and Mongolia strength-
ens gradually along a southeast-northwest direction, the farther away from
the southeast coast, the less the precipitation and the drier the climate is.
Therefore, vegetation types along the direction show distinct zonal charac-
teristics.
In China, the steppe extends about 4500 km from the Northeast Plain,
across the Great Hinggan Mountains, vast Mongolia Plateau, Erdus Plateau,
and Loess Plateau, to the south edge of the Tibetan Plateau. It occurs between
51 and 28°N, about 23 degrees of latitude.
Grasslands of various types cover approximately 4.00 ϫ 10
8
hm
2
, about
40% of the total land area of China. The steppe in north China is the main
part. It occupies some 3.13 ϫ 10
8
hm
2
, accounting for 78% of the total grass-
land area.
Main Types of Steppe Ecosystems and Their Features
The immense territory of China covers 31 degrees of latitude and quite
different climate zones. It spans five thermal climate zones: tropical, sub-
tropical, warm-temperate, temperate, and cold temperate zones. Annual pre-
cipitation varies dramatically. It is over 2000 mm at the southeast coast and
316 STRUCTURE AND FUNCTION IN AGROECOSYSTEMS DESIGN AND MANAGEMENT
920103_CRC20_0904_CH15 1/13/01 11:14 AM Page 316
less than 50 mm in the northwest interior region. Altitude changes from
below 100 m to above 8000 m. Furthermore, there are very many types of soils
in China. Hence, it is not surprising to see diverse grassland forms in China.
There are five dominant types: temperate meadow steppe, temperate typical
steppe, temperate desert steppe, alpine grassland, and tropical/subtropical
grassland.
Temperate Meadow Steppe
Temperate meadow steppe is zonal vegetation in temperate semi-humid
regions. It mainly consists of perennial meso-xerophilous cespitose and rhi-
zomial grasses as well as meso-xerophilous and mesophilous herbs with
more or less meso-xerophilous small shrubs. This type is developed under
the most humid steppe climate so that it concentrates on the transitional zone
between forest and steppe. In China, the temperate meadow steppe mostly
distributes at the east end of the steppe belt, such as the hill regions under the
foot of the Great Hinggan Mountains, and the upper parts of some alpine
grassland zones. The famous Hulunbuir Grassland, Xilingol Grassland, and
Horqin Grassland in Inner Mongolia, and Altay Grassland and Yining
Grassland in Xinjiang, have extensive meadow steppes with a total area of
1.45 ϫ 10
7
hm
2
, 3.7% of the total grassland area in China.
Temperate meadow steppes are developed under a temperate semi-
humid climate. The annual precipitation varies between 350 and 550 mm.
Cumulative temperature above 10°C is 1800–2200°C. The main soil types are
chernozem, dark chestnut soil, and meadow soil. Those soils are fertile, with
organic matter content normally over 3%.
Meadow steppes are rich in plant species. There are 15–25 species in 1m
2
.
Owing to the favorable natural conditions, plants grow well and are high in
productivity. The average height of the plant community is as high as 50 cm,
coverage is 70–90%, and forage output is 1500 kg.hm
Ϫ2
.
The meadow steppes have long been primary pastoral regions and tra-
ditional stock raising bases in China because of the favorable natural condi-
tions, high productivity, and fine forage quality. They are also good places for
developing cattle, fine and half-fine wool sheep, and wool-and-meat sheep
production.
Temperate Typical Steppe
This grassland type is developed in the interior continent under a tem-
perate semi-arid climate. The flora is mainly euxerophilous and euryxe-
rophilous perennial cespitose grasses or together with shrubs and small
half-shrubs under some conditions. The typical steppe distributes most
extensively and is the most representative one in China.
The typical steppe spreads mainly in the west of Hulunbiur Plateau,
most areas of Xilingol Plateau, hills of the north foot of Yinshan Mountains,
IMPACT OF GRAZING ON SOIL PROPERTIES IN STEPPE ECOSYSTEMS 317
920103_CRC20_0904_CH15 1/13/01 11:14 AM Page 317
the south part of the Great Hinggan Mountains, and Xiliaohe Plain. The total
area is about 4.11 ϫ 10
7
hm
2
, around 10.5% of the grasslands in China.
In typical steppe areas, winter and spring are cold and dry due to the
effect of the Mongolia high-pressure mass, while summer is temperate and
humid under the influence of monsoons from the southeast. Therefore, the
plant growing season is short but abundant with climate resources. Annual
average temperature is 1.5–6°C, annual rainfall is 350–400 mm, and accumu-
lated temperature above 10°C is 2100–3200°C. Soils in these regions are
chiefly chestnut soil of moderate fertility with organic matter around 2–4%
(Chen and Huang, 1985).
There are 10–20 plant species in 1m
2
area in a typical steppe. Plant
growth here is second only to that of meadow steppes. The average height of
the community is about 25 cm, total coverage 50%, and forage output 1200 kg
.
hm
Ϫ2
. Typical steppes are principally pastures and traditional livestock hus-
bandry bases in China. They are also good sites for developing fine wool
sheep and wool-and-meat sheep industries.
Temperate Desert Steppe
The temperate desert steppe is typical vegetation under temperate arid
climate. The dominant plants are small perennial xerophilous cespitose
grasses accompanied by some xerophilous and strong xerophilous small
half-shrubs and shrubs. This form occupies a narrow belt to the west of the
typical steppe. In China, it is within 75–114E and 37–47N, including the mid-
dle and western part of Inner Mongolia, the north of Ningxia, the middle of
Gansu, and Xinjiang Provinces. These areas are strongly influenced by the
Mongolia high pressure mass but at the end of the efficient extent by the mon-
soon from the southeast oceans. Hence, the climate has strong continental
characteristics. The annual precipitation is 150–250 mm, annual mean tem-
perature is 2–5°C, accumulated temperature above 10°C is 2200–3000°C. The
main soil type is calcic brown soil. It is poor in fertility, and organic matter
content is usually less than 2% (Chen et al., 1991). The composition of the
plant community is quite simple here. There are 10–15 plant species in 1m
2
.
Plants grow poorly and productivity is low. Average height of the grass layer
is 10–15 cm and total coverage is 15–30%. Generally the hay yield is 500 kg
.
hm
Ϫ2
, but it can be as high as 1000 kg
.
hm
Ϫ2
under certain conditions.
EFFECT OF GRAZING ON SOIL PROPERTIES IN STEPPE
ECOSYSTEMS
There are mainly two uses for natural grasslands in Inner Mongolia,
namely, grazing and mowing. Grazing has existed for thousands of years
while mowing only for several decades. During the long history of grassland
animal husbandry, utilization of grasslands by grazing was a synonym of
318 STRUCTURE AND FUNCTION IN AGROECOSYSTEMS DESIGN AND MANAGEMENT
920103_CRC20_0904_CH15 1/13/01 11:14 AM Page 318
grassland animal husbandry. With nomadism, moving for water and grass
was the dominant pattern then. Such a lifestyle was gradually replaced by
settlement with the development of the economy. However, grazing
remained the primary way of using natural grasslands. Therefore, it is impor-
tant to study the effects of grazing on the grassland ecosystem including
those on the soil system.
Effect of Grazing on Soil Physical Properties
Effect on Soil Bulk Density
Bulk density reflects soil tightness to some extent. Therefore, it is closely
correlated with soil porosity, aeration, and water-holding capacity. Soil vol-
ume weight increased steadily as grazing pressure elevated. Volume weight
under heavy grazing was 1.15 times that without grazing (Table 15.1; Jia et
al., 1997). The result suggested that soil was tightened and its volume weight
increased by long-term trampling of animals under overgrazing conditions.
Effect on Capillary Water Content
Capillary water content is the amount of water maintained by capillary
attraction. It decreased about 4% in a heavily grazed site compared with a
lightly grazed site (Table 15.1). The experiment showed capillary water con-
tent of soil in the heavily grazed site was only 78–85% of ungrazed site.
Effect on Soil Hardness
Like bulk density, soil hardness significantly increased in surface as
well as upper layers (0–20 cm) after heavy grazing (Table 15.2). Surface hard-
ness was 3.16, 6.453, 9.146, and 11.107 kg · cm
Ϫ2
, respectively, in ungrazed,
lightly grazed, moderately grazed, and heavily grazed sites in chestnut soil.
Soil surface hardness in the heavily grazed site was 3.5 times that in the
ungrazed site.
The result implied overgrazing by long-term high stocking rate deterio-
rated soil physical attributes.
Effect on Soil Mechanical Composition
Overgrazing had great influence on soil mechanical composition because
of long-term trampling by animals. The most significant effect was on the
surface layer in which sand content obviously increased while clay content
greatly decreased (Gu and Li, 1997; Kang et al., 1997). These studies indicated
that change of soil particle composition was the main reason for soil sandifi-
cation and erosion in degraded grasslands. In dark chestnut soil under
IMPACT OF GRAZING ON SOIL PROPERTIES IN STEPPE ECOSYSTEMS 319
920103_CRC20_0904_CH15 1/13/01 11:14 AM Page 319
320 STRUCTURE AND FUNCTION IN AGROECOSYSTEMS DESIGN AND MANAGEMENT
Table 15.1 Changes of Soil Physical Features and Capillary Water Content Under Different Grazing Pressure Treatments
Lightly Moderately Heavily Number of
Ungrazed grazed grazed grazed samples
Soil types Items Mean Variance Mean Variance Mean Variance Mean Variance
Dark Bulk density 1.162 0.0814 1.260 0.0497 1.302 0.0841 1.379 0.0586 30
chestnut (g · cm
Ϫ3
)
Surface hardness 3.186 1.659 6.453 1.169 9.146 2.381 11.107 2.489 50
(kg · cm
Ϫ2
)
Capillary water 39.24 2.814 34.04 1.065 33.29 0.550 30.55 1.042 9
content (%)
Bulk density 1.162 0.0282 1.312 0.0261 1.314 0.0285 1.329 0.0319
(g · cm
Ϫ3
)
Typical Surface hardness 2.903 2.431 7.122 2.235 4.726 3.351 7.169 2.451
chestnut (kg · cm
Ϫ2
)
Capillary water 34.17 0.733 33.77 1.282 31.60 2.097 29.20 0.923
content (%)
920103_CRC20_0904_CH15 1/13/01 11:14 AM Page 320
IMPACT OF GRAZING ON SOIL PROPERTIES IN STEPPE ECOSYSTEMS 321
Table 15.2 Mechanical Composition under Different Grazing Pressures
Contents of the soil particles in different classes (g
.
kg
؊1
)
Very Coarse Medium Fine Very fine
coarse sand sand sand sand Silt Clay
Depth Stones sand 0.5–1 0.25–0.5 0.1–0.25 0.05–0.1 0.05
Ͻ 0.002 Microgranule
Soil type (cm) Ͼ 2mm 1–2mm mm mm mm mm mm mm (g
.
kg
؊1
)
Dark chestnut 0–5 / 2 24 42 159 355 250 168 9
5–20 / 2 25 56 240 366 179 132 11
20–40 / 2 23 46 239 391 189 109
40–90 / 3 15 35 236 447 164 101
Ͼ 90 / / 5 25 405 437 48 80
Dark chestnut 0–5 / / 34 59 185 351 212 159 5
(overgrazing) 5–20 / 3 28 73 252 388 137 119 8
Typical 0–12 / 2 60 44 123 410 247 114 12
chestnut 12–26 / 3 52 47 116 412 216 154 10
26–32 / 3 40 38 104 417 251 147
32–61 / 2 34 34 102 441 216 171
61–96 / 4 25 14 65 442 277 173
Typical 0–12 / 10 90 64 176 349 175 136 7
chestnut 12–37 / 7 86 65 143 381 178 140 10
(overgrazing) 37–72 / 10 52 39 117 354 274 154
Note: / denotes nil.
920103_CRC20_0904_CH15 1/13/01 11:14 AM Page 321
heavy grazing, clay content in 0–5 cm soil layer was 159 g.kg
Ϫ1
, about 95% of
that in the ungrazed site where the content was 168 g.kg
Ϫ1
(Table 15.2). On the
contrary, particles larger than 0.1 mm were 278 g.kg
Ϫ1
and 227 g.kg
Ϫ1
in the
heavily grazed and ungrazed site, respectively. The former contained 1.2
times the clay content of the latter.
Effect on Soil Microgranule and Structure
Animal trampling under overgrazing had a profound effect on soil struc-
ture and microgranule. Microgranule was the typical structure in grassland
soil. It largely determined water, nutrition, and other soil fertility character-
istics. In overgrazed sites, soil microgranules were enormously reduced. For
example, the content was 20 g
.
kg
Ϫ1
in dark chestnut soil under natural con-
ditions. However, it was only 13 g
.
kg
Ϫ1
in the overgrazed site, approxi-
mately 65% of the former. It was the same in typical chestnut soil.
The structures referred to the relatively stable aggregates that were larger
than 0.25 mm and composed of soil particles in different sizes binding
together by diverse materials. Soaking the original-state soil for a period of
time, then screening it in the water, the structures would remain on the mesh.
The content of structures reflected the soil structure status to some degree.
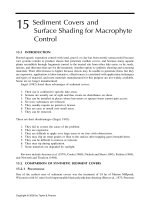
Table 15.3 shows the content of soil structures in variously degraded soils
caused by different grazing pressures, and Figure 15.1 characterizes the mor-
phology of aggregates.
There were a great number of structures in dark chestnut soil under nat-
ural conditions. Structures (Ͼ0.25 mm) accounted for 92.1% of total soil
weight in 0–5 cm soil layer and 87.7% in 0–20 cm. However, they were only
38.2 and 36.2% in the same soil layers in seriously degraded dark chestnut
soil, decreasing 51 and 54%, respectively. Not only the number declined, but
also its morphology changed enormously. Most structures were elliptic,
322 STRUCTURE AND FUNCTION IN AGROECOSYSTEMS DESIGN AND MANAGEMENT
Table 15.3 Contents of Soil Structures in Degraded Dark Chestnut Soils
Soil
Structures (
Ͼ 0.25mm)
Degree of soil Depth weight Percent of
degradation (cm) (g) Weight (g) soil weight (%)
Undegraded 0–5 20 18.42 92.1
5–20 20 17.56 87.8
Slightly degraded 0–5 20 16.84 84.2
5–20 20 16.36 81.8
Moderately degraded 0–5 20 10.17 50.9
10–15 20 8.46 42.3
Seriously degraded 0–5 20 7.64 38.2
10–18 20 7.26 36.2
920103_CRC20_0904_CH15 1/13/01 11:14 AM Page 322
inlaid with pores in different sizes under natural ungrazed conditions. Soil
particles were bound tightly with plant debris and organic matter. The struc-
tures were stable even upon soaking and shaking in water. In contrast, struc-
tures were mostly prismatic and large, and there were fewer organic binding
materials between soil particles when overgrazed. Consequently, the struc-
tures were unstable and prone to collapse upon soaking and shaking in
water.
Effect on Clay Minerals
Clay minerals were dominated by cloudy smectite and lamellate
hydromica in the 0–5cm layer in dark chestnut soil. There was only a small
proportion of kaolinite and incomplete hexagonal lamellar chlorite. The clay
minerals were coated or interlaced by some membranous organic matter
secreted by roots (Figure 15.2) to form an inorganic-organic-complex.
Clay mineral types in overgrazed dark chestnut were the same as those
in natural soils free of grazing. Yet the morphology of minerals was different.
Using an electron microscope it was found that the hydromica was smooth
with distinct edges and little organic binding matter. Quartz content was
increased and binding force between minerals was decreased so that the
complex was poorly structured and unstable (Figure 15.3).
IMPACT OF GRAZING ON SOIL PROPERTIES IN STEPPE ECOSYSTEMS 323
Figure 15.1 Morphology of the aggregates inside (B1) and outside (B2) the fence.
920103_CRC20_0904_CH15 1/13/01 11:14 AM Page 323
Effect on Submicroscopic Characters
The submicroscopic characters observed by scanning electron microscope
(SEM) showed that under natural ungrazed conditions, particles were tightly
arranged inside the microaggregates in the top layer of dark chestnut soil.
The interspace between particles was small, and that between microaggre-
gates was large. Because of the larger surface area, smectite adsorbed more
particles on the surface than hydromica and compactly formed organomin-
eral complexes, which were bound by organic or inorganic materials to fur-
ther construct larger aggregates with different sizes and functions (Figure
15.4). In seriously degraded dark chestnut soil, there were many quartz par-
ticles between structures, so that the binding force was reduced. Therefore,
aggregates were rough with many crannies and poor structure. They
adsorbed fewer organic and inorganic particles on the surface (Figure 15.5).
324 STRUCTURE AND FUNCTION IN AGROECOSYSTEMS DESIGN AND MANAGEMENT
Figure 15.3 Membranous inorganic and organic matter between aggregates.
Figure 15.2 Organic matter covering on the clays.
920103_CRC20_0904_CH15 1/13/01 11:14 AM Page 324
Effect of Grazing on Soil Nutrient Content
Effect on Organic Matter (OM),Total Nitrogen (TN), and Total
Phosphorus (TP) Contents
Grazing had significant effect on organic matter content in 0–10 cm soil
layer. OM decreased with the increased grazing pressure. For instance, the
OM contents were 2.99%, 1.65%, 1.61%, and 1.43% in ungrazed, lightly
grazed, moderately grazed, and heavily grazed sites, respectively, for dark
chestnut soil (Table 15.4, Guan et al., 1997). The OM content in the heavily
grazed site was 48% of that in the ungrazed site.
IMPACT OF GRAZING ON SOIL PROPERTIES IN STEPPE ECOSYSTEMS 325
Figure 15.5 Short of colloid organic matter in aggregates.
Figure 15.4 Bee-nestlike surface of aggregates.
920103_CRC20_0904_CH15 1/13/01 11:14 AM Page 325
326 STRUCTURE AND FUNCTION IN AGROECOSYSTEMS DESIGN AND MANAGEMENT
Table 15.4 Soil Nutrient Content in Soils under Different Grazing Pressures
Lightly Moderately Heavily
Ungrazed grazed grazed grazed
Soil types Items Mean Variance Mean Variance Mean Variance Mean Variance
Dark OM (%) 2.9935 0.8189 1.6502 0.5533 1.6018 0.4329 1.4267 0.2496
chestnut TN (%) 0.1498 0.0378 0.1366 0.0358 0.1418 0.290 0.1266 0.2496
TP (%) 0.1401 0.0376 0.1257 0.0328 0.1346 0.0211 0.1190 0.0312
NO
3
-N (mg · kg
Ϫ1
) 7.325 1.188 6.775 1.34 6.5 1.369 6.25 10.271
NH
4
-N (mg · kg
Ϫ1
) 12.906 1.424 11.47 0.822 12.065 1.272 11.673 0.971
Olsen-P (mg
.
kg
Ϫ1
) 1.402 0.298 1.363 0.203 1.346 0.229 1.244 0.264
Typical OM(%) 2.2133 0.43919 1.9814 0.1234 1.4382 0.3739 1.4605 0.2739
chestnut TN (%) 0.1458 0.0204 0.1393 0.0247 0.1351 0.0201 0.1274 0.0256
TP (%) 0.1388 0.0182 0.1294 0.0216 0.1268 0.0276 0.1022 0.0313
NO
3
-N (mg · kg
Ϫ1
) 6.85 1.141 6.55 1.258 6.38 0.653 6.13 1.008
NH
4
-N (mg · kg
Ϫ1
) 12.907 1.425 11.472 0.82 11.09 1.224 11.109 0.975
Olsen-P (mg · kg
Ϫ1
) 1.306 0.139 1.293 0.13 1.231 0.164 1.089 0.114
920103_CRC20_0904_CH15 1/13/01 11:14 AM Page 326
Changes of TN and TP were similar with OM. They decreased with an
increase of the stocking rate. Grasses grew poorly and vegetation productiv-
ity fell by long-term heavy grazing. As a result, the input and content of soil
OM declined after a period of heavy grazing. It was reported that OM con-
tent in 0–10 cm was perfectly correlated with the degree of soil degradation,
so it was recommended as an index for soil degradation. For dark chestnut
soil developed with typical steppe, the values were Ͼ 3.0%, 3.0%–2.0%,
2.0%–1.7%, and Ͻ 1.7% for undegraded, slightly degraded, moderately
degraded, and seriously degraded, respectively, while for typical chestnut
soil they were Ͼ 2.5%, 2.4%–2.0%, 2.0%–1.6%, and Ͻ 1.6%, respectively.
Effect on Soil Available Nutrient Contents
Elevation of stocking rate resulted in declination of soil NO
3
—N, NH
4
—
N, and available P contents. NO
3
—N content in dark chestnut soil free of ani-
mals was 7.30 mg · kg
Ϫ1
compared with 6.30 mg · kg
Ϫ1
under heavy grazing
(Table 15.4). The former was 17% higher than the latter. Contents of NH
4
—N
and available P were 12.9 mg · kg
Ϫ1
and 1.40 mg · kg
Ϫ1
without grazing and
11.7 mg · kg
Ϫ1
and 1.20 mg · kg
Ϫ1
for heavy grazing.
Effect on Soil Humus Features
Humus or OM was essential for soil structure and fertility. It was impor-
tant to study the relationship between grazing and soil humus. Variance of
humus features was studied and compared with that free of grazing by Lü et
al. (1992).
Composition of Soil Humus
Humus was divided into three parts by solubility, namely humus
acid(HA), fulvic acid(FA) and residue. The content and relative ratio of the
three components, which indicated humus quality, varied greatly in different
soil types. In steppe soils, proportion of HA and ratio of HA/FA gradually
reduced from chernozem, to chestnut, to calcic brown soil. At the same time,
active HA steadily declined to zero because of increase of free CaCO
3
content
(Xiong and Li, 1990). In general, macromolecular HA was first synthesized
and then degraded to form smaller FA. Frequent variation between dry and
wet and cool and warm conditions in the top layer favored the transforma-
tion to FA.
Grazing had obvious effects on soil humus composition in the following
aspects:
1. Increase of residual carbon content. Residual carbon increased
throughout the soil profile after grazing. For example, it increased
to 33.7% from 29.3% in the top layer (Table 15.5).
IMPACT OF GRAZING ON SOIL PROPERTIES IN STEPPE ECOSYSTEMS 327
920103_CRC20_0904_CH15 1/13/01 11:14 AM Page 327
328 STRUCTURE AND FUNCTION IN AGROECOSYSTEMS DESIGN AND MANAGEMENT
Table 15.5 Change in Humus Composition in Chestnut Soil with and without Grazing
Humus Extractable Proportion Proportion Residual
Soil layer content humus HA FA of HA in of FA in carbon
Treatment (cm) (C%) (C%) (C%) (C%) humus (%) humus (%) (C%) HA/FA
Free of 0–12 2.26 1.597 0.825 0.788 36.50 34.16 29.34 1.07
grazing 12 –52 0.97 0.706 0.346 0.360 35.67 37.11 27.21 0.96
52–76 0.88 0.648 0.292 0.356 33.18 40.45 26.37 0.82
76–110 0.76 0.606 0.196 0.395 25.79 51.97 18.95 0.50
Ͼ 110 0.76 0.626 0.190 0.418 25.00 55.00 17.60 0.45
Grazing 0–8 2.22 1.471 0.726 0.745 32.70 33.56 33.74 0.97
8–45 1.08 0.696 0.330 0.366 30.56 33.89 35.55 0.90
45–76 0.81 0.578 0.224 0.334 30.12 41.23 28.65 0.73
76–115 0.77 0.532 0.193 0.379 25.06 44.03 30.91 0.57
Ͼ 115 0.78 0.562 0.190 0.372 24.36 47.69 27.95 0.51
920103_CRC20_0904_CH15 1/13/01 11:14 AM Page 328
2. Enormous decreases of extractable humus and ration of HA/FA.
Extractable humus content was 1.60 and 1.47% in the top layer, free
of and with grazing. Proportions of HAand FA were 0.82 and 0.78%
in the former and 0.73 and 0.74% in the latter condition.
Elemental Composition of Humus
Carbon (C) and oxygen (O) composed most of HA and FA. HA had
50–60% of carbon and 30–35% of oxygen. The hydrogen (H), nitrogen (N),
and sulphur contents were 4–6%, 2–3%, and 0–2%, respectively. Grazing
influenced elemental ratio of humus as shown in Table 15.6.
Proportions of C and N in HA were enhanced, while H and O decreased
under grazing. This result suggested that cycling of humus was slower, and
the aging degree was higher without grazing because of high humus content
and relatively low fresh humus. On the contrary, soil humus content was low,
so the fresh part was relatively large after grazing. Newly formed humus had
more lipid branches with low degree of condensation. Therefore, the C/H
value was lower. The effect of grazing on humus in top layer of different sites
was similar to that along soil profile in the grazed site. As the influence of
grazing declined from top layer down, C/H and C/N increased.
FA responded differently. Its C and H contents were lower while N and
O content were higher with grazing. Thus, C/H and H/O were obviously
higher while C/N and C/O lower after grazing.
Oxygen-contained Function Groups (OFGs)
On the surface of humus colloid, there were vast OFGs which constituted
the principal part of the function groups and electrochemical attributes of the
humus matter (Zhao, 1991). HA had more C and less O than FA while both
contained acid function groups, especially COOH. The huge difference
between them was that oxygen in FA was composed mainly of COOH, OH
and C ϭ O groups while it was principally in aether or ester groups in HA
(Xia, 1987). Schnitzer (1977) reported that function groups of HA and FA var-
ied dramatically in soils of different bioclimate zones. Human activities, for
instance, grazing, also greatly influenced the function groups, as shown in
Tables 15.7 and 15.8.
The contents of carboxyl, phenol hydroxy, alcoholic hydroxy, ketonic
group, total acidity, and total hydroxies were obviously higher in ungrazed
sites while the content of quinoic group and total carbonyl groups signifi-
cantly lower. In FA besides quinoic group and total carbonyl, alcoholic
hydroxy and total carbonyl were also higher under grazing conditions.
Content of carboxyl and total hydroxies trended to increase after grazing.
There were many factors contributing to the changes of function groups
in HA and FA in which vegetation variance induced by grazing was impor-
tant.
IMPACT OF GRAZING ON SOIL PROPERTIES IN STEPPE ECOSYSTEMS 329
920103_CRC20_0904_CH15 1/13/01 11:14 AM Page 329
330 STRUCTURE AND FUNCTION IN AGROECOSYSTEMS DESIGN AND MANAGEMENT
Table 15.6 Effect of Grazing on Elemental Composition of HA and FA
Main element content (%)** Ratio between elements
Component Treatment Soil layer (cm) C H N O* C/H C/N C/O H/O
HA Grazed 0–12 56.95 5.17 4.52 33.36 11.61 12.60 1.71 6.45
12–52 55.26 4.27 3.94 36.53 12.94 4.03 1.53 8.55
52–76 55.32 4.06 3.87 36.75 13.63 14.29 1.50 9.03
76–110 54.35 3.87 3.45 38.33 14.04 15.75 1.41 9.90
Ͼ 110 54.71 3.32 3.50 38.47 16.48 15.63 1.40 11.59
FA Ungrazed 12–52 42.56 5.95 2.46 49.02 7.14 17.30 0.87 8.22
Grazed 52–76 41.24 4.69 3.26 50.81 8.79 12.65 0.81 10.83
*O% ϭ 100% Ϫ (C ϩ H ϩ N) % ** neglect of water content
920103_CRC20_0904_CH15 1/13/01 11:14 AM Page 330
IMPACT OF GRAZING ON SOIL PROPERTIES IN STEPPE ECOSYSTEMS 331
Table 15.7 Effect of Grazing on the Content of OFGs in HA (meq · g
؊1
)
Ratio of T Ratio of Ratio of
Soil Phenolic Alcoholic Quinoic Ketonic Total COOH QC
؍ O Ph OH
layer Carboxyl OH
1
OH
2
C ؍ OC؍ O
3
Total Total COOH and and and
(cm) COOH (Ph OH) (Al OH) (QC ؍ O) (KC ؍ O) acidity OH (T COOH) Ph OH KC ؍ O Al OH
Ungrazed
0–12 4.71 2.99 3.32 2.23 1.46 7.2 6.31 4.69 1.57 2.21 0.9
12–52 4.59 2.37 2.83 3 1.18 6.96 5.26 4.18 1.94 2.54 0.84
52–76 4.23 2.83 2.25 2.74 1.51 7.06 5.08 4.25 1.49 1.81 1.26
76–110 4.93 2.73 1.25 2.86 2.91 7.66 3.98 4.77 1.81 0.98 2.18
Ͼ 110 5 2.87 1.63 3.48 1.71 7.87 4.5 5.19 1.94 2.04 1.79
Grazed
0–12 3.78 2.87 3.16 2.92 1.91 6.35 6.03 4.83 1.31 1.52 0.91
12–52 4.39 2.17 3.09 3.22 1.02 6.56 5.26 4.24 2.02 3.16 0.7
52–76 4.36 2.6 2.21 2.77 1.39 6.96 4.81 4.16 1.68 1.99 1.17
76–110 4.28 2.7 1.12 2.98 2 7.52 3.82 4.98 1.71 1.49 2.41
Ͼ 110 6.09 1.92 1.52 3.58 1.81 8.01 3.44 5.39 3.17 1.98 1.26
1
Phenolic OH (meq · g
Ϫ1
) ϭ Total acidity (meq · g
Ϫ1
)—carboxyl (meq · g
Ϫ1
)
2
Alcoholic OH (meq · g
Ϫ1
) ϭ Total OH (meq · g
Ϫ1
)—Phenolic OH (meq · g
Ϫ1
)
3
Ketonic group (meq · g
Ϫ1
) ϭ Total carbonyl (meq · g
Ϫ1
)—Quinoic group (meq · g
Ϫ1
)
920103_CRC20_0904_CH15 1/13/01 11:14 AM Page 331
332 STRUCTURE AND FUNCTION IN AGROECOSYSTEMS DESIGN AND MANAGEMENT
Table 15.8 Effect of Grazing on the Content of OFGs in FA
Ratio of T Ratio of Ratio of
Soil Phenolic Alcoholic Quinoic Ketonic Total T COOH QC
؍ OPh OH
layer Carboxyl OH OH C
؍ OC؍ O Total Total COOH and and and
(cm) COOH (Ph OH) (Al OH) (QC ؍ O) (KC ؍ O) acidity OH (T COOH) Ph OH KC ؍ O Al OH
Ungrazed
0–12 10.45 1.88 3.68 1.82 1.92 12.35 5.56 3.74 5.56 0.95 0.51
12–52 9.85 1.48 3.86 1.88 1.58 11.03 5.34 3.46 6.66 1.19 0.38
52–76 8.57 1.26 3.99 1.63 1.4 10.25 5.27 3.03 6.69 1.16 0.32
Grazed
0–12 10.56 1.81 3.93 1.86 2.02 12.37 5.74 3.88 5.83 0.92 0.46
12–52 9.89 1.53 3.89 2.11 1.46 11.42 5.34 3.57 6.46 1.45 0.39
52–76 8.77 1.27 4.16 1.92 1.27 10.54 5.43 3.21 6.91 1.49 0.31
920103_CRC20_0904_CH15 1/13/01 11:14 AM Page 332
REFERENCES
Chen, Z. and Huang, D., 1985. The primary study of vegetations condition and form-
ing process of castanozem in the Xilin River Valley, Inner Mongolia.
Scientia
Geographica Sinica.
5(4):317–324.
Chen, Z., Huang, D., Nashun, D., and Siqin, G., 1991. Characteristics of bioaccumula-
tion of nitrogen and ash of brown soil of desert steppe in Ulan Qab, Inner
Mongolia.
Scientia Geographica Sinica. 11(2):118–124.
Gu, X. and Li, S., 1997. Influence of grazing intensity on the submicroscopic features
in steppe soils, in
Research on Grassland Ecosystem, Vol. 5. Beijing: Science Press.
80–87.
Guan, S., Qi, P., Kang, S., and Chang, J., 1997. Effects on the steppe soil nutrient con-
tents under different grazing intensities, in
Research on Grassland Ecosystem, Vol. 5.
Beijing: Science Press. 17–22.
Jia S., Cui X., Li S., Chen Y., and Wang F., 1997. Changes of soil physical attributes
along grazing gradient, in
Research on Grassland Ecosystem, Vol. 5. Beijing: Science
Press. 12–16.
Kang, S., Qi, P., He, J. and Guan, S., 1997. A study on the soil properties in the differ-
ently degraded grasslands, in
Research on Grassland Ecosystem, Vol. 5. Beijing:
Science Press. 88–94.
Li, B., 1979. General features of Chinese grassland vegetation.
Chinese Grasslands.
1:1–10.
Lü, Y., Zhao, Y., and Xia, R., 1992. Characteristics of humus in chestnut soil at Xilin
River Valley, Inner Mongolia. I. Variation of the characteristics of humus in chest-
nut soil by fencing and freely grazing, in
Research on Grassland Ecosystem, Vol. 4.
Beijing: Science Press. 171–179.
Schnitzer, M. and Khan, S. U., 1978.
Soil Organic Matter. Elsevier, Amsterdam, 37–48.
Xia, R., 1987. Soil humus matter, in
Principle of Soil Chemistry, Yu, T. (Ed.). Beijing:
Science Press, Beijing, 130–131.
Xiong, Y. and Li, Q., 1990.
Chinese Soils. Beijing: Science Press. 395.
Zhao, Y., 1991.
Soil Chemistry. Beijing: Beijing Agricultural University Press. 151–152.
IMPACT OF GRAZING ON SOIL PROPERTIES IN STEPPE ECOSYSTEMS 333
920103_CRC20_0904_CH15 1/13/01 11:14 AM Page 333