Statistical Process Control 5 Part 5 ppt
Bạn đang xem bản rút gọn của tài liệu. Xem và tải ngay bản đầy đủ của tài liệu tại đây (298.19 KB, 35 trang )
Process control using variables 127
They pointed out that, regardless of the ease or difficulty of grouping the
data from a particular process, the forming of subgroups is an essential step in
the investigation of stability and in the setting up of control charts.
Furthermore, the use of group ranges to estimate process variability is so
widely accepted that ‘the mean of subgroup ranges’ R may be regarded as the
central pillar of a standard procedure.
Many people follow the standard procedure given on page 116 and achieve
great success with their SPC charts. The short-term benefits of the method
include fast reliable detection of change which enables early corrective action
to be taken. Even greater gains may be achieved in the longer term, however,
if charting is carried out within the context of the process itself, to facilitate
greater process understanding and reduction in variability.
In many processes there is a tendency for observations that are made over
a relatively short time period to be more alike than those taken over a longer
period. In such instances the additional ‘between group’ or ‘medium-term’
variability may be comparable with or greater than the ‘within group’ or
‘short-term’ variability. If this extra component of variability is random there
may be no obvious way that it can be eliminated and the within group
variability will be a poor estimate of the natural random longer term variation
of the process. It should not then be used to control the process.
Caulcutt and Porter observed many cases in which sampling schemes based
on the order of output or production gave unrepresentative estimates of the
random variation of the process, if R/d
n
was used to calculate . Use of the
standard practice in these cases gave control lines for the mean chart which
were too ‘narrow’, and resulted in the process being over-controlled.
Unfortunately, not only do many people use bad estimates of the process
variability, but in many instances sampling regimes are chosen on an arbitrary
basis. It was not uncommon for them to find very different sampling regimes
being used in the preliminary process investigation/chart design phase and the
subsequent process monitoring phase.
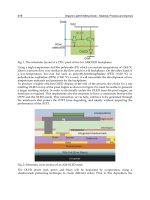
Caulcutt and Porter showed an example of this (Figure 6.12) in which mean
and range charts were used to control can heights on a can-making production
line. (The measurements are expressed as the difference from a nominal value
and are in units of 0.001 cm.) It can be seen that 13 of the 50 points lie outside
the action lines and the fluctuations in the mean can height result in the
process appearing to be ‘out-of-statistical control’. There is, however, no
simple pattern to these changes, such as a trend or a step change, and the
additional variability appears to be random. This is indeed the case for the
process contains random within group variability, and an additional source of
random between group variability. This type of additional variability is
frequently found in can-making, filling and many other processes.
A control chart design based solely on the within group variability is
inappropriate in this case. In the example given, the control chart would
128 Process control using variables
mislead its user into seeking an assignable cause on 22 occasions out of the
50 samples taken, if a range of decision criteria based on action lines, repeat
points in the warning zone and runs and trends are used (page 118). As this
additional variation is actually random, operators would soon become
frustrated with the search for special causes and corresponding corrective
actions.
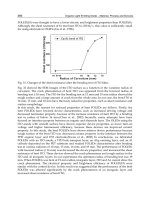
To overcome this problem Caulcutt and Porter suggested calculating the
standard error of the means directly from the sample means to obtain, in this
case, a value of 2.45. This takes account of within and between group
variability. The corresponding control chart is shown in Figure 6.13. The
process appears to be in statistical control and the chart provides a basis for
effective control of the process.
Stages in assessing additional variability
1 Test for additional variability
As we have seen, the standard practice yields a value of R from k small
samples of size n. This is used to obtain an estimate of the within sample
standard deviation :
= R/d
n
.
Figure 6.12 Mean and range chart based on standard practice
Process control using variables 129
The standard error calculated from this estimate (/
ͱ
ස
n) will be appropriate if
describes all the natural random variation of the process. A different
estimate of the standard error,
e
, can be obtained directly from the sample
means, X
i
:
e
=
ͱ
සසසසසසසස
⌺
k
i=1
(X
i
– X )
2
/(k – 1)
X is the overall mean or grand mean of the process. Alternatively, all the
sample means may be entered into a statistical calculator and the
n – 1
key
gives the value of
e
directly.
The two estimates are compared. If
e
and /
ͱස
n are approximately equal
there is no extra component of variability and the standard practice for control
chart design may be used. If
e
is appreciably greater than /
ͱස
n there is
additional variability.
In the can-making example previously considered, the two estimates
are:
/
ͱස
n = 0.94
e
= 2.45
This is a clear indication that additional medium-term variation is present.
Figure 6.13 Mean and range chart designed to take account of additional random variation
130 Process control using variables
(A formal significance test for the additional variability can be carried out
by comparing n
e
2
/
2
with a required or critical value from tables of the F
distribution with (k– 1) and k(n–1) degrees of freedom. A 5 per cent level of
significance is usually used. See Appendix G.)
2 Calculate the control lines
If stage 1 has identified additional between group variation, then the mean
chart action and warning lines are calculated from
e
:
Action lines X ± 3
e
;
Warning lines X ± 2
e
.
These formulae can be safely used as an alternative to the standard practice
even if there is no additional medium-term variability, i.e. even when = R/d
n
is a good estimate of the natural random variation of the process.
(The standard procedure is used for the range chart as the range is
unaffected by the additional variability. The range chart monitors the within
sample variability only.)
In the can-making example the alternative procedure gives the following
control lines for the mean chart:
Upper Action Line 7.39
Lower Action Line –7.31
Upper Warning Line 4.94
Lower Warning Line –4.86.
These values provide a sound basis for detecting any systematic variation
without over-reacting to the inherent medium-term variation of the process.
The use of
e
to calculate action and warning lines has important
implications for the sampling regime used. Clearly a fixed sample size, n, is
required but the sampling frequency must also remain fixed as
e
takes
account of any random variation over time. It would not be correct to use
different sampling frequencies in the control chart design phase and
subsequent process monitoring phase.
6.6 Summary of SPC for variables using X and R charts
If data is recorded on a regular basis, SPC for variables proceeds in three main
stages:
Process control using variables 131
1 An examination of the ‘State of Control’ of the process (Are we in
control?). A series of measurements are carried out and the results plotted
on X and R control charts to discover whether the process is changing due
to assignable causes. Once any such causes have been found and removed,
the process is said to be ‘in statistical control’ and the variations then result
only from the random or common causes.
2A ‘Process Capability’ Study (Are we capable?). It is never possible to
remove all random or common causes – some variations will remain. A
process capability study shows whether the remaining variations are
acceptable and whether the process will generate products or services
which match the specified requirements.
3 Process Control Using Charts (Do we continue to be in control?). The X and R
charts carry ‘control limits’ which form traffic light signals or decision rules
and give operators information about the process and its state of control.
Control charts are an essential tool of continuous improvement and great
improvements in quality can be gained if well-designed control charts are
used by those who operate processes. Badly designed control charts lead to
confusion and disillusionment amongst process operators and management.
They can impede the improvement process as process workers and
management rapidly lose faith in SPC techniques. Unfortunately, the author
and his colleagues have observed too many examples of this across a range of
industries, when SPC charting can rapidly degenerate into a paper or computer
exercise. A well-designed control chart can result only if the nature of the
process variation is thoroughly investigated.
In this chapter an attempt has been made to address the setting up of mean
and range control charts and procedures for designing the charts have been
outlined. For mean charts the standard error estimate
e
calculated directly
from the sample means, rather than the estimate based on R/d
n
, provides a
sound basis for designing charts that take account of complex patterns of
random variation as well as simpler short-term or inter-group random
variation. It is always sound practice to use pictorial evidence to test the
validity of summary statistics used.
Chapter highlights
᭹ Control charts are used to monitor processes which are in control, using
means (X ) and ranges (R).
᭹ There is a recommended method of collecting data for a process capability
study and prescribed layouts for X and R control charts which include
warning and action lines (limits). The control limits on the mean and range
charts are based on simple calculations from the data.
132 Process control using variables
᭹ Mean chart limits are derived using the process mean X, the mean range
R, and either A
2
constants or by calculating the standard error (SE) from
R. The range chart limits are derived from R and D
1
constants.
᭹ The interpretation of the plots are based on rules for action, warning and
trend signals. Mean and range charts are used together to control the
process.
᭹ A set of detailed rules is required to assess the stability of a process and
to establish the state of statistical control. The capability of the process can
be measured in terms of , and its spread compared with the specified
tolerances.
᭹ Mean and range charts may be used to monitor the performance of a
process. There are three zones on the charts which are associated with
rules for determining what action, if any, is to be taken.
᭹ There are various forms of the charts originally proposed by Shewhart.
These include charts without warning limits, which require slightly more
complex guidance in use.
᭹ Caulcutt and Porter’s procedure is recommended when short- and
medium-term random variation is suspected, in which case the standard
procedure leads to over-control of the process.
᭹ SPC for variables is in three stages:
1 Examination of the ‘state of control’ of the process using X and R
charts,
2 A process capability study, comparing spread with specifications,
3 Process control using the charts.
References
Bissell, A.F. (1991) ‘Getting more from Control Chart Data – Part 1’, Total Quality Management,
Vol. 2, No. 1, pp. 45–55.
Box, G.E.P., Hunter, W.G. and Hunter, J.S. (1978) Statistics for Experimenters, John Wiley &
Sons, New York, USA.
Caulcutt, R. (1995) ‘The Rights and Wrongs of Control Charts’, Applied Statistics, Vol. 44, No. 3,
pp. 279–88.
Caulcutt, R. and Coates, J. (1991) ‘Statistical Process Control with Chemical Batch Processes’,
Total Quality Management, Vol. 2, No. 2, pp. 191–200.
Caulcutt, R. and Porter, L.J. (1992) ‘Control Chart Design – A review of standard practice’,
Quality and Reliability Engineering International, Vol. 8, pp. 113–122.
Duncan, A.J. (1974) Quality Control and Industrial Statistics, 4th Edn, Richard D. Irwin IL,
USA.
Grant, E.L. and Leavenworth, R.W. (1996) Statistical Quality Control, 7th Edn, McGraw-Hill,
New York, USA.
Owen, M. (1993) SPC and Business Improvement, IFS Publications, Bedford, UK.
Pyzdek, T. (1990) Pyzdek’s Guide to SPC, Vol. 1 – Fundamentals, ASQC Quality Press,
Milwaukee WI, USA.
Process control using variables 133
Shewhart, W.A. (1931) Economic Control of Quality of Manufactured Product, Van Nostrand,
New York, USA.
Wheeler, D.J. and Chambers, D.S. (1992) Understanding Statistical Process Control, 2nd Edn,
SPC Press, Knoxville TN, USA.
Discussion questions
1 (a) Explain the principles of Shewhart control charts for sample mean and
sample range.
(b) State the Central Limit Theorem and explain its importance in
statistical process control.
2 A machine is operated so as to produce ball bearings having a mean
diameter of 0.55 cm and with a standard deviation of 0.01 cm. To
determine whether the machine is in proper working order a sample of six
ball bearings is taken every half-hour and the mean diameter of the six is
computed.
(a) Design a decision rule whereby one can be fairly certain that the ball
bearings constantly meet the requirements.
(b) Show how to represent the decision rule graphically.
(c) How could even better control of the process be maintained?
134 Process control using variables
3 The following are measures of the impurity, iron, in a fine chemical which
is to be used in pharmaceutical products. The data is given in parts per
million (ppm).
Sample X
1
X
2
X
3
X
4
X
5
1 15 11 8 15 6
2 14161114 7
31369510
4 15 15 9 15 7
5 9 12 9 8 8
6 11141112 5
713129610
810151246
9 8 12 14 9 10
10 10 10 9 14 14
11 13 16 12 15 18
12 7 10 9 11 16
13 11 7 16 10 14
14 11 7 10 10 7
15 13 9 12 13 17
16 17 10 11 9 8
17 4 14 5 11 11
18 8 9 6 13 9
19 9 10 7 10 13
20 15 10 10 12 16
Set up mean and range charts and comment on the possibility of using
them for future control of the iron content.
Process control using variables 135
4 You are responsible for a small plant which manufactures and packs
jollytots, a children’s sweet. The average contents of each packet should
be 35 sugar-coated balls of candy which melt in your mouth.
Every half-hour a random sample of five packets is taken, and the contents
counted. These figures are shown below:
Sample
Packet contents
12345
1 3336373836
2 3535323735
3 3138353638
4 3735363634
5 3435363637
6 3433383538
7 3436373534
8 3637353231
9 3434323436
10 34 35 37 34 32
11 34 34 35 36 32
12 35 35 41 38 35
13 36 36 37 31 34
14 35 35 32 32 39
15 35 35 34 34 34
16 33 33 35 35 34
17 34 40 36 32 37
18 33 35 33 34 40
19 34 33 37 34 34
20 37 32 34 35 34
Use the data to set up mean and range charts, and briefly outline their
usage.
136 Process control using variables
5 Plot the following data on mean and range charts and interpret the results.
The sample size is four and the specification is 60.0 ± 2.0.
Sample
number
Mean Range Sample
number
Mean Range
1 60.0 5 26 59.6 3
2 60.0 3 27 60.0 4
3 61.8 4 28 61.2 3
4 59.2 3 29 60.8 5
5 60.4 4 30 60.8 5
6 59.6 4 31 60.6 4
7 60.0 2 32 60.6 3
8 60.2 1 33 63.6 3
9 60.6 2 34 61.2 2
10 59.6 5 35 61.0 7
11 59.0 2 36 61.0 3
12 61.0 1 37 61.4 5
13 60.4 5 38 60.2 4
14 59.8 2 39 60.2 4
15 60.8 2 40 60.0 7
16 60.4 2 41 61.2 4
17 59.6 1 42 60.6 5
18 59.6 5 43 61.4 5
19 59.4 3 44 60.4 5
20 61.8 4 45 62.4 6
21 60.0 4 46 63.2 5
22 60.0 5 47 63.6 7
23 60.4 7 48 63.8 5
24 60.0 5 49 62.0 6
25 61.2 2 50 64.6 4
(See also Chapter 10, Discussion question 2)
Process control using variables 137
6 You are a Sales Representative of International Chemicals. Your manager
has received the following letter of complaint from Perplexed Plastics,
now one of your largest customers.
To: Sales Manager, International Chemicals
From: Senior Buyer, Perplexed Plastics
Subject: MFR Values of Polymax
We have been experiencing line feed problems recently which we suspect
are due to high MFR values on your Polymax. We believe about 30 per
cent of your product is out of specification.
As agreed in our telephone conversation, I have extracted from our records
some MFR values on approximately 60 recent lots. As you can see, the
values are generally on the high side. It is vital that you take urgent action to
reduce the MFR so that we can get our lines back to correct operating speed.
MFR Values
4.4 3.3 3.2 3.5 3.3 4.3
3.2 3.6 3.5 3.6 4.2 3.7
3.5 3.2 2.4 3.0 3.2 3.3
4.1 2.9 3.5 3.1 3.4 3.1
3.0 4.2 3.3 3.4 3.3
3.2 3.3 3.6 3.1 3.6
4.3 3.0 3.2 3.6 3.1
3.3 3.4 3.4 4.2 3.4
3.2 3.1 3.5 3.3 4.1
3.3 4.1 3.0 3.3 3.5
4.0 3.5 3.4 3.4 3.2
2.7 3.1 4.2 3.4 4.2
Specification 3.0 to 3.8g/10 min.
Subsequent to the letter, you have received a telephone call advising you
that they are now approaching a stock-out position. They are threatening
to terminate the contract and seek alternative supplies unless the problem
is solved quickly.
Do you agree that their complaint is justified?
Discuss what action you are going to take.
(See also Chapter 10, Discussion question 3)
138 Process control using variables
7 You are a trader in foreign currencies. The spot exchange rates of all
currencies are available to you at all times. The following data for one
currency were collected at intervals of one minute for a total period of 100
minutes, five consecutive results are shown as one sample.
Sample Spot exchange rates
1 1333 1336 1337 1338 1339
2 1335 1335 1332 1337 1335
3 1331 1338 1335 1336 1338
4 1337 1335 1336 1336 1334
5 1334 1335 1336 1336 1337
6 1334 1333 1338 1335 1338
7 1334 1336 1337 1335 1334
8 1336 1337 1335 1332 1331
9 1334 1334 1332 1334 1336
10 1334 1335 1337 1334 1332
11 1334 1334 1335 1336 1332
12 1335 1335 1341 1338 1335
13 1336 1336 1337 1331 1334
14 1335 1335 1332 1332 1339
15 1335 1335 1334 1334 1334
16 1333 1333 1335 1335 1334
17 1334 1340 1336 1338 1342
18 1338 1336 1337 1337 1337
19 1335 1339 1341 1338 1338
20 1339 1340 1342 1339 1339
Use the data to set up mean and range charts; interpret the charts, and
discuss the use which could be made of this form of presentation of the
data.
Process control using variables 139
8 The following data were obtained when measurements of the zinc
concentration (measured as percentage of zinc sulphate on sodium
sulphate) were made in a viscose rayon spin-bath. The mean and range
values of 20 samples of size 5 are given in the table.
Sample Zn conc.
%
Range
%
Sample Zn conc.
%
Range
%
1 6.97 0.38 11 7.05 0.23
2 6.93 0.20 12 6.92 0.21
3 7.02 0.36 13 7.00 0.28
4 6.93 0.31 14 6.99 0.20
5 6.94 0.28 15 7.08 0.16
6 7.04 0.20 16 7.04 0.17
7 7.03 0.38 17 6.97 0.25
8 7.04 0.25 18 7.00 0.23
9 7.01 0.18 19 7.07 0.19
10 6.99 0.29 20 6.96 0.25
If the data are to be used to initiate mean and range charts for controlling
the process, determine the action and warning lines for the charts. What
would your reaction be to the development chemist setting a tolerance of
7.00 ± 0.25 per cent on the zinc concentration in the spin-bath?
(See also Chapter 10, Discussion question 4)
140 Process control using variables
9 Conventional control charts are to be used on a process manufacturing
small components with a specified length of 60 mm ± 1.5 mm. Two
identical machines are involved in making the components and process
capability studies carried out on them reveal the following data:
Sample size, n =5
Sample
number
Machine I
Mean Range
Machine II
Mean Range
1 60.10 2.5 60.86 0.5
2 59.92 2.2 59.10 0.4
3 60.37 3.0 60.32 0.6
4 59.91 2.2 60.05 0.2
5 60.01 2.4 58.95 0.3
6 60.18 2.7 59.12 0.7
7 59.67 1.7 58.80 0.5
8 60.57 3.4 59.68 0.4
9 59.68 1.7 60.14 0.6
10 59.55 1.5 60.96 0.3
11 59.98 2.3 61.05 0.2
12 60.22 2.7 60.84 0.2
13 60.54 3.3 61.01 0.5
14 60.68 3.6 60.82 0.4
15 59.24 0.9 59.14 0.6
16 59.48 1.4 59.01 0.5
17 60.20 2.7 59.08 0.1
18 60.27 2.8 59.25 0.2
19 59.57 1.5 61.50 0.3
20 60.49 3.2 61.42 0.4
Calculate the control limits to be used on a mean and range chart for each
machine and give the reasons for any differences between them. Compare
the results from each machine with the appropriate control chart limits and
the specification tolerances.
(See also Chapter 10, Discussion question 5)
Process control using variables 141
10 The following table gives the average width in millimetres for each of
twenty samples of five panels used in the manufacture of a domestic
appliance. The range of each sample is also given.
Sample
number
Mean Range Sample
number
Mean Range
1 550.8 4.2 11 553.1 3.8
2 552.7 4.2 12 551.7 3.1
3 553.8 6.7 13 561.2 3.5
4 555.8 4.7 14 554.2 3.4
5 553.8 3.2 15 552.3 5.8
6 547.5 5.8 16 552.9 1.6
7 550.9 0.7 17 562.9 2.7
8 552.0 5.9 18 559.4 5.4
9 553.7 9.5 19 555.8 1.7
10 557.3 1.9 20 547.6 6.7
Calculate the control chart limits for the Shewhart charts and plot the
values on the charts. Interpret the results. Given a specification of 540 mm
± 5 mm, comment on the capability of the process.
(See also Chapter 9, Discussion question 4 and Chapter 10, Discussion
question 6)
Worked examples
1 Lathe operation
A component used as a part of a power transmission unit is manufactured
using a lathe. Twenty samples, each of five components, are taken at half-
hourly intervals. For the most critical dimension, the process mean (X ) is
found to be 3.500 cm, with a normal distribution of the results about the mean,
and a mean sample range (R) of 0.0007 cm.
(a) Use this information to set up suitable control charts.
(b) If the specified tolerance is 3.498 cm to 3.502 cm, what is your reaction?
Would you consider any action necessary?
(See also Chapter 10, Worked example 1)
142 Process control using variables
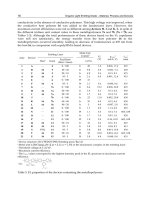
(c) The following table shows the operator’s results over the day. The
measurements were taken using a comparitor set to 3.500 cm and are
shown in units of 0.001 cm. The means and ranges have been added to the
results. What is your interpretation of these results? Do you have any
comments on the process and/or the operator?
Record of results recorded from the lathe operation
Time 1 2 3 4 6 Mean Range
7.30 0.2 0.5 0.4 0.3 0.2 0.32 0.3
7.35 0.2 0.1 0.3 0.2 0.2 0.20 0.2
8.00 0.2 –0.2 –0.3 –0.1 0.1 –0.06 0.5
8.30 –0.2 0.3 0.4 –0.2 –0.2 0.02 0.6
9.00 –0.3 0.1 –0.4 –0.6 –0.1 –0.26 0.7
9.05 –0.1 –0.5 –0.5 –0.2 –0.5 –0.36 0.4
Machine stopped tool clamp readjusted
10.30 –0.2 –0.2 0.4 –0.6 –0.2 –0.16 1.0
11.00 0.6 0.2 –0.2 0.0 0.1 0.14 0.8
11.30 0.4 0.1 –0.2 0.5 0.3 0.22 0.7
12.00 0.3 –0.1 –0.3 0.2 0.0 0.02 0.6
Lunch
12.45 –0.5 –0.1 0.6 0.2 0.3 0.10 1.1
13.15 0.3 0.4 –0.1 –0.2 0.0 0.08 0.6
Reset tool by 0
·
15 cm
13.20 –0.6 0.2 –0.2 0.1 –0.2 –0.14 0.8
13.50 0.4 –0.1 –0.5 –0.1 –0.2 –0.10 0.9
14.20 0.0 –0.3 0.2 0.2 0.4 0.10 0.7
14
·
35 Batch finished – machine reset
16.15 1.3 1.7 2.1 1.4 1.6 1.62 0.8
Solution
(a) Since the distribution is known and the process is in statistical control
with:
Process control using variables 143
Process mean X = 3.5000 cm
Mean sample range R = 0.0007 cm
Sample size n =5.
Mean chart
From Appendix B for n = 5, A
2
= 0.58 and 2/3 A
2
= 0.39
Mean control chart is set up with:
Upper action limit X + A
2
R = 3.50041 cm
Upper warning limit X + 2/3 A
2
R = 3.50027 cm
Mean X = 3.50000 cm
Lower warning limit X – 2/3 A
2
R = 3.49973 cm
Lower action limit X – A
2
R = 3.49959 cm.
Range chart
From Appendix C DЈ
.999
= 0.16 DЈ
.975
= 0.37
DЈ
.025
= 1.81 DЈ
.001
= 2.34
Range control chart is set up with:
Upper action limit DЈ
.001
R = 0.0016 cm
Upper warning limit DЈ
.025
R = 0.0013 cm
Lower warning limit DЈ
.975
R = 0.0003 cm
Lower action limit DЈ
.999
R = 0.0001 cm.
(b) The process is correctly centred so:
From Appendix B d
n
= 2.326
= R/d
n
= 0.0007/2.326 = 0.0003 cm.
The process is in statistical control and capable. If mean and range charts
are used for its control, significant changes should be detected by the first
sample taken after the change. No further immediate action is suggested.
(c) The means and ranges of the results are given in the table above and are
plotted on control charts in Figure 6.14.
144 Process control using variables
Observations on the control charts
1 The 7.30 sample required a repeat sample to be taken to check the mean.
The repeat sample at 7.35 showed that no adjustment was necessary.
2 The 9.00 sample mean was within the warning limits but was the fifth result
in a downwards trend. The operator correctly decided to take a repeat
sample. The 9.05 mean result constituted a double warning since it
remained in the downward trend and also fell in the warning zone.
Adjustment of the mean was, therefore, justified.
3 The mean of the 13.15 sample was the fifth in a series above the mean and
should have signalled the need for a repeat sample and not an adjustment.
The adjustment, however, did not adversely affect control.
4 The whole of the batch completed at 14.35 was within specification and
suitable for despatch.
5 At 16.15 the machine was incorrectly reset.
Figure 6.14 Control charts for lathe operation
Process control using variables 145
General conclusions
There was a downward drift of the process mean during the manufacture of this
batch. The drift was limited to the early period and appears to have stopped
following the adjustment at 9.05. The special cause should be investigated.
The range remained in control throughout the whole period when it averaged
0.0007 cm, as in the original process capability study.
The operator’s actions were correct on all but one occasion (the reset at
13.15); a good operator who may need a little more training, guidance or
experience.
2 Control of dissolved iron in a dyestuff
Mean and range charts are to be used to maintain control on dissolved iron
content of a dyestuff formulation in parts per million (ppm). After 25
subgroups of 5 measurements have been obtained.
∑
i=25
i=1
X
i
= 390 and ∑
i=25
i=1
R
i
=84
where X
i
= mean of ith subgroup
R
i
= range of ith subgroup
(a) Design the appropriate control charts.
(b) The specification on the process requires that no more than 18 ppm
dissolved iron be present in the formulation. Assuming a normal
distribution and that the process continues to be in statistical control with
no change in average or dispersion, what proportion of the individual
measurements may be expected to exceed this specification?
(See also Chapter 9, Discussion question 5, and Chapter 10, Worked
example 2)
Solution
(a) Control charts
Grand Mean, X =
⌺X
i
k
=
390
25
= 15.6 ppm
k = No. of samples = 25
Mean Range, R =
⌺R
i
k
=
84
25
= 3.36 ppm
=
R
d
n
=
3.36
2.326
= 1.445 ppm
146 Process control using variables
(d
n
from Appendix B = 2.326, n =5)
SE =
ͱස
n
=
1.445
ͱස
5
= 0.646 ppm.
Mean chart
Action Lines = X ± (3 ϫ SE)
15.6 ± (3 ϫ 0.646)
= 13.7 and 17.5 ppm
Warning Lines = 15.6 ± (2 ϫ 0.646)
= 14.3 and 16.9 ppm.
Range chart
Upper Action Line = DЈ
.001
R = 2.34 ϫ 3.36 = 7.9 ppm
Upper Warning Line = DЈ
.025
R = 1.81 ϫ 3.36 = 6.1 ppm.
Alternative calculations of Mean Chart Control Lines
Action Lines = X ± A
2
R
= 15.6 ± (0.58 ϫ 3.36)
Warning Lines = X + 2/3A
2
R
= 15.6 ± (0.39 ϫ 3.36)
A
2
and 2/3 A
2
from Appendix B.
(b) Specification
Zu =
U – X
=
18.0 – 15.6
1.445
= 1.66.
From normal tables (Appendix A), proportion outside upper tolerance =
0.0485 or 4.85 per cent.
3 Pin manufacture
Samples are being taken from a pin manufacturing process every 15–20
minutes. The production rate is 350–400 per hour, and the specification limits
Process control using variables 147
on length are 0.820 and 0.840 cm. After 20 samples of 5 pins, the following
information is available:
Sum of the sample means, ∑
i=20
i=1
X
i
= 16.68 cm
Sum of the sample ranges, ∑
i=20
i=1
R
i
= 0.14 cm
Where X and R
i
are the mean and range of the ith sample respectively:
(a) Set up mean and range charts to control the lengths of pins produced in the
future.
(b) On the assumption that the pin lengths are normally distributed, what
percentage of the pins would you estimate to have lengths outside the
specification limits when the process is under control at the levels
indicated by the data given?
(c) What would happen to the percentage defective pins if the process
average should change to 0.837 cm?
(d) What is the probability that you could observe the change in (c) on your
control chart on the first sample following the change?
(See also Chapter 10, Worked example 3)
Solution
(a) ∑
i=20
i=1
X
i
= 16.88 cm, k = No. of samples = 20
Grand Mean, X = ∑ X
i
/k =
16.88
20
= 0.834 cm
Mean Range, R = ∑ R
i
/k =
0.14
20
= 0.007 cm
Mean chart
Action Lines at X ± A
2
R = 0.834 ± (0.594 ϫ 0.007)
Upper Action Line = 0.838 cm
Lower Action Line = 0.830 cm.
Warning Lines at X ± 2/3 A
2
R = 0.834 ± (0.377 ϫ 0.007)
Upper Warning Line = 0.837 cm
Lower Warning Line = 0.831 cm.
The A
2
and 2/3 constants are obtained from Appendix B.
148 Process control using variables
Range chart
Upper Action Line at DЈ
.001
R = 2.34 ϫ 0.007 = 0.0164 cm
Upper Warning Line at DЈ
.025
R = 1.81 ϫ 0.007 = 0.0127 cm.
The DЈ constants are obtained from Appendix C.
(b) =
R
d
n
=
0.007
2.326
= 0.003 cm.
Upper tolerance
Zu =
(U – X )
=
(0.84 – 0.834)
0.003
=2.
Therefore percentage outside upper tolerance = 2.275 per cent (from
Appendix A).
Lower tolerance
Z
l
=
(X – L)
=
0.834 – 0.82
0.003
= 4.67.
Therefore percentage outside lower tolerance = 0
Total outside both tolerances = 2.275 per cent
(c) Zu =
0.84 – 0.837
0.003
=1.
Therefore percentage outside upper tolerance will increase to 15.87 per
cent (from Appendix A).
(d) SE = /
ͱ
ස
n =
0.003
ͱස
5
= 0.0013.
Upper Warning Line (UWL)
As µ = UWL, the probability of sample point being outside UWL = 0.5
(50 per cent).
Upper Action Line (UAL)
Z
UAL
=
0.838 – 0.837
0.0013
= 0.769.
Therefore from tables, probability of sample point being outside UAL =
0.2206.
Process control using variables 149
Thus, the probability of observing the change to µ = 0.837 cm on the first
sample after the change is:
0.50 – outside warning line (50 per cent or 1 in 2)
0.2206 – outside action line (22.1 per cent or ca. 1 in 4.5).
4 Bale weight
(a) Using the bale weight data below, calculate the control limits for the mean
and range charts to be used with these data.
(b) Using these control limits, plot the mean and range values onto the
charts.
(c) Comment on the results obtained.
Bale weight data record (kg)
Sample
number
Time 1 2 3 4 Mean
X
Range
W
1 10.18 34.07 33.99 33.99 34.12 34.04 0.13
2 10.03 33.98 34.08 34.10 33.99 34.04 0.12
3 10.06 34.19 34.21 34.00 34.00 34.15 0.21
4 10.09 33.79 34.01 33.77 33.82 33.85 0.24
5 10.12 33.92 33.98 33.70 33.74 33.84 0.28
6 10.15 34.01 33.98 34.20 34.13 34.08 0.22
7 10.18 34.07 34.30 33.80 34.10 34.07 0.50
8 10.21 33.87 33.96 34.04 34.05 33.98 0.18
9 10.24 34.02 33.92 34.05 34.18 34.04 0.26
10 10.27 33.67 33.96 34.04 34.31 34.00 0.64
11 10.30 34.09 33.96 33.93 34.11 34.02 0.18
12 10.33 34.31 34.23 34.18 34.21 34.23 0.13
13 10.36 34.01 34.09 33.91 34.12 34.03 0.21
14 10.39 33.76 33.98 34.06 33.89 33.92 0.30
15 10.42 33.91 33.90 34.10 34.03 33.99 0.20
16 10.45 33.85 34.00 33.90 33.85 33.90 0.15
17 10.48 33.94 33.76 33.82 33.87 33.85 0.18
18 10.51 33.69 34.01 33.71 33.84 33.81 0.32
19 10.54 34.07 34.11 34.06 34.08 34.08 0.05
20 10.57 34.14 34.15 33.99 34.07 34.09 0.16
TOTAL 680.00 4.66
150 Process control using variables
Solution
(a) X = Grand (Process) Mean =
Total of the means (X )
Number of samples
=
680.00
20
= 34.00 kg.
R = Mean Range =
Total of the ranges (R )
Number of samples
=
4.66
20
= 0.233 kg.
= R/d
n
for sample size n = 4, d
n
= 2.059
= 0.233/2.059 = 0.113
Standard Error (SE) = /
ͱස
n = 0.113 /
ͱස
4 = 0.057.
Mean chart
Action Lines = X ± 3/
ͱස
n
= 34.00 ± 3 ϫ 0.057
= 34.00 ± 0.17
Upper Action Line = 34.17 kg
Lower Action Line = 33.83 kg.
Warning Lines = X ± 2/
ͱස
n
= 34.00 ± 2 ϫ 0.057
= 34.00 ± 0.11.
Upper Warning Line = 34.11 kg
Lower Warning Line = 33.89 kg.
The mean of the chart is set by the specification or target mean.
Range chart
Action Line = 2.57 R = 2.57 ϫ 0.233 = 0.599 kg
Warning Line = 1.93 R = 1.93 ϫ 0.233 = 0.450 kg.
(b) The data are plotted in Figure 6.15.
(c) Comments on the mean and range charts.
The table on page 152 shows the actions that could have been taken
had the charts been available during the production period.
Process control using variables 151
Figure 6.15 Bale weight data (kg)