Statistical Process Control 5 Part 10 ppsx
Bạn đang xem bản rút gọn của tài liệu. Xem và tải ngay bản đầy đủ của tài liệu tại đây (242.53 KB, 35 trang )
302 Process problem solving and improvement
᭹ Steps in constructing a cause and effect diagram include identifying the
effect, establishing the goals, constructing a framework, recording all
suggested causes, incubating the ideas prior to a more structured analysis
leading to plans for action.
᭹ A variation on the technique is the cause and effect diagram with addition
of cards (CEDAC). Here the effect side of the diagram is quantified, with
an improvement target, and the causes show facts and improvement
ideas.
᭹ Scatter diagrams are simple tools used to show the relationship between
two factors – the independent (controlling) and the dependent (con-
trolled). Choice of the factors and appropriate data recording are vital
steps in their use.
᭹ Stratification is a sample selection method used when populations are
comprised of different characteristics. It involves collecting or dividing
data into meaningful groups. It may be used in conjunction with other
techniques to present differences between such groups.
᭹ The principles and techniques of problem solving and improvement may
be applied to any human activity regarded as a process. Where barriers to
the use of these, perhaps in non-manufacturing areas, are found, training
in the basic approach of process data collection, analysis and improve-
ment action may be required.
References
Ishikawa, K. (1986) Guide to Quality Control, Asian Productivity Association, Tokyo, Japan.
Lockyer, K.G., Muhlemann, A.P. and Oakland, J.S. (1992) Production and Operations
Management, 6th Edn, Pitman, London, UK.
Oakland, J.S. (2000) Total Quality Management – text and cases, 2nd Edn, Butterworth-
Heinemann, Oxford, UK.
Pyzdek, T. (1990) Pyzdek’s Guide to SPC – Vol. One – Fundamentals, ASQC Quality Press,
Milwaukee WI, USA.
Sygiyama, T. (1989) The Improvement Book – creating the problem-free workplace, Productivity
Press, Cambridge MA, USA.
Process problem solving and improvement 303
Discussion questions
1 You are the Production Manager of a small engineering company and have
just received the following memo:
MEMORANDUM
To: Production Manager
From: Sales Manager
Subject: Order Number 2937/AZ
Joe Brown worked hard to get this order for us to manufacture 10 000 widgets
for PQR Ltd. He now tells me that they are about to return the first batch of
1000 because many will not fit into the valve assembly that they tell us they are
intended for. I must insist that you give rectification of this faulty batch number
one priority, and that you make sure that this does not recur. As you know PQR
Ltd are a new customer, and they could put a lot of work our way.
Incidentally I have heard that you have been sending a number of your
operators on a training course in the use of the microbang widget gauge for
use with that new machine of yours. I cannot help thinking that you should
have spent the money on employing more finished product inspectors, rather
than on training courses and high technology testing equipment.
(a) Outline how you intend to investigate the causes of the ‘faulty’
widgets.
(b) Discuss the final paragraph in the memo.
2 You have inherited, unexpectedly, a small engineering business which is
both profitable and enjoys a full order book. You wish to be personally
involved in this activity where the only area of immediate concern is the
high levels of scrap and rework – costing together a sum equivalent to about
15 per cent of the company’s total sales.
Discuss your method of progressively picking up, analysing and solving
this problem over a target period of 12 months. Illustrate any of the
techniques you discuss.
3 Discuss in detail the applications of Pareto analysis and cause and effect
analysis as aids in solving operations management problems. Give at least
two illustrations.
You are responsible for a biscuit production plant, and are concerned
about the output from the lines which make chocolate wholemeal biscuits.
Output is consistently significantly below target. You suspect that this is
because the lines are frequently stopped, so you initiate an in-depth
investigation over a typical two-week period. The table below shows the
causes of the stoppages, number of occasions on which each occurred, and
the average amount of output lost on each occasion.
304 Process problem solving and improvement
Cause No. of
occurrences
Lost production
(00s biscuits)
WRAPPING:
cellophane wrap breakage 1031 3
cartonner failure 85 100
ENROBER:
chocolate too thin 102 1
chocolate too thick 92 3
PREPARATION:
underweight biscuits 70 25
overweight biscuits 21 25
biscuits mis-shapen 58 1
OVENS:
biscuits overcooked 87 2
biscuits undercooked 513 1
Use this data and the appropriate techniques to indicate where to
concentrate remedial action.
How could stratification aid the analysis in this particular case?
4 A company manufactures a range of domestic electrical appliances.
Particular concern is being expressed about the warranty claims on one
particular product. The customer service department provides the following
data relating the claims to the unit/component part of the product which
caused the claim:
Unit/component
part
Number of
claims
Average cost of warranty
work (per claim)
Drum 110 48.1
Casing 12 842 1.2
Work-top 142 2.7
Pump 246 8.9
Electric motor 798 48.9
Heater unit 621 15.6
Door lock mechanism 18 442 0.8
Stabilizer 692 2.9
Powder additive unit 7 562 1.2
Electric control unit 652 51.9
Switching mechanism 4 120 10.2
Process problem solving and improvement 305
Discuss what criteria are of importance in identifying those unit/component
parts to examine initially. Carry out a full analysis of the data to identify
such unit/component parts.
5 The principal causes of accidents, their percentage of occurrence, and the
estimated resulting loss of production per annum in the UK is given in the
table below:
Accident cause Percentage of
all accidents
Estimated loss
of production
(£million/annum)
Machinery 16 190
Transport 8 30
Falls from heights >6′ 16 100
Tripping 3 10
Striking against objects 9 7
Falling objects 7 20
Handling goods 27 310
Hand tools 7 65
Burns (including chemical) 5 15
Unspecified 2 3
(a) Using the appropriate data draw a Pareto curve and suggest how this
may be used most effectively to tackle the problems of accident
prevention. How could stratification help in the analysis?
(b) Give three other uses of this type of analysis in non-manufacturing and
explain briefly, in each case, how use of the technique aids improvement.
6 The manufacturer of domestic electrical appliances has been examining
causes of warranty claims. Ten have been identified and the annual cost of
warranty work resulting from these is as follows:
Cause Annual cost of warranty work (£)
A
B
C
D
E
F
G
H
I
J
1 090
2 130
30 690
620
5 930
970
49 980
1 060
4 980
3 020
306 Process problem solving and improvement
Carry out a Pareto analysis on the above data, and describe how the main
causes could be investigated.
7 A mortgage company finds that some 18 per cent of application forms
received from customers cannot be processed immediately, owing to the
absence of some of the information. A sample of 500 incomplete
application forms reveals the following data:
Information missing Frequency
Applicant’s Age 92
Daytime telephone number 22
Forenames 39
House owner/occupier 6
Home telephone number 1
Income 50
Signature 6
Occupation 15
Bank Account no. 1
Nature of account 10
Postal code 6
Sorting code 85
Credit Limit requested 21
Cards existing 5
Date of application 3
Preferred method of payment 42
Others 46
Determine the major causes of missing information, and suggest appro-
priate techniques to use in form redesign to reduce the incidence of missing
information.
8 A company which operates with a four-week accounting period is
experiencing difficulties in keeping up with the preparation and issue of
sales invoices during the last week of the accounting period. Data collected
over two accounting periods are as follows:
Accounting Period 4 Week 1 2 3 4
Number of sales invoices issued 110 272 241 495
Accounting Period 5 Week 1 2 3 4
Number of sales invoices issued 232 207 315 270
Examine any correlation between the week within the period and the
demands placed on the invoice department. How would you initiate action
to improve this situation?
Process problem solving and improvement 307
Worked examples
1 Reactor Mooney off-spec results
A project team looking at improving reactor Mooney control (a measure of
viscosity) made a study over 14 production dates of results falling ±5 ML
Points outside the grade aim. Details of the causes were listed (Table 11.6).
Table 11.6 Reactor Mooney off-spec results over 14 production days
Sample Cause Sample Cause
1 Cat. poison 41 Instrument/analyser
2 Cat. poison 42 H.C.L. control
3 Reactor stick 43 H.C.L. control
4 Cat. poison 44 Feed poison
5 Reactor stick 45 Feed poison
6 Cat. poison 46 Feed poison
7 H.C.L. control 47 Feed poison
8 H.C.L. control 48 Reactor stick
9 H.C.L. control 49 Reactor stick
10 H.C.L. control 50 H.C.L. control
11 Reactor stick 51 H.C.L. control
12 Reactor stick 52 H.C.L. control
13 Feed poison 53 H.C.L. control
14 Feed poison 54 Reactor stick
15 Reactor stick 55 Reactor stick
16 Reactor stick 56 Feed poison
17 Reactor stick 57 Feed poison
18 Reactor stick 58 Feed poison
19 H.C.L. control 59 Feed poison
20 H.C.L. control 60 Refridge problems
21 Dirty reactor 61 Reactor stick
22 Dirty reactor 62 Reactor stick
23 Dirty reactor 63 Reactor stick
24 Reactor stick 64 Reactor stick
25 Reactor stick 65 Lab result
26 Over correction F.109 66 H.C.L. control
27 Reactor stick 67 H.C.L. control
28 Reactor stick 68 H.C.L. control
29 Instrument/analyser 69 H.C.L. control
30 H.C.L. control 70 H.C.L. control
31 H.C.L. control 71 Reactor stick
32 H.C.L. control 72 Reactor stick
33 H.C.L. control 73 Reactor stick
34 H.C.L. control 74 Reactor stick
35 Reactor stick 75 B. No. control
36 Reactor stick 76 B. No. control
37 Reactor stick 77 H.C.L. control
38 Reactor stick 78 H.C.L. control
39 Reactor stick 79 Reactor stick
40 Reactor stick 80 Reactor stick
Table 11.7 Reactor Mooney off-spec results over 14 production dates: Pareto analysis of reasons
Reasons for Mooney off-spec Tally Frequency % of total Cum %
Reactor sticks | | | | | | | | | | | | | | | | | | | | | | | | | | 32 40 40
H.C.L. control
| | | | | | | | | | | | | | | | | | | | 24 30 70
Feed poisons
| | | | | | | | 10 12.5 82.5
Cat. poisons | | | | 4 5 87.5
Dirty stick reactor | | | 3 3.75 91.25
B. No. control | | 2 2.5 93.75
Instruments/analysers | | 2 2.5 96.25
Over-correction F.109 | 1 1.25 97.5
Refridge problems | 1 1.25 98.75
Lab results | 1 1.25 100
Process problem solving and improvement 309
Using a ranking method – Pareto analysis – the team were able to determine
the major areas on which to concentrate their efforts.
Steps in the analysis were as follows:
1 Collect data over 14 production days and tabulate (Table 11.6).
2 Calculate the totals of each cause and determine the order of frequency (i.e.
which cause occurs most often).
3 Draw up a table in order of frequency of occurrence (Table 11.7).
4 Calculate the percentage of the total off-spec that each cause is responsible
for.
e.g. Percentage due to reactor sticks =
32
80
ϫ 100 = 40 per cent.
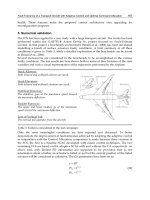
Figure 11.14 Pareto analysis: reasons for off-spec reactor Mooney
310 Process problem solving and improvement
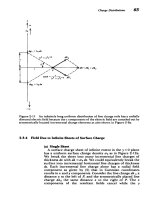
Figure 11.15 Income rank/contribution rank chart
5 Cumulate the frequency percentages.
6 Plot a Pareto graph showing the percentage due to each cause and the
cumulative percentage frequency of the causes from Table 11.7 (Figure
11.14).
2 Ranking in managing product range
Some figures were produced by a small chemical company concerning the
company’s products, their total volume ($), and direct costs. These are given
in Table 11.8. The products were ranked in order of income and contribution
for the purpose of Pareto analysis, and the results are given in Table 11.9. To
consider either income or contribution in the absence of the other could lead
to incorrect conclusions; for example, Product 013 which is ranked 9th in
income actually makes zero contribution.
One way of handling this type of ranked data is to plot an income–
contribution rank chart. In this the abscissae are the income ranks, and the
Process problem solving and improvement 311
Table 11.9 Income rank/contribution rank table
Code
number
Description Income
rank
Contribution
rank
001 Captine 20 20
002 BHD-DDB 10 10
003 DDB-Sulphur 11 8
004 Nicotine-Phos 5 4
005 Fensome 17 17
006 Aldrone 3 2
007 DDB 19 18
008 Dimox 18 16
009 DNT 1 1
010 Parathone 2 7
011 HETB 15 15
012 Mepofox 14 11
013 Derros-Pyrethene 9 19
014 Dinosab 7 3
015 Maleic Hydrazone 16 12
016 Thirene-BHD 4 5
017 Dinosin 6 9
018 2,4-P 8 6
019 Phosphone 13 13
020 Chloropicrene 12 14
Table 11.8 Some products and their total volume, direct costs and contribution
Code
number
Description Total
volume
($)
Total
direct
costs
($)
Total
contribution
($)
001 Captine 1 040 1 066 26
002 BHD-DDB 16 240 5 075 11 165
003 DDB-Sulphur 16 000 224 15 776
004 Nicotine-Phos 42500 19 550 22 950
005 Fensome 8 800 4 800 4 000
006 Aldrone 106821 45 642 61179
007 DDB 2600 1 456 1 144
008 Dimox 6 400 904 5 496
009 DNT 288 900 123 264 165 636
010 Parathone 113 400 95 410 17 990
011 HETB 11 700 6 200 5 500
012 Mepofox 12 000 2 580 9 420
013 Derros-Pyrethene 20 800 20 800 0
014 Dinosab 37 500 9 500 28 000
015 Maleic Hydrazone 11 300 2 486 8 814
016 Thirene-BHD 63,945 44 406 19 539
017 Dinosin 38 800 25 463 13 337
018 2,4-P 23 650 4 300 19 350
019 Phosphone 13 467 6 030 7 437
020 Chloropicrene 14400 7 200 7 200
312 Process problem solving and improvement
ordinates are the contribution ranks. Thus product 010 has an income rank of
2 and a contribution rank of 7. Hence, product 010 is represented by the point
(2,7) in Figure 11.15, on which all the points have been plotted in this way.
3 Process capability in a bank
The process capability indices calculations in Chapter 10 showed that the
process was not capable of meeting the requirements and management led an
effort to improve transaction efficiency. This began with a flowcharting of the
process as shown in Figure 11.16. In addition, a brainstorm session involving
the cashiers was used to generate the cause and effect diagram of Figure
11.17. A quality improvement team was formed, further data collected, and
the ‘vital’ areas of incompletely understood procedures and cashier training
were tackled. This resulted over a period of six months, in a reduction in
average transaction time and improvement in process capability.
Process problem solving and improvement 313
Figure 11.16 Flowchart for bank transactions
Figure 11.17 Cause and effect diagram for slow transaction times
12 Managing out-of-control
processes
Objectives
᭹ To consider the most suitable approach to process trouble-shooting.
᭹ To outline a strategy for process improvement.
᭹ To examine the use of control charts for trouble-shooting and classify out-
of-control processes.
᭹ To consider some causes of out-of-control processes.
12.1 Introduction
Historically, the responsibility for trouble-shooting and process improve-
ment, particularly within a manufacturing organization, has rested with a
‘technology’ department. In recent times, however, these tasks have been
carried out increasingly by people who are directly associated with the
operation of the process on a day-to-day basis. What is quite clear is
that process improvement and trouble-shooting should not become the
domain of only research or technology people. In the service sector it very
rarely is.
In a manufacturing company, for example, the production people have the
responsibility for meeting production targets, which include those associated
with the quality of the product. It is unreasonable for them to accept
responsibility for process output, efficiency, and cost while delegating
elsewhere responsibility for the quality of its output. If problems of low
quantity arise during production, whether it be the number of tablets
produced per day or the amount of herbicide obtained from a batch reactor,
then these problems are tackled without question by production personnel.
Why then should problems of – say – excessive process variation not fall
under the same umbrella?
Problems in process operations are rarely single-dimensional. They have at
least four dimensions:
316 Managing out-of-control processes
᭹ product or service, including inputs;
᭹ plant, including equipment;
᭹ programmes (timetables-schedules);
᭹ people, including information.
The indiscriminate involvement of research/technology people in trouble-
shooting tends to polarize attention towards the technical aspects, with the
corresponding relegation of other vital parameters. In many cases the human,
managerial, and even financial dimensions have a significant bearing on the
overall problem and its solution. They should not be ignored by taking a
problem out of its natural environment and placing it in a ‘laboratory’.
The emphasis of any ‘trouble-shooting’ effort should be directed towards
problem prevention with priorities in the areas of:
(i) maintaining quality of current output;
(ii) process improvement;
(iii) product development.
Quality assurance, for example, must not be a department to be ignored when
everything is running well, yet saddled with the responsibility for solving
quality problems when they arise. Associated with this practice are the
dangers of such people being used as scapegoats when explanations to senior
managers are required, or being offered as sacrificial lambs when customer
complaints are being dealt with. The responsibility for quality must always lie
with operators of the process and the role of QA or any other support function
is clearly to assist in the meeting of this responsibility. It should not be
acceptable for any group within an organization to approach another group
with the question, ‘We have got a problem, what are you going to do about it?’
Expert advice may, of course, frequently be necessary to tackle particular
process problems.
Having described Utopia, we must accept that the real world is inevitably
less than perfect. The major problem is the one of whether a process has the
necessary capabilities required to meet the requirements. It is against this
background that the methods in this chapter are presented.
12.2 Process improvement strategy
Process improvement is neither a pure science nor an art. Procedures may be
presented but these will nearly always benefit from ingenuity. It is traditional
to study cause and effect relationships. However, when faced with a
Managing out-of-control processes 317
multiplicity of potential causes of problems, all of which involve imperfect
data, it is frequently advantageous to begin with studies which identify only
blocks or groups as the source of the trouble. The groups may, for example,
be a complete filling line or a whole area of a service operation. Thus, the
pinpointing of specific causes and effects is postponed.
An important principle to be emphasized at the outset is that initial studies
should not aim to discover everything straight away. This is particularly
important in situations where more data is obtainable quite easily.
It is impossible to set down everything which should be observed in
carrying out a process improvement exercise. One of the most important rules
to observe is to be present when data are being collected, at least initially. This
provides the opportunity to observe possible sources of error in the acquisition
of data. It may be found that improvements are necessary in the data collection
method or the type of measuring equipment itself. Direct observation of data
collection may also suggest assignable causes which may be examined at the
time. This includes the different effects due to equipment changes, various
suppliers, shifts, people skills, etc.
In trouble-shooting and process improvement studies, the planning of data
acquisition programmes should assist in detecting the effects of important
changes. The opportunity to note possible relationships comes much more
readily to the investigator who observes the data collection than the one who
sits comfortably in an office chair. The further away the observer is located
from the action, the less the information (s)he obtains and the greater the
doubt about the value of the information.
Effective methods of planning process investigations have been developed
over the past quarter of a century. Many of these began in the chemical,
electrical and mechanical engineering industries. The principles and practices
are, however, universally applicable. Generally two approaches are available,
as discussed in the next two subsections.
Effects of single factors
The effects of many single variables (e.g. temperature, voltage, time, speed,
concentration) may have been shown to have been important in other,
similar studies. The procedure of altering one variable at a time is often
successful, particularly in well-equipped ‘laboratories’ and pilot plants.
Frequently, however, the factors which are expected to allow predictions
about a new process are found to be grossly inadequate. This is especially
common when a process is transferred from the laboratory or pilot plant to
full-scale operation. Predicted results may be obtained on some occasions
but not on others, even though no known changes have been introduced. In
these cases the control chart methods of Shewhart are useful to check on
process stability.
318 Managing out-of-control processes
Group factors
A trouble-shooting project or any process improvement may begin by an
examination of the possible differences in output quality of different people,
different equipment, different product or other variables. If differences are
established within such a group, experience has shown that careful study of
the sources of the variation in performance will often provide important
causes of those differences. Hence, the key to making adjustments and
improvements is in knowing that actual differences do exist, and being able to
pinpoint the sources of the differences.
It is often argued that any change in a product, service, process or plant will
be evident to the experienced manager. This is not always the case. It is
accepted that many important changes are recognized without resort to
analytical studies, but the presence, and certainly the identity, of many
economically important factors cannot be recognized without them. Processes
are invariably managed by people who combine theory, practical experience
and ingenuity. An experienced manager will often recognize a recurring
malfunctioning process by characteristic symptoms. As problems become
more complex, however, many important changes, particularly gradual ones,
cannot be recognized by simple observation and intuition no matter how
competent a person may be as an engineer, scientist, or psychologist. No
process is so simple that data from it will not give added insight into its
behaviour. Indeed many processes have unrecognized complex behaviour
which can be thoroughly understood only by studying data on the product
produced or service provided. The manager or supervisor who accepts and
learns methods of statistically based investigation to support ‘technical’
knowledge will be an exceptionally able person in his area.
Discussion of any trouble-shooting investigation between the appropriate
people is essential at a very early stage. Properly planned procedures will
prevent wastage of time, effort and materials and will avoid embarrassment to
those involved. It will also ensure support for implementation of the results of
the study. (See also Chapter 14.)
12.3 Use of control charts for trouble-shooting
In some studies, the purpose of the data collection is to provide information
on the relationships between variables. In other cases, the purpose is just to
find ways to eliminate a serious problem – the data themselves, or a formal
analysis of them, are of little or no consequence. The application of control
charts to data can be developed in a great variety of situations and provides a
simple yet powerful method of presenting and studying results. By this means,
sources of assignable causes are often indicated by patterns or trends. The use
of control charts always leads to systematic programmes of sampling and
Managing out-of-control processes 319
measurement. The presentation of results in chart form makes the data more
easily assimilated and provides a picture of the process. This is not available
from a simple tabulation of the results.
The control chart method is, of course, applicable to sequences of attribute
data as well as to variables data, and may well suggest causes of unusual
performance. Examination of such charts, as they are plotted, may provide
evidence of economically important assignable causes of trouble. The chart
does not solve the problem, but it indicates when, and possibly where, to look
for a solution.
The applications of control charts that we have met in earlier chapters
usually began with evidence that the process was in statistical control.
Corrective action of some sort was then indicated when an out-of-control
signal was obtained. In many trouble-shooting applications, the initial results
show that the process is not in statistical control and investigations must begin
immediately to discover the special or assignable causes of variation.
It must be made quite clear that use of control charts alone will not enable
the cause of trouble in a process to be identified. A thorough knowledge of the
process and how it is operated is also required. When this is combined with
an understanding of control chart principles, then the diagnosis of causes of
problems will be possible.
This book cannot hope to provide the intimate knowledge of every process
that is required to solve problems. Guidance can only be given on the
interpretation of control charts for process improvement and trouble-shooting.
There are many and various patterns which develop on control charts when
processes are not in control. What follows is an attempt to structure the
patterns into various categories. The latter are not definitive, nor is the list
exhaustive. The taxonomy is based on the ways in which out-of-control
situations may arise, and their effects on various control charts.
When variable data plotted on charts fall outside the control limits there is
evidence that the process has changed in some way during the sampling
period. This change may take three different basic forms:
᭹ A change in the process mean, with no change in spread or standard
deviation.
᭹ A change in the process spread (standard deviation) with no change in the
mean.
᭹ A change in both the process mean and standard deviation.
These changes affect the control charts in different ways. The manner of
change also causes differences in the appearance of control charts. Hence, for
a constant process spread, a maintained drift in process mean will show a
different pattern to frequent, but irregular changes in the mean. Therefore the
list may be further divided into the following types of change:
320 Managing out-of-control processes
1 Change in process mean (no change in standard deviation):
(a) sustained shift;
(b) drift or trend – including cyclical;
(c) frequent, irregular shifts.
2 Change in process standard deviation (no change in mean):
(a) sustained changes;
(b) drift or trends – including cyclical;
(c) frequent irregular changes.
3 Frequent, irregular changes in process mean and standard deviation.
These change types are shown, together with the corresponding mean,
range, and cusum charts, in Figures 12.1 to 12.7. The examples are taken from
a tablet-making process in which trial control charts were being set up for a
sample size of n = 5. In all cases, the control limits were calculated using the
data which is plotted on the mean and range charts.
Sustained shift in process mean (Figure 12.1)
The process varied as shown in (a). After the first five sample plots, the
process mean moved by two standard deviations. The mean chart (b) showed
the change quite clearly – the next six points being above the upper action
line. The change of one standard deviation, which follows, results in all but
one point lying above the warning line. Finally, the out-of-control process
moves to a lower mean and the mean chart once again responds immediately.
Throughout these changes, the range chart (c) gives no indication of lack of
control, confirming that the process spread remained unchanged.
The cusum chart of means (d) confirms the shifts in process mean.
Drift or trend in process mean (Figure 12.2)
When the process varied according to (a), the mean and range charts ((b) and
(c) respectively) responded as expected. The range chart shows an in-control
situation since the process spread did not vary. The mean chart response to the
change in process mean of ca. two standard deviations every ten sample plots
is clearly and unmistakably that of a drifting process.
The cusum chart of means (d) is curved, suggesting a trending process,
rather than any step changes.
Frequent, irregular shift in process mean (Figure 12.3)
Figure 12.3a shows a process in which the standard deviation remains
constant, but the mean is subjected to what appear to be random changes of
between one and two standard deviations every few sample plots. The mean
chart (b) is very sensitive to these changes, showing an out-of-control
Managing out-of-control processes 321
Figure 12.1 Sustained shift in process mean
322 Managing out-of-control processes
Figure 12.2 Drift or trend in process mean
Managing out-of-control processes 323
Figure 12.3 Frequent, irregular shift in process mean
324 Managing out-of-control processes
situation and following the pattern of change in process mean. Once again the
range chart (c) is in-control, as expected.
The cusum chart of means (d) picks up the changes in process mean.
Sustained shift in process standard deviation (Figure 12.4)
The process varied as shown in (a), with a constant mean, but with changes
in the spread of the process sustained for periods covering six or seven sample
plots. Interestingly, the range chart (c) shows only one sample plot which is
above the warning line, even though has increased to almost twice its
original value. This effect is attributable to the fact that the range chart control
limits are based upon the data themselves. Hence a process showing a
relatively large spread over the sampling period will result in relatively wide
control chart limits. The mean chart (b) fails to detect the changes for a similar
reason, and because the process mean did not change.
The cusum chart of ranges (d) is useful here to detect the changes in process
variation.
Drift or trend in process standard deviation (Figure 12.5)
In (a) the pattern of change in the process results in an increase over the
sampling period of two and a half times the initial standard deviation.
Nevertheless, the sample points on the range chart (c) never cross either of the
control limits. There is, however, an obvious trend in the sample range plot
and this would suggest an out-of-control process. The range chart and the
mean chart (b) have no points outside the control limits for the same reason
– the relatively high overall process standard deviation which causes wide
control limits.
The cusum chart of ranges (d) is again useful to detect the increasing
process variability.
Frequent, irregular changes in process standard deviation (Figure 12.6)
The situation described by (a) is of a frequently changing process variability
with constant mean. This results in several sample range values being near to
or crossing the warning line in (c). Careful examination of (b) indicates the
nature of the process – the mean chart points have a distribution which mirrors
the process spread.
The cusum chart of ranges (d) is again helpful in seeing the changes in
spread of results which take place.
The last three examples, in which the process standard deviation alone is
changing, demonstrate the need for extremely careful examination of control
charts before one may be satisfied that a process is in a state of statistical
Managing out-of-control processes 325
Figure 12.4 Sustained shift in process standard deviation
326 Managing out-of-control processes
Figure 12.5 Drift or trend in process standard deviation