Project Planning Control 4 E Part 13 pps
Bạn đang xem bản rút gọn của tài liệu. Xem và tải ngay bản đầy đủ của tài liệu tại đây (806.85 KB, 30 trang )
31
MS Project 98
Probably the most popular project management
program in use today is MS Project. Since its first
introduction, it was updated a number of times and
its latest version, MS Project 98 has been further
enhanced to enable communications to be made to
the Internet as well as improving the existing
capabilities relating to resource management,
Earned Value Analysis and Intranet support.
The list below shows some of the additional
facilities provided by the latest version of MS
Project:
Task Usage and Resource Usage
Custom time-period tracking
Cross project linking
Resource contouring
Multiple critical paths
Task splitting
Status date
Customizable Gantt charts
Workgroup features
Web publishing
Personal Web Server for Windows 95
Office Assistant
MS Office compatibility
Database file format
Full ODBC (Open Database Connectivity)
support
Project Planning and Control
340
Figure 31.1
Figure 31.2
MS Project 98
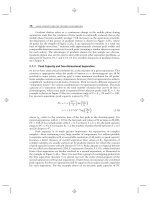
The basic principles, which are common to most commercial project
management software packages, are described below.
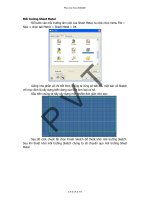
When MS Project is opened, the Application window which contains the
Project window appears as shown in Figure 31.1 (View – Table – Entry). The
Project window shown is the Gantt chart view or Task Entry Table and is the
default view of MS Project. The Project window can be split using a special
‘split’ feature (Window – Split) so that the lower section becomes the Task
Form, used to enter additional information for each task. This is shown in
Figure 31.2.
The first job is to set up the project using the Project Information box as
shown in Figure 31.3. This, when completed, will show the Project Start date,
Finish date, a selection box which will show which of the two (Start date or
Finish date) will be used as a basis for scheduling, the Current date, Status
date and the type of calendar selected. The calendar can be Standard, 24 hours
or Night Shift. If the Start date has been selected for scheduling, the Finish
date will be adjusted automatically, depending on the actual programme.
The default calender of MS Project is set up for an 8-hour day and a 5-day
week. If this is not acceptable for the project in question, it can be changed in
the ‘Change Working Time’ dialog box (Tools – Change Working Time).
This box also allows the new working and non-working times, hours per day
and hours per week to be entered and set as the default calender using the
‘Create New Base Calender’ dialog box (see Figure 31.4).
Resource calendars, based on the ‘Base Calender’, can be created to suit the
working times of any one of the resources employed on the project and are
created automatically as soon as resources are added to the tasks.
341
Figure 31.3
Project Planning and Control
After entering the main parameters of the project, such as name, start date,
time units, milestone dates etc., the activities or tasks (as they are called in MS
Project) and their durations are listed on the ‘task entry table’ (see Figure
31.2).
This table assigns the tasks to an ID number and has columns for Task
Name, Duration, Start, Finish, Predecessors, and Resource Names. The Finish
date is calculated automatically by adding the Duration to the Start date.
A Resource Task Form showing any delays to the Start or Finish dates can
be called up from View – More Views – Resource Form (see Figure
31.5).
As soon as a task has been entered, it is immediately displayed as a bar on
a calendar scale to the right of the task entry table (see Figure 31.6).
When all the tasks have been entered, the interrelationship or linking of the
tasks can be done by either:
(a) linking the bars in the generated bar (or Gantt) chart (this is done
automatically if the predecessors have been entered), or
(b) giving the ID or name of the predecessor activity in the Task Form, which
can be viewed on the same screen using the ‘split’ feature.
While this linking on the screen is relatively easy when all, or nearly all, the
activities are visible on the screen, it becomes much more difficult to ensure
342
Figure 31.4
MS Project 98
343
Figure 31.5
Figure 31.6
Project Planning and Control
that no relationships are missed, when the network is bigger than, say, 30
activities. For this reason the network should always be draughted manually
and the interrelationships checked and double checked before they are entered
into the computer using the Task Form. The purpose of the computer program
is to do the number crunching, not to take the place of the planner or project
manager, who should know which activity is dependent on which.
Once all the tasks and their links have been entered, the cursor is placed on
the ‘Link Tasks’ icon, which enables the computer to display the now
modified bar chart, giving the completion date and listing the floats. The
critical path is highlighted on the bar chart in either a different colour or a
different pattern in the bars. Tasks which follow each other without a break
are, if so chosen, shown in addition to the task bar, by a summary line
stretching the total duration of the unbroken set of tasks. Milestones, i.e. tasks
with zero duration, are shown as diamonds.
If the calculated completion date is not acceptable, it is very easy to change
either the durations or the interrelationship of the links to give the desired
result, assuming of course that the necessary resources are available to meet
this date.
Task predecessors can also be changed easily by bringing up the Task Form
and changing the name of the task predecessor in the Predecessor Name cell, in
the right-hand part of this form. At the same time it is possible to change the ID
number and (if required) the type of task relationship such as ‘Finish to Start’
‘Start to Start’, ‘Finish to Finish’ or ‘Start to Finish’. (It should be pointed out
that 99% of all task relationships are ‘Finish to Start’.) Lead and lag times
specified in minutes, hours, days or weeks can also be entered in this screen.
MS Project automatically converts the Gantt chart into a precedence
network called a ‘PERT Chart’, which can be displayed by choosing the PERT
Chart command from the VIEW – PERT Chart menu or simply clicking the
pictorial ‘PERT Chart’ icon on the left-hand edge of the entry screen. This
area of the screen also contains similar pictorial icons for quick access to:
The Project Calender
Gantt Chart
Task Usage
Tracking Gantt
Resource Graph
Resource Sheet
Resource Usage and
More views
344
MS Project 98
The nodes displayed in the PERT chart are by default quite large, so that in
order to view a larger section of the network, one has to zoom out by
pressing the appropriate zoom icon shown as a magnifying glass on the
tool bar. The type of border around the task box indicates whether it is an
ordinary activity, a critical activity, a summary activity or a milestone.
In practice it is still only possible to see quite a small network on this
display due to the inevitable restriction of the screen size (see Figure 31.7).
When the network is reduced to its smallest size, it becomes difficult to
read the information in the nodes which consist of the task name, ID
number, duration, early start date and late start date. If the network consists
of a large number of activities, it is essential that it is printed out on a
plotter, since if a line printer is used, one ends up with a large number of
pieces of paper which have to be taped together. This restriction should be
of little concern, since as stated previously, it is far more important to
produce the network manually before using the computer to calculate the
critical path, total floats, free floats and other information.
The position of the task boxes can be changed on the PERT chart by
dragging and dropping the task boxes and by moving the link lines with
the mouse. The link lines can be chosen to connect the boxes by straight
lines (at any angle) or by lines running only at right angles.
Progress (or tracking) can be plotted on the Gantt chart by imputting the
actual data for each task. The progress is now indicated by a solid black
(or coloured) line within the original task bar. The length of this solid line
is proportionate to the actual time expended.
Facilities exist for printing out a number of reports such as all the
critical tasks, non-started tasks, the floats (total and free) for all tasks, the
project statistics, project overview and resources. In MS Project, the float is
called slack, i.e. total slack and free slack.
A filter facility enables the planner to prepare reports containing only
selected groups of tasks such as only critical activities.
The latest version of MS Project enables the activities or tasks to be
split. This is useful when the second half of an activity has to be
interrupted for a while before it can be completed. This can be done by
dragging and dropping task bars on the Gantt chart.
Many of these facilities may of course never be used, but at least they
are available as part of the latest application for the more sophisticated
planner.
345
Figure 31.7
MS Project 98
Resources
Resources can be entered in a number of ways, but the simplest method is to
enter them directly in the left-hand part of the Task Form or in more detail on
the Resource Information dialog box, which shows the name of the resource,
e.g. foreman, his initials (or abbreviation), the dept or group he belongs to, the
number (of foremen) available, the standard rate of pay (per hour), the
overtime rate, and the cost per use, e.g. when an agreed rate for a consultant
is used (see Figure 31.8).
The resources can also be allocated to tasks by clicking on the ‘Resource
Assignment’ button, which brings up the Resource Assignment dialog box
347
Figure 31.8
Figure 31.9
Project Planning and Control
that displays all the previously entered resources (see Figure 31.9). By
entering the name of the resource in an available cell together with the number
of resource units available, the resource can be assigned to the selected task
by clicking on the ‘Assign’ button. A facility exists for assigning a resource
to several tasks simultaneously and showing the name of the resource next to
the task bar on the Gantt chart.
MS Project now allows work to be assigned using predefined resource
contours, which tell the program how the resource’s work should be spread
over the duration of the assignment. Thus the contours can be:
Flat
Back Loaded
Bell
Double Peak
Early Peak
Front Loaded
Late Peak or
Turtle
Scheduling can be time (fixed duration) driven or resource driven. The latter
is the default setting and unless it has been changed in the Task Information
dialog box, Ms Project will automatically extend the duration of an activity
inversely to the resources allocated to that activity. For example, 4 men have
been originally allocated to activity ‘A’, which was to take 12 days, and as it
is now only possible to employ 3 men, the duration of activity ‘A’ will
automatically be increased to 16 days. Conversely, if 6 men can be employed,
the duration will be reduced to 8 days. Clearly if activity ‘A’ was on the
critical path, the total project time will be changed accordingly.
The resource names can be added to the Gantt chart display next to the
activity bars and displayed on the Resource Usage chart which will also
indicate any under-or overusage of resources.
The distribution of a particular type of resource or all the resources can be
shown graphically in the form of a conventional histogram or resource graph.
This view can then be used to reallocate or smooth the resources to meet the
availability criteria of the project.
By entering the monetary rates (rate per hour, rate per man, rate per day
etc.) for each resource in the Resource Sheet, MS Project will calculate the
cost of the resource for every activity. This is shown in the Task Cost table,
Figure 31.10, accessed from View – Table – Cost. A Task Summary table
348
MS Project 98
349
Figure 31.10
Figure 31.11
Project Planning and Control
which shows the status of the project can be obtained from View – Table –
Summary and is shown in Figure 31.11.
The Actual Start & Finish, % Complete, Actual & Remaining Duration,
Actual Cost and Actual Work performed can be seen on the Task Tracking
table, Figure 31.12, accessed from View – Table – Tracking. When scrolled,
the information will also appear in bar chart form.
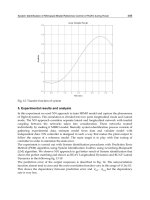
The latest version of MS Project can carry out Earned Value calculations,
but unfortunately to view the all-important control curves showing the
relationship between Actual, Planned and Earned Value, the data must be
exported to Microsoft Excel with the aid of a Wizard. It is also possible to
model cross-project dependencies by dragging and dropping between the two
sets of bars in the different Gantt charts.
MS Project contains the usual comprehensive ‘Help’ system, and an
interactive Office Assistant to provide guidance, and to explain the facilities
of MS Project better, some of the views and reports are taken from the
example of the bungalow described in Chapter 28.
350
Figure 31.12
32
Project close-out
Project close-out
Towards the end of the project, the project
manager must make arrangements for a controlled
close-out of the project. There is always a risk of
time and money being expended on additional
work not originally envisaged or where envisaged
work is dragged out because no firm cut-off date
has been imposed. However, before a project can
be handed over, a large number of documents have
to be checked and updated to reflect the latest
version and as-built condition.
In addition, certain documents obtained and
collated during the various phases of the project
have to be bound and handed over to the client to
enable the plant or systems to be operated and
maintained. The following list gives some of the
documents that fall into this category:
Stage acceptance certificates
Final handover certificate
Operating instructions or manuals
Maintenance instructions or manuals
Project Planning and Control
Spares lists (usually priced) divided into operating and strategic spares
Lubrication schedules
Quality control records and audit trails
Material test certificates
Equipment test and performance certificates
Equipment, material and system guarantees
All contracts (and subcontracts) must be properly closed out and (if possible)
all claims and back charges (including liquidated damages) agreed and settled.
The site must be cleared, all temporary buildings, structures and fences have
to be removed, access roads made good and surplus material disposed of. This
material can either be sold to the client or operator for spares or, provided the
relevant certificates are attached, returned to the supplier or stock. Any
uncertificated or unusable material has to be sold for scrap.
Close-out report
Using the information recorded in the project diary and the various project
status reports, the project manager must now prepare his project close-out
report. This should discuss the degree of compliance with the original project
brief (or business case) and acceptance criteria and highlight any important
problems encountered together with the solutions adopted.
Apart from giving a short history and post-implementation review of the
project, the purpose of this document is to enable future project managers on
similar projects to learn from the experience and issues encountered. For this
reason the close-out report has to be properly indexed and archived in hard copy
or electronic format for easy retrieval.
The report will be sent to the relevant stakeholders and discussed at a formal
close-out meeting at which the stakeholders will be able to express their views
on the success (or otherwise) of the project. At the end of this meeting the
project can be considered to be formally closed.
352
33
Stages and sequence
Summary of project stages and
sequence
The following pages show the stages and sequen-
ces in diagrammatic and tabular format.
Figure 32.1 shows the normal sequence of
controls of a project from business case to
close-out;
Figure 32.2 gives a diagrammatic version of
the control techniques for the different project
stages;
Figure 32.3 is a heirarchical version of the
project sequence which also shows the chapter
numbers in the book where the relevant stage
or technique is discussed;
Table 32.1 is a detailed tabular breakdown of
the sequence for a project control system,
again from business case to project close-out.
While the diagrams given will cover most types
of projects, it must be understood that projects
vary enormously in scope, size and complexity.
Project Planning and Control
The sequences and techniques given may therefore have to be changed to suit
any particular project. Indeed certain techniques may not be applicable in their
entirety or may have to be modified to suit different requirements. The
principles are, however, fundamentally the same.
354
Figure 32.1
Stages and sequence
Project stage control techniques
355
Figure 32.2
Business case
Investment appraisal (2)
Budget
Project life cycle (4)
WBS (5)
CPM (11)
Gantt chart (16)
Milestones/slip chart (16)
Resource histogram (25)
Cumulative ‘S’ curve (25)
Cost/EVA (27)
Comparative curves (27)
Cash flow (26)
Cash in & out curves (26)
Close out re
p
ort (32)
Cost/benefit analysis
DCF/NPV (2)
Objectives
Phases (4)
Stages (4)
Structure
Matrix/task force
Risk (8)
Risk plan (8)
Risk register (8)
PMP (7)
Configuration (10)
Change control (10)
Change forms (10)
Dist. schedule
OBS (5)
Organogram (5)
Responsibility matrix (5)
PBS (5)
CBS (5)
QA (9)
Estimates (6)
Qual. plan (9)
Time sheets (27)
Computer analysis (17)
Line of balance (16)
Number in parentheses ()
indicates cha
p
ter number.
Project sequence
Figure 32.3
Stages and sequence
Table 32.1 Sequence for project control system
Business case
Cost/benefit analysis
Set objectives
DCF calculations
Establish project life cycle
Establish project phases
Produce project management plan (PMP)
Produce budget (labour, plant, materials, overheads etc.)
Draw work breakdown structure (WBS)
Draw product breakdown structure
Draw Organization Breakdown Structure
Draw Responsibility Matrix
List all possible risks
Carry out risk analysis
Draw up risk management plan
Produce risk register
Draw up activity list
Draw network logic (CPM) (free hand)
Add activity durations
Calculate forward pass
Revise logic (maximize parallel activities)
Calculate 2nd forward pass
Revise activity durations
Calculate 3rd forward pass
Calculate backward pass
Mark critical path (zero float)
Draw final network on grid system
Add activity numbers
Draw bar chart (Gantt chart)
Draw milestone slip chart
Produce resource table
Add resources to bar chart
Aggregate resources
Draw histogram
Smooth resources (utilize float)
Draw cumulative ‘S’ curve (to be used for EVA)
List activities in numerical order
Add budget values (person hours)
Record weekly actual hours (direct and indirect)
Record weekly % complete (in 5% steps)
Calculate value hours weekly
Calculate overall % complete weekly
Calculate overall efficiency weekly
Calculate anticipated final hours weekly
Draw time/person hour curves (budget, planned, actual, value, anticipated final)
357
Project Planning and Control
Table 32.1 Continued
Draw time/% curves (% planned, % complete, % efficiency)
Analyse curves
Take appropriate management action
Calculate cost per activity (labour, plant, materials)
Add costs to bar chart activities
Aggregate costs
Draw curve for plant and material costs (outflow)
Draw curve for total cash OUT (this includes labour costs)
Draw curve for total cash IN
Analyse curves
Calculate overdraft requirements
Set up information distribution system
Set up weekly monitoring and recording system
Set up system for recording and assessing changes and extra work
Set up reporting system
Manage risks
Set up regular progress meetings
Write Close-out Report
358
34
Abbreviations and
acronyms used in
project management
Abbreviation Meaning Usage
ACC Annual Capital Charge Finance
ACWP Actual Cost of Work Performed EVA
AOA Activity on Arrow CPA
AON Activity on Node CPA
APM Association for Project Management PM
ARM Availability, Reliability, Maintainability MOD
BC Business Case PM
BCWP Budgeted Cost of Work Performed EVA
BCWS Budgeted Cost of Work Scheduled EVA
BOK Body of Knowledge PM
BS British Standard General
BSI British Standards Institution General
CAR Contractor’s All Risk Construct
CBS Cost Breakdown Structure PM
CDM Construction, Design and Management Construction
Project Planning and Control
Abbreviation Meaning Usage
CEN Comit´e Europeen de Normalization General
CIF Carriage, Insurance, Freight Procurement
CM Configuration Management PM
CPA Critical Path Analysis PM
CPA Contract Price Adjustment Procurement
CPI Cost Performance Index EVA
CPM Critical Path Methods CPA
CSCS Cost & Schedule Control System EVA
DCF Discounted Cash Flow Finance
DDP Delivery Duty Paid Procurement
DIN Deutsche Industrie Normen General
EVA Earned Value Analysis PM
EVMS Earned Value Management System EVA
FF Free Float CPA
FLAC Four Letter Acronym General
FMEA Failure Mode & Effect Analysis MOD
FOB Free on Board Procurement
FOR Free on Rail Procurement
HR Human Resources General
H&S Health & Safety General
IA Investment Appraisal Finance
IPMA International Project Management Association PM
IPMT Integrated Project Management Team PM
IPR Intellectual Property Rights General
IRR Internal Rate of Return Finance
IS Information Systems General
ISEB Information Systems Examination Board General
ISO International Organization for Standardization General
IT Information Technology General
LCC Life Cycle Costing PM
LOB Line of Balance Construct
LRM Linear Responsibility Matrix PM
MOD Ministry of Defence General
NOSCOS Needs, Objectives, Strategy & Organizations
Control System
MOD
NDT Non Destructive Testing Construct
NPV Net Present Value Finance
OBS Organization Breakdown Structure PM
ORC Optimal Replacement Chart Finance
ORM Optimal Replacement Method Finance
360
Abbreviations and acronyms used in project management
Abbreviation Meaning Usage
PBS Product Breakdown Structure PM
PDM Precedence Diagram Method CPA
PERT Program Evaluation & Review Technique CPA
PFI Private Finance Initiative Finance
PM Project Management PM
PM Project Manager PM
PMP Project Management Plan PM
PPE Post Project Evaluation PM
PPP Public–Private Partnership Finance
PRD Project Definition PM
QA Quality Assurance General
QC Quality Control General
QMS Quality Management System General
QP Quality Plan General
R&D Research and Development General
RR Rate of Return Finance
SFR Sinking Fund Return Finance
SMART Specific, Measurable, Achievable, Realistic,
Timebound
MOD
SOW Statement of Work PM
SPI Schedule Performance Index EVA
SRD Sponsor’s Requirement Definition PM
SWOT Strength, Weakness, Opportunity, Threat PM
TCP Time, Cost & Performance PM
TF Total Float CPA
TQM Total Quality Management General
TOR Terms of Reference General
VA Value Analysis General
VE Value Engineering General
VM Value Management General
WBS Work Breakdown Structure PM
See also list of acronyms.
Acronyms used in project management
ARM Availability, Reliability, Maintainability
CADMID Concept, Assessment, Demonstration, Monitoring,
In-Service, Disposal
CFIOT Concept, Feasibility, In-Service, Operation, Termination
CS
2
(CSCS) Cost & Schedule Control System
361
Project Planning and Control
EMAC Engineering Manhours And Cost
FLAC Four Letter Acronym
HASAWA Health And Safety At Work Act
NAPNOC No Agreed Price, No Contract
NIMBY Not In My Back Yard
NOSCOS Needs, Objectives, Strategy & Organization Control
System
NOSOCS&R Needs, Objectives, Strategy, Organization Control, System
& Risk
PAYE Pay As You Earn
PERT Program, Evaluation & Review Technique
PESTEL Political, Economic, Sociological, Technological,
Environmental, Legal
PRAM Project Risk Analysis & Management
PRINCE Projects in a Controlled Environment
RIDDOR Reporting of Injuries, Diseases & Dangerous Occurrences
Regulations
RIRO Rubbish In–Rubbish Out
SMAC Site Manhours And Cost
SMART Specific, Measurable, Achievable, Realistic & Time
bound
SOW Statement Of Work
SWOT Strengths, Weaknesses, Opportunities & Threats
362
Glossary
Activity An operation on a network which
takes time (or other resources) and is indicated by
an arrow.
Actual cost of work performed (ACWP) Cu-
mulative actual cost (in money or manhours) of
work booked in a specific period.
Actual hours The manhours actually expended
on an activity or contract over a defined period.
AoN Activity on Node.
AoA Activity on Arrow.
Arithmetical analysis A method for calcu-
lating floats arithmetically.
Arrow A symbol on a network to represent an
activity or dummy.
Arrow diagram A diagram showing the inter-
relationships of activities.
Back end The fabrication, construction and
commissioning stage of a project.
Backward pass A process for subtracting dura-
tions from previous events, working backwards
from the last event.
Banding The subdivision of a network into
horizontal and vertical sections or bands to aid
identification of activities and responsibilities.
Bar chart See Gantt chart.
Beta (b) distribution Standard distribution
giving the expected time te = (a + 4m + b)/6.
Budget Quantified resources to achieve an
objective, task or project by a set time.