Soil Sampling and Methods of Analysis - Part 7 pot
Bạn đang xem bản rút gọn của tài liệu. Xem và tải ngay bản đầy đủ của tài liệu tại đây (4.96 MB, 282 trang )
VII. SOIL WATER ANALYSES
Section Editors: W.D. Reynolds and G. Clarke Topp
ß 2006 by Taylor & Francis Group, LLC.
ß 2006 by Taylor & Francis Group, LLC.
Chapter 69
Soil Water Analyses: Principles
and Parameters
W.D . Reynolds
Agriculture and Agri-Food Canada
Harrow, Ontario, Canada
G. Clarke Topp
Agriculture and Agri-Food Canada
Ottawa, Ontario, Canada
69.1 INTRODUC TION
For the uninit iated, soil water anal yses can be daunt ing becau se they are b ased on many
nonin tuitive princi ples and they use a large numb er of comple x parame ters. The prima ry intent
of thi s chapter is to help alleviate this situat ion by b riefly revi ewing the main principle s and
para meters involved in mode rn soil water anal yses. The chapter also serves as addi tional
backgr ound and context for the methods describ ed in Chapte r 70 thr ough Chapter 85.
Soil water analyses can be organized into two main groups: (i) analysis of storage properties
and (ii) analysis of hydraulic properties. Storage properties refer to the soil’s ability to absorb
and hold water, and these properties include water content, water potential, and water
desorption and imbibition characteristics. Hydraulic properties, on the other hand, refer to
the soil’s ability to transmit or conduct water, and these include saturated hydraulic conduct-
ivity, unsaturated hydraulic conductivity, and various associated capillarity parameters such
as sorptivity, flux potential, sorptive number, and flow-weighted mean (FWM) pore diam-
eter. These properties and their interrelationships are discussed in the following sections.
69.2 SOIL WATER CONTENT
Soil water content can be defined on a gravimetric basis (mass of water per unit mass of dry
soil) or on a volumetric basis (volume of water per unit bulk volume of dry soil), and it is
expressed either as a dimensionless ratio or as a percentage. These two definitions are not
equivalent, however, and it is consequent ly essential to specify the definition used when
reporting water content values. It should also be noted that ‘‘bulk volume’’ of dry soil refers
to the dimensions of the soil sample just before the water volume determination and before
ß 2006 by Taylor & Francis Group, LLC.
any soil disturbance . Gravi metric water cont ent (i.e., mass water =mass dry soil) is related to
volumetric water cont ent (i. e., volume water =bulk volume dry soil) via soil dry bulk density ,
r
b
(mg m
À 3
) and pore water density , r
w
(mg m
À 3
), accordi ng to the formul a
u
v
¼
r
b
r
w
u
m
(69: 1)
where u
m
is the gravim etric water content (kg
water
kg
soil
À 1
) and u
v
is the volumetric water
content (m
water
3
m
soil
À 3
).
The volumetric water content is often expre ssed as ‘‘relative saturati on’’ (al so know n as
saturatio n ratio or degree o f saturati on), which gives the ratio of the measur ed volumet ric
water content ( u
v
) to the correspo nding volumet ric water cont ent at full or com plete
saturatio n (u
s
). Con sequentl y, relative sat uration give s the fraction o f the soil pore space
that is water -filled, and therefore ranges from a minimum valu e of 0 (no water in pore space)
to a max imum value of 1 (pore space comple tely water -filled). When the soil pore space is
completely water-fille d (relati ve saturati on ¼ 1), the soil volumet ric water cont ent is equal to
the soil porosity, n (por osity is defined as the total volume of soil pore space per unit bulk
volume of soil). Relativ e saturati on is frequently expre ssed as an ‘‘effect ive saturati on,’’ S
e
,
which include s the residua l soil water content , u
r
, that is the ‘‘im mobile’’ water remainin g
in air-dry soil and retained in small isolat ed pores. Effective sat uration is defi ned
as S
e
¼ ( u
v
Àu
r
) =( u
s
Àu
r
) and ranges from a minimum v alue o f 0 at residua l saturati on
(i.e., u
v
¼u
r
) to a max imum valu e of 1 at complete saturation (i.e., u
v
¼u
s
).
Water content measur ement tech niques are often classified as ‘‘direct ’’ or ‘‘indirect.’ ’ Direct
methods usually alter the sample irrevocabl y by changing its water content and physi cal
characterist ics (i.e., they are ‘‘de structive ’’ methods ); and these methods involv e som e form
of remo val or separation of water from the soil matrix with a dir ect measur ement of the
amount of water removed . Separation of the water from the soil matri x may be achieved by
heating (wate r vapor ization), by water repl acement with a solvent (w ater absor ption), or by
chemical reac tion (water d isassociati on). Th e amo unt of water removed is then determin ed
by measuring the change in soil mass after heating, by collecting and condensing emitted
water vapor, by chemical or physical analysis of the extracting solvent, or by quantitative
measurement of chemical reaction products. The removal of water by heating is commonly
referred to as the thermogravimetric technique (see Topp and Ferre
´
2002 for details) and it is
by far the most com mon of the dir ect methods (see Chapter 70). Indirec t methods measur e
some physical or chemical property of soil that depends on its water content. These
properties include the relative permittivity (dielectric constant), electrical conductivity, heat
capacity, hydrogen content, and magnetic susceptibility. The indirect methods usually alter the
sample minimally (or not at all) in that the water content and physical characteristics of the
sample are not changed appreciably by the measurement (i.e., they are ‘‘nondestructive’’
methods). However, the accuracy and precision of indirect methods depends to a large extent
on the accuracy and precision of the relationship between the measured property (e.g., permit-
tivity) and u
v
. In Chapter 70, we limit discussion to the indirect methods that are based on relative
bulk soil dielectric permittivity, as they are the most highly developed and versatile.
The electromagnetic (EM) methods discussed in Chapter 70 all arise from analyses based in
EM wave propagation or radio frequency (RF) circuits. Measurement of soil water content
by these methods involves using the soil as an EM wave-propagating medium or as a resistor
or capacitor in a circuit. The time-domain reflectometry (TDR), ground-penetrating radar
(GPR), and remote radar (remote sensing) methods use the EM wave-propagation properties
ß 2006 by Taylor & Francis Group, LLC.
of the soil, whereas the capacitanc e and impeda nce methods use the soil as a resist or o r
capac itor in a circuit.
The unique electrical properties of water (both pure water and soil pore water) form the basis
of soil water content measurements by EM wave propagation. The relative dielectric
permittivity of water is generally more than an order of magnitude larger than that of other
soil components. As a result, the bulk relative dielectric permittivity of soil ( «
ra
) is almost
entirely a function of the soil’s volumetric water content (u
v
), with only a slight dependence on
the volume fraction of soil solids and the bulk soil electrical conductivity (Topp et al. 1980).
For each of the EM methods presented in Chapter 70, a measurement of «
ra
is used to infer u
v
.
A single relationship between «
ra
and u
v
for all soils does not yet exist because of the
complex interactions among EM waves and soil component s. Many soils have very similar
relationships, however, and thus sufficient accuracy can usually be attained using only a few
‘‘quasigeneral’’ relationships, for example, mineral soils, organic soils, saline soils, etc.
(Topp et al. 1980; To pp and Ferre
´
2002). It has further been established that assuming a
linear relationship between u
v
and
ffiffiffiffiffiffi
«
ra
p
is appropriate for most soil materials (Topp and
Reynolds 1998), and that this relationship is predicted by dielectric models employing a
three-component mixture of soil solids, soil water, and soil air (Robinson et al. 2005). Thus
EM methods are now considered highly reliable for measuring soil volumetric water content.
Water content methods are described in Chapter 70 and include thermogravimetry (oven
drying), TDR, GPR, and a general description of the impedance and capacitance techniques.
Thermogravimetry based on oven drying is usually considered the ‘‘benchmark’’ of
accuracy and relevance against which other methods are assessed.
69.3 SOIL WATER POTENTIAL
Total water potential (c
t
) is classically defined as the amount of work (force Âdistance)
required to transport, isothermally and reversibly, an infinitesimal quantity of water from a
specified reference condition (pool of pure water at specified pressure and elevation) to the
system under consideration (Or and Wraith 2002). It is usually more convenient for natural
porous materials, however, to consider c
t
as the amount of work required to transport water
away from the material (i.e., remove water rather than add water), as most natural materials
are hydrophilic and thereby tend to absorb and retain water in a manner similar to that of a
paper towel (nonswelling materials) or sponge (swelling materials).
Water potential is commonly expressed in units of energy per unit mass, U
m
(J kg
À1
), energy
per unit volume, U
v
(Pa), or energy per unit weight, U
wt
(m), with the latter two being by far
the most prevalent. Conversion amongst the units is achieved using
U
m
¼ U
v
=r
w
¼ gU
wt
(69:2)
where r
w
is the density of water (1000 kg m
À3
at 20
C) and g is the acceleration due to
gravity (9:81 m s
À2
).
The total potential, c
t
, of water in soil or other natural porous materials is usually the sum of
four-component water potentials:
c
t
¼ c
m
þ c
p
þ c
p
þ c
g
(69:3)
ß 2006 by Taylor & Francis Group, LLC.
where c
m
is the matric pote ntial, c
p
is the osm otic pote ntial, c
p
is the pressure pote ntial, and
c
g
is the gravit ational pote ntial. Th e matri c potential is negativ e (c
m
0) and arises from the
various electrostat ic forc es in the soil matri x that attract water when the soil is u nsaturated .
The osmoti c potential is als o negativ e ( c
p
0) and resu lts from disso lved mater ials (salts)
and colloids, which lower the pore water’s activit y (free energy) below that of pure water .
The pres sure potential is posi tive ( c
p
! 0), and is cause d by the hydros tatic pressure of the
pore water overlying the measur ement point whe n the soil is sat urated. The gravitationa l
potential ( c
g
) arises from the action of the earth’ s g ravitational forc e field on the pore water
and can be either positive or negative depending on whet her the datum is b el ow or above
the measuring point, r espect ively. Campbe ll (1987) reviews the various techniques for
measuring matric potential and t he type of sensors e mployed; and t he readers are
recommended t o r efer to Passioura (1980) for a more detailed discussion of the m eaning
of matri c potent ial. A reaso nable estim at e o f o smotic po tential c an be derived f rom
measurements of electrical conductivi ty corrected f or water c ontent (Gupta and H anks
1972); howeve r, more reliable measures can b eobtainedbyextractingsoilporewater
and m easuring the osmotic potential directly in a thermocouple psychrometer or
by usi ng the combine d pr es sur e c h ambe r a nd thermocouple psychrometer system of
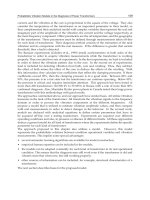
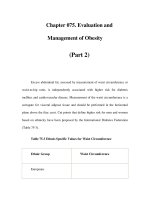
Campbell (1987). W he n the matric, pressure, and gravitational p ot enti al s a re expressed
in unit s o f e nergy p er unit w ei ght (U
wt
), they are generally called ‘‘heads’’ rather than
potentials, a nd they are e quival ent to t he vertical distance between the m ea surement
p o i n t ( e . g . , piezometer intake, tensiometer cup, etc.) and either the free surface water level
(for matric and pressure heads) or the selected reference elevation or datu m (for gravitational
heads) (Figure 69.1). Water flow can be induced by gradients in all four water potentials,
although a gradient in osmotic potential requires the presence of a membrane that is
permeable to water but impermeable to selected solutes and colloids (Or and Wraith 2002).
Methods for measur ing water pote ntial are describ ed in Chapter 71 and include the
piezometer method, the tensiometer method, resistance block methods, and selected
thermocouple psychrometer methods.
(a)
Datum
(water table)
Piezometric surface
Piezometer riser pipe
Manometer
Soil surface
Selectively permeable cup
(to water, not air)
Tensiometer
point of measurement
Well screen
Piezometer
point of measurement
z = 0
(b)
p
m
t
g
g
(usually sea level)
t
FIGURE 69.1. The operating principles of a piezometer (a) and a tensiometer (b). The piezometer
measures pressure potential (c
p
), and the tensiometer measures matric potential (c
m
).
ß 2006 by Taylor & Francis Group, LLC.
69.4 SOIL WATER DESORPTION AND IMBIBITION
Soil water desor ption and imbib ition curves char acterize the rel ationship betwee n soil
volumet ric water cont ent, u
v
[L
3
L
À 3
] (Chapter 72 through Cha pter 74), and pore water
matric head, c
m
[L] (Chapt er 71). The desorption curve (also know n as the water release
characteristic, water retention curve, and soil moisture characteristic) describes the decrease
in u
v
from saturation as c
m
decreases from zero, whereas the imbibition curve describes the
increase in u
v
from dryness as c
m
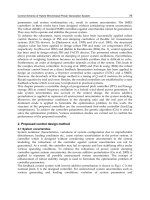
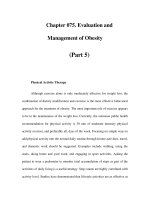
increases from a large negative value (see Figure 69.2).
The two curves generally have different shapes because of hysteretic effects (Hillel 1980);
and when a partially drained soil is rewetted, or when a partially wetted soil is redrained, the
relationship between u
v
and c
m
usually follows an intermediate and nonunique path between
the desorption and imbibition curves (see Figure 69.2). For this reason, the desorption curve
is often referred to as the ‘‘mai n drainage curve’’; the imbibition curve as the ‘‘main wetting
curve’’; and the intermediate curves as ‘‘scanning curves’’ (see Figure 69.2). When the soil
has a relatively uniform and narrow pore size distribution (e.g., structureless sandy soil),
distinct ‘‘air-entry’’ and ‘‘water-entry’’ matric heads can occur on the desorption and
imbibition curves, respectively (Figure 69.2). The air-entry head or value, c
a
[L], is the
pore water matric head where the saturated soil (i.e., u
v
constant and maximum) suddenly
starts to desaturate as a result of decreasing c
m
; and the water-entry head or value, c
w
[L], is
the pore water matric head where an unsaturated soil suddenly saturates as a result of
increasing c
m
. Both c
a
and c
w
are negative, and typically, jc
a
j%2jc
w
j (Bouwer 1978).
Also note that in Figure 69.2 that the saturated volumetric water content on the imbibition
curve (i.e., u
fs
at c
m
¼ 0) is less than the saturated volumetric water content on the
desorption curve (i.e., u
s
at c
m
¼ 0), which is a consequence of air entrapment in soil
pores during the wetting process (Bouwer 1978). As implied above, soil water desorption
Imbibition or main
wetting curve
Scanning
curves
Desorption or main
drainage curve
0
q
fs
q
s
q
+−
a w
FIGURE 69.2. Desorption, imbibition, and scanning curves, u(c), for a hysteretic soil. The arrows
indicate the direction of the drainage and wetting processes. Note that the satur-
ated volumetric water content for the imbibition curve, u
fs
, is less than that for the
desorption curve, u
s
, due to air entrapment upon rewetting. Note also that the
water-entry matric head, c
w
[L], is greater (less negative) than the air-entry matric
head, c
a
[L].
ß 2006 by Taylor & Francis Group, LLC.
and imbib ition is a com plicated proce ss that is difficul t and time-con suming to char acterize
in d etail. Fort unately, it is usually not necessar y to measur e the scann ing curve s and Cha pter
72 through Chapter 74 conse quent ly focus on dete rmination of only the desor ption (main
drainage) curve and the imbibition (main wetting) curve.
69.4.1 APPLICATION OF DESORPTION AND IMBIBITION CURVES
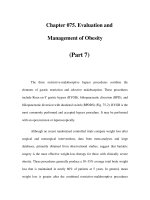
The shape and magnitude of desorption and imbibition curves depends on the number and
size distribution of the soil pores, which in turn depends on texture, porosity, structure,
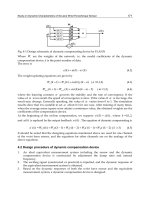
organic matter content, and clay mineralogy. Figure 69.3 gives schematic examples of
desorption curves for a representa tive coarse-textured, unstructured soil (e.g., uniform
sandy soil), and for a representative fine-textured soil (e.g., clayey soil) with and without
structure, where ‘‘structure’’ refers to the presence of aggregates, peds, and macropores
(i.e., large cracks, root channels, worm holes, etc.). Note that the coarse-textured (sandy)
soil retains less water than the fine-textured (clayey) soil (i.e., lower u
v
values), and it also
releases its water in a different manner (i.e., different curve shape). Note also that
soil structure can increase the saturated water content (if the bulk density decreases) and it
can cause the wet-end of the desorption curve to be very steep relative to a structureless
condition when aggregates, peds, and macropores are not present.
Soil water desorption and imbibition curves are important for determining soil pore size
distribution, for interpreting soil strength data, and for determining the transmission and
Structured
clayey soil
Unstructured
clayey soil
Unstructured
sandy soil
0
+
q
s
q
s
q
s
−
FIGURE 69.3. Soil water desorption curves for a ‘‘representative’’ unstructured sandy soil, and
a representative clayey soil with and without structure. u
s
[L
3
L
À3
] is the satur-
ated volumetric water content and c [L] is pore water matric head. Note that
the increase in u
s
for the structured clayey soil relative to the unstructured
clayey soil implies a decrease in soil bulk density. If bulk density remains
constant, the presence of structure changes only the shape of the curve and
not the value of u
s
.
ß 2006 by Taylor & Francis Group, LLC.
storage of flu ids (liquids, gases ) in the soil profile. The sizes of soil pores relevan t to the
storage and transmis sion of fluids are determin ed from desorption and imbib ition curves via
the Kelvin or ‘‘capi llary rise’’ equat ion. Soil strengt h relat ionships , such as cone penet ration
resistanc e and vane shear, are h ighly depend ent on the antecede nt soil water cont ent at the
time o f the mea sureme nt, and must therefore be related to the desorption and imbib ition
curve s befor e deta iled anal yses can be conduc ted. With resp ect to water and solu te
transm ission, the desor ption and imbibition curve s are require d for defin ing the water
capacity relationship in the water transport (Richards) equation, and various solute sorption–
desorption relationships in the solute transport (convection–dispersion) equation. With respect
to water and air storage , the desorption and imb ibition curves are used to determ ine saturated
and field- saturated soil water content s, field capacity water cont ent, permanent wiltin g point
water content , air capacity, and plant- available water capac ity. These water =air storage
para meters and othe r quantitie s derived from these parameter s are defined and briefly
discusse d in the follow ing sectio ns.
69.4.2 WATER AND AIR STORAGE PARAMETERS
The volumetric water content, u
v
[L
3
L
À3
], for a rig id soil (i.e., no shrinkage or swelling) is
defined by
u
v
¼ V
w
=V
b
(69:4)
where V
w
[L
3
] is the volume of soil water per unit bulk volume of dry soil, V
b
[L
3
] (see
Sect ion 6 9.2). When the soil is com pletely saturated (i.e., no entrappe d air), V
w
¼ volume of
pore space and thus u
v
¼ u
s
¼ soil porosity. When the soil is ‘‘field-saturated’’ (entrapped
air present), V
w
< volume of pore space and u
v
¼ u
fs
< soil porosity, usually by 2–5
percentage points (Bouwer 1978). For most field applications where wetting and drying
are involved, u
fs
is a more relevant measure of the maximum soil volumetric water content
than u
s
or porosity because entrapped air is almost always present.
Field water capacity (more commonly known as field capacity, FC) is formally defined as
the amount of water retained in an initially saturated or near-saturated soil after 2–3 days of
free gravity drainage without evaporative loss (Hillel 1980; Townend et al. 2001). For
application purposes, however, FC is usually defined as the equilibrium volumetric water
content, u
FC
, at a specified matric head, c
FC
. For intact soil containing normal field structure,
c
FC
¼À1 m is most often used, although values as high as c
FC
¼À0:5 m have been
recommended for wet soils with a shallow water table, and as low as c
FC
¼À5 m for dry
soils with a very deep water table (Cassel and Nielsen 1986). If the soil has been disturbed
and repacked, use of c
FC
¼À3:3 m is usually considered to provide u
FC
values that are
comparable to intact soil values.
The permanent wilting point (PWP) is defined as the soil water content at which growing
plants wilt and do not reco ver when the evapotranspirative demand is eliminated by
providing a water vapor–saturated atmosphere for at least 12 h (Hillel 1980; Romano and
Santini 2002). Once the soil water decreases to the PWP value, plants are permanently
damaged and may even die if water is not added quickly. In this respect, the PWP water
content also represents the amount of ‘‘plant-unavailable’’ water; i.e., water that is too
strongly held by the soil to be extracted by plant roots. Although the true PWP can vary
widely with plant species, plant growth sta ge, and soil type, it has been found that the
equilibrium volumetric water content, u
PWP
, at the matric head, c
PWP
¼À150 m, is a
ß 2006 by Taylor & Francis Group, LLC.
suitable working definition (Soil Science Society of America 1997). This is because water
content becomes relatively insensitive to matric head (i.e., water content is nearly constant)
in the c
m
À150 m range for most agricultural soils (Romano and Santini 2002).
Plant growth and performance is critically dependent on adequate supplies of air and water in
the root zone. Convenient and popular measures of the soil’s ability to store and provide air
and water for plant use are the so-called air capacity and plant-available water capacity. Air
capacity (AC) is defined as
AC ¼ u
s
À u
FC
(69:5)
and proposed minimum values for adequate root-zone aeration are 0:10 m
3
m
À3
for loamy
soils (Grable and Siemer 1968), 0 :15 m
3
m
À3
for clayey soils (Cockroft and Olsson 1997),
and about 0:20 m
3
m
À3
for horticultural substrates (Verdonck et al. 1983; Bilderback
et al. 2005). Field soils that have AC values appreciably below these minimums are
susceptible to periodic and damaging root-zone aeration deficits. Plant-available water
capacity (PAWC) is defined as
PAWC ¼ FC À PWP (69:6)
and it represents the maximum amount of water that a fully recharged soil can provide to
plant roots. This definition is based on the concept that soil water at c
m
> c
FC
drains
away too quickly to be captured by plant roots, whereas water at c
m
< c
PWP
is held too
strongly by the soil to be extracted by the roots (compare PWP discussion). The propos ed
minimum PAWC for optimum plant growth and minimum susceptibility to droughtiness
is 0.20–0.30 m
3
m
À3
(Verdonck et al. 1983; Cockroft and Olsson 1997; Bilderback
et al. 2005).
Recent research (Olness et al. 1998; Reynolds et al. 2002) suggests that the optimal balance
between root-zone soil water and soil air is achieved in rain-fed crops when
FC=Porosity ¼ 0:66 (69:7)
or alternatively, when
AC=Porosity ¼ 0:34 (69:8)
These criteria are based on the finding that maximum production of crop-available nitrogen
by aerobic microbial mineralization of organic matter occurs when about 66% of the soil
pore space in the root zone is water-filled, or alternatively, when 34% of the pore space is air-
filled (Skopp et al. 1990). The rationale for applying Equation 69.7 and Equation 69.8 to
rain-fed crops is that root-zone soils with these ratios are likely to have desirable water and
air contents (for good microbial production of nitrogen) more frequently and for longer
periods of time (especially during the critical early growing season) than root-zone soils that
have larger or smaller ratios.
69.4.3 DETERMINATION OF DESORPTION AND IMBIBITION CURVES
The generally accepted ‘‘ideal’’ for obtaining soil water desorption and imbibition curves is
to collect simultaneous field-based measurements of volumetric water content, u
v
, and
ß 2006 by Taylor & Francis Group, LLC.
matric head, c
m
, in an undisturbed vertical profile under conditions of ste ady drainage
(des orption) or steady wett ing (imbibi tion). Sever al approache s are availa ble for achieving
this (e.g., Bruce and Lu xmoore 1986), with the most p opular appro ach being the
‘‘instant aneous profile’’ method (see Chapter 83). Sever al factor s inhibit or complicate
the field-bas ed methods , however , includi ng com plex and poorly control led bou ndary
condi tions (e.g., varying water table dept h, strong and v arying temper ature gradient s);
limit ed instrume ntation for determ ining c
m
(e.g., tensiom eters h ave a narr ow opera ting
range and often fail after a period of time ); diffi culty in maint aining cont inuous wett ing or
drainage throughout the soil profile (e.g., periodic rainfa lls can induc e hyst eretic effects);
com plicated and labor-int ensive experiment al setu ps (e.g., installa tion of many pairs of u
v
and c
m
senso rs over a subst antial d epth range with minimum soil distur bance, equipme nt for
appl ying large volumes of water to saturate the soil prof ile, com plex elect ronics and data
logging equipme nt for simul taneous and long-term monit oring of u
v
and c
m
, limit ed abili ty
for spat ial replication) ; and potential ly very long mea surement times (it can take several
weeks to months to obtain adequa te desorption or imbib ition curve ov er the require d soil
dept h because of slow wetting and drainage rates). As a result, exper imental ly dete rmined
desor ption and imbibition curves are usually ob tained in the labo ratory on relatively small
soil cores or columns whe re u
v
and c
m
senso rs are more easily instal led and maintai ned, and
whe re initial and boundar y conditions can be prec isely defined and cont rolled . Desorpt ion
and imbibition curves can also be estimated from basi c soil data via pedotran sfer functions
(see Chapter 84); from flo w experiment s, such as the evaporat ion method (see Chapter 8 1)
and the instantane ous prof ile method (see Cha pter 83); or from inverse mode ling proce dures
(Hopm ans et al. 2002).
Labora tory determin ation of desorption and imbib ition curve s that are represen tative of field
condi tions require s (i) the collec tion of soil core s or colu mns that are large enough to
adequa tely sample the ante cedent soil structure and (ii) use of collection, handl ing, and
analysi s proced ures that maint ain the soil structure intact. Bouma (1983, 1985) sugges ts that
the volume encompas sed by the core =colu mn shoul d include at least 20 soil structura l units
(e.g., peds, worm hole s, abando ned root channe ls, etc.), which is especia lly important for
the c
m
>À 3: 3 m range and if saturated hy draulic conduc tivity (see Chapter 75) is to be
determ ined on the sam e sample . For relative ly structure less sandy soils, the minimum
reco mmended core =column inside diameter and length is on the order of 7.6 cm, whereas
struct ured loamy and clayey soils should use a core leng th and d iameter of at least 10 cm
(Mc Intyre 1974). Th e sample s shoul d be collecte d whe n the soil is near its fie ld capacity
water content, u
FC
, whi ch gener ally makes the soil strong enough to resist comp action and
structural collapse during core=column insertion, but still plastic enough to prevent shattering
and breakage of peds. Recommended procedures for the collection of minimally disturbed soil
samples are given in McIntyre (1974) and Chapter 80. Excavated soil cores should be trimmed
flush with the ends of the sampling cylinder, capped to prevent damage of the core ends,
wrapped in plastic to prevent evaporation, and transported to the laboratory in cushioned
coolers to minimize vibration-induced damage and large temperature-changes. Sample storage
before analysis should be in darkened facilities maintained at 0
C À 4
C , w h ic h i s c ol d e no ug h
to inhibit faunal–bacterial–fungal–algal activity, but not so cold as to cause freezing and ice
lens formation.
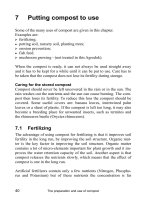
Soil water desorption–i mbibi tion methods are descr ibed in Cha pter 72 through Cha pter 74
and include the tension table, tension plate, and pressure extractor methods (Chapt er 72), the
long colu mn method (Chapter 73), and the dew point psychrom eter method (Chapter 7 4).
The appro ximate matric head ranges of thes e methods are com pared in Figure 69.4.
ß 2006 by Taylor & Francis Group, LLC.
69.5 SATUR ATED HYDRAULI C PROPERTIES
The saturated hydra ulic prope rties are used to descr ibe and predict water move ment in
permeab le porous materia l (e.g., soil, building fill, sand, rock, etc .) when the pore water
pressure (or matric) head in the materia l is grea ter than or equal to the water-en try valu e or
air-entry value (see Sect ion 69.4 for explanat ion of water -entry and air -entry valu es).
The saturated soil hydraulic properties of greates t relevan ce include sat urated hydrauli c
conducti vity, field-sat urated hydra ulic conduc tivity, and the so-called capillarity parame ters
such as matric flux pote ntial, sorpti vity, sorpti ve number, Green–Am pt wetting front
pressure head, and FWM pore size and pore numb er. Saturat ed hydraulic conductivit y,
K
s
[LT
À 1
], and field-sat urated h ydraulic conduc tivity, K
fs
[LT
À 1
], are measur es of the
‘‘ease’’ or ‘‘ability’ ’ of a permea ble porous medium to transm it water. The K
s
parame ter
applies whe n the water -cond ucting pores in the porous med ium are comple tely water -filled
(saturated), and the K
fs
parameter a pplies when t he water-conducting por es contain
entrappe d or encapsul ated bubb les of air or gas (fiel d-saturat ed). Th e capillar ity parame ters
measure various aspec ts of the suct ion or ‘‘capillary pull’’ that u nsaturated soil exer ts on
infiltrat ing water ; and measur ement or estimation of the soil’s capillar ity is usually require d
when K
s
or K
fs
are measur ed in initially unsatura ted soil (e.g., soil above the water table) .
The K
s
and K
fs
para meters are disc ussed belo w and the capillar ity parameter s are discusse d
in Section 69.6 (unsa turated hydra ulic properties ).
The K
s
and K
fs
parame ters are defined by Darcy’ s law, which may be written in the form
q ¼ K
sat
i (69: 9)
where q is the water flu x density thro ugh the porous medium (volume of water flo wing
through a unit cros s-sectiona l area of porous medium per unit time ), i is the hydra ulic head
gradient in the porous medium (di mensionle ss), and K
sat
¼ K
s
or K
fs
, depend ing on whe ther
Matric head, (m)
Dew point
psychrometer
Pressure plate
extractor
High tension
table/plate
Low tension
table/plate
Long column
Soil water content, q (m
3
m
−3
)
q
s
q
r
−10000 −1000 −100 −10 −10
+−
FIGURE 69.4. Approximate matric head ranges of the long column, tension table, tension plate,
pressure extractor, and dew point psychrometer methods for measuring desorp-
tion and imbibition curves. u
s
is the saturated water content and u
r
is the residual
water content. These methods are described in Chapter 72 through Chapter 74.
ß 2006 by Taylor & Francis Group, LLC.
the porous med ium is comple tely saturated or field-satur ated, respect ively. As implied by
Equat ion 69.9, the dimens ions of K
sat
are the same as those for q (i.e., volume of water per
unit cross-sectional area of flow per unit time); however, these dimensions are usually
simplified to length per unit time so that K
sat
may be expressed in the more convenient
(but physically incorrect) units of velocity (i.e., cm s
À1
,cms
À1
,cmh
À1
, m days
À1
, etc.).
The K
sat
value is a constant when the porous medium is rigid, homogenous, isotropic, and
stable; when in-situ biological activity such as earthworm burrowing and algal=fungal
growth are negligible; and when the flowing water maintains constant physical and chemical
properties (e.g., temperature, viscosity, dissolved air content, dissolved salt content, etc.) and
does not chemically or physically interact with the porous medium. The primary factors
determining the magnitude of K
sat
include the physical characteristics of the porous medium
and the physical and chemical characteristics of the flowing water (discussed further below).
The physical characteristics of the porous medium affecting K
sat
include the size distribution,
roughness, tortuosity, shape, and degree of interconnectedness of the water-conducting
pores. For soils, K
sat
increases greatly with coarser texture (larger grain sizes), increasing
numbers of biopores (e.g., worm hole s, root channels), and increasing structure (e.g.,
aggregates, interpedal spaces, shrinkage cracks), as these factors increase the number of
water-conducting pores that are relatively large, straight (i.e., low tortuosity), smooth,
rounded, and interconnected. Soils and other porous media that are coarse-textured,
structured, and bioporous consequently tend to have larger K
sat
values than those that are
fine-textured, structureless, and devoid of biopores. In addition, texture, structure, and
biopores can interact in such a way that it is not uncommon for a fine-textured material
with structure or biopores (e.g., a clay soil with shrinkage cracks or worm holes) to have a
substantially larger K
sat
than a coarse-textured material that is devoid of structure and
biopores (e.g., single-grain sandy soil). An important implication of this texture–structure–
biopore interaction is that the physical condition of the porous medium must be preserved by
the measuring technique in order for the measured K
sat
value to be representative of the
porous medium in its ‘‘natural’’ or in-situ condition.
Hydraulic conductivity is inversely related to water viscosity, which is inversely related to
temperature (Bouwer 1978, p. 43). Consequently, the measured value of K
sat
will increase
with the temperature of the water used; and an increase in water temperature from 10
Cto
25
C will result in a 45% increase in K
sat
, all other factors remaining equal. Temperature
effects can be important if the water used in a field measurement differs greatly in
temperature from that of the resident soil water or groundwater, or if laboratory measurements
of field samples (e.g., intact cores) are conducted at temperatures that differ greatly from
the field temperature. Precise measurements and comparisons of K
sat
values should
therefore always be referenced to a specific water temperature, which is usually 20
C (Bouwer
1978, p. 43), as it yields a water viscosity of nearly 1 cP. Note in passing that the
temperature of ‘‘deep’’ soil water and shallow groundwater is fairly constant and close to
the local mean annual air temperature, for example, about 10
Cat408N–458Nlatitude
(Bouwer 1978, p. 378).
The concentration and speciation of dissolved salts in the water can affect K
sat
through
swelling, flocculation, or dispersion of silt and clay within the porous medium, and through
the creation or dissolution of precipitates. The K
sat
value will usually increase if silt and clay
particles are flocculated, or if precipitates are dissolved, as this tends to increase the size and
interconnectedness of water-conducting pores. Alternatively, formation of precipitates
and swelling=dispersion of silt and clay particles will usually decrease K
sat
through narrowing
and plugging of pores. Reduction in K
sat
most common ly occurs in silt- and clay-rich soils
ß 2006 by Taylor & Francis Group, LLC.
when the cat ionic speciat ion is change d o r the conce ntration of the residen t soil water
is diluted by incoming rainfa ll, irrigation water, or g roundwater . The rel ative conce ntrations
of sodium, cal cium, and mag nesium in solu tion and sorbed onto the porous medium
exchange sites are partic ularly import ant in this respect (Bouw er 1978, p. 44 ). In extrem e
cases, such as when water low in dissolv ed sal ts (e.g., rainw ater) is introdu ced into saline
soil, the resu lting silt and clay dispersion can reduc e K
sat
to virtually zero. The water used for
measuring the K
sat
of a natu ral porous medium should theref ore be either ‘‘na tive’’ water
extracted from the porous medium , or a laboratory ‘‘approx imation, ’’ which has about the
same major ion com position and conce ntrations as the native water . Local munici pal tap
water is often an adequa te appro ximat ion to native soil water , although this shoul d always be
checked as som e muni cipal water treat ment facil ities can change major ion chem istry
radicall y. Distille d or deioniz ed water should never be used for measur ing the K
sat
of a
natural porous medium, as it will almost always induc e cla y swellin g or dispers ion of silt and
clay particle s.
Entrapped bubbl es tend to const rict or block the water-co nducting pores in a porous med ium.
As a resu lt, K
fs
(i.e., field-satur ated K
sat
) is usually less than K
s
(i.e., comple tely saturated
K
sat
) with the degree of reduc tion largely depend ent on the mec hanism responsi ble for
bubble formati on. Bub bles can becom e encap sulated in pores thr ough physi cal entrapment
of residen t air during wett ing of an initially unsatura ted porous medium (Bouw er 196 6); by
accumulat ion of bioga ses (e.g., methan e) as a result of micro bial activit y (R eynolds et al.
1992); and by ‘‘ex solution’’ of dissolv ed air as a resu lt of change s in the temper ature or
chemistr y of the pore water (B ouwer 1978, p. 4 5). Air encap sulation as a resu lt of rapid
wetting (e.g., p onded infiltration) often cause s K
fs
to be on the order of 0: 5 K
s
(Bouw er 1966;
Stephens et al. 1987; Con stantz et al. 1988), while gradu al accumul ation of bioga ses and
exsolved air can cause muc h grea ter reductions (Bouwer 1978; Reynol ds et al. 1992).
Further inf ormation concerni ng the theoretic al basis and othe r aspec ts of K
s
, K
fs
, and their
associated capillar ity parame ters can be obtaine d from Bouwer (1978) , Kooreva ar et al.
(1983), Smith (2002) , Re ynolds and Elrick (2005), and references cont ained therein.
Saturated hydraulic propert y methods are describ ed in Cha pter 75 through Cha pter 79 and
Chapter 84; and they include the const ant and falling head core methods (Chapter 75),
selected const ant and falling h ead well permeame ter methods (Chapter 76), sel ected constant
and falling head ring infiltr ometer methods (Chapt er 77), the auger hole method (Chapter
78), the piez ometer method (Chapter 79), and sel ected estimation methods (Chapt er 84).
69.6 UNSATURATED HYDRAULI C PROPERT IES
Unsaturat ed hydra ulic prope rties are used to descr ibe and predict water movemen t in
permeab le porous mater ial (e.g., soil, buildi ng fill, sand, rock, etc.) that is only partia lly
saturated and has a pore water matric head that is less than the materia l’s air-en try valu e or
water-en try valu e (see Section 69.4 for expl anation of air-en try and water-en try valu es). The
unsaturated hydraulic properties of greatest relevance include unsaturated hydraulic
conductivity, K(c)orK(u) [LT
À1
], sorptivity, S(c) [LT
À1=2
], sorptive number,
a*(c)[L
À1
], flux potential, f(c)[L
2
T
À1
], FWM pore diameter, PD(c) [L], and the number
of FWM pores per unit area, NP(c)[L
À2
]. The K(c)orK(u) parameter quantifies the
ability of an unsaturated porous material to transmit water as a resu lt of a hydraulic head
gradient, while S(c) measures the ability of the material to imbibe water as a result of
capillarity forces (Philip 1957). The a*(c) parameter, on the other hand, indicates the
relative magnitudes of gravity and capillarity forces during unsaturated flow (Raats 1976),
ß 2006 by Taylor & Francis Group, LLC.
while the f ( c) para meter relates to the ‘‘po tential’’ for water flow (G ardner 1958). The
PD( c) parameter represe nts the effective equival ent mean pore size conduc ting water
during const ant head infiltrat ion, and NP( c) indicat es the number of PD( c) pores
that are active (Phi lip 1987). These parame ters and their interr elationshi ps are disc ussed
briefly belo w.
Vertica l water flo w in rigid, homo geneous, v ariably saturat ed porous mater ial (e.g., soil) can
be describ ed by (Rich ards 1931)
@u
@ t
¼
@
@ z
K (c )
@ H
@ z
!
¼
@
@ z
K ( u)
@ H
@ z
!
; H ¼cþ z (69 : 10)
where u [L
3
L
À 3
] is volumetric water content, t[T] is time, K ( c) [LT
À 1
] is the hydraulic
conductivity (K ) versus pore water matric head (c )relationship,K ( u) [LT
À 1
]isthe
hydraulic conductivity (K ) versus volumetric water content ( u) relationship, H [L] is hydraulic
head, and z [L] is elevation or gravitational head above an arbitrary datum (positive upward).
(Note that the ‘‘v’’ and ‘‘m’’ subscripts on u and c, respectively, have been dropped to simplify
the nomenclature.) Equation 69.10 indicates that the rate of water flow through the porous
medium is determined by the magnitude of the hydraulic head gradient, @ H =@ z, and by the
hydraulic conductivity function, K ( c)orK (u). The K (c)orK ( u) term is the porous material’s
water transmissi on relations hip, and it gives the permeabil ity of the p orous mater ial to water
as a functi on of either pore water matric head, c [L], or volumetric water cont ent, u [L
3
L
À 3
].
The K ( c) and K ( u) relat ionships depend strongl y o n the magnitude and shape of the pore
water desorption–i mbibiti on relations hip, u( c)[L
3
L
À 3
], which itself describ es the change in
volumet ric water content with changi ng pore water matric head (Sect ion 69.4). As a result,
the K ( c) and K ( u) relations hips decr ease from the K
sat
max imum (Sect ion 69.5) as c and u
decr ease from their respective max imum valu es at porous med ium saturati on (i. e., c¼ 0 and
u¼u
s
). Through their connec tion with the u( c) relations hip, K (c) and K ( u) depend on the
numb er and size distribut ion of the porous medium pores , which in turn depend on porosity,
struct ure, textur e, organ ic matter content , and clay mineralo gy. Unlik e u( c), however , K (c )
and K ( u) also depend on pore mor phology parame ters such as tor tuosity, roughn ess,
connec tivity, and continuit y. Th ese various depend encies cause K (c ) and K (u)to
change by man y orders of magnitude over the range in c appl icable to plan t grow th
(i.e., %À150 m c 0).
Due to the extreme sensitivity of u nsaturated hydra ulic conduc tivity to pore size and pore
morpho logy, the mag nitude and shape of the K ( c) and K ( u) relations hips change subst an-
tial ly with the textur e and struct ure of the porous med ium. Figur e 69.5 gives schemat ic
exampl es of K ( c) and K ( u) relat ionships for a repr esentativ e ‘‘sandy’ ’ soil, and for a
represe ntative ‘‘loamy’ ’ soil with and without struct ure, where struct ure refers to the
pres ence of aggre gates, peds, cracks, root channe ls, wor m hole s, etc. For conven ience,
the structure d loam was assumed to h ave the same u( c) rel ationship as the unst ructured
loam. Note in these figures that for a rigid (nonswe lling) porous mater ial, K ( c) and K (u) are
max imum and constant whe n the mater ial is saturated, i.e.,
K ( c) ¼ K ( u) ¼ constant ¼ K
sat
; c!c
e
, u¼u
sat
(69 : 11)
whe re K
sat
[LT
À 1
] is the saturated or field-sat urated hydraulic conduc tivity, c
e
[L] is the air-
entry or water-entry matric head, and u
sat
[L
3
L
À3
] is saturated or field-saturated volumetric
water cont ent (see Sect ion 69.4 and Sect ion 69.5). Note also that the near-sa turated hydraulic
ß 2006 by Taylor & Francis Group, LLC.
conductivity relationship in a structured porous medium can change very rapidly (by orders
of magnitude) with only small changes in c or u, and that the hydraulic conductivity of a
fine-textured material with structure can be either greater than or less than the hydraulic
conductivity in a coarse-textured material, depending on the value of c or u. Texture
and structure effects are also illustrated in the K
sat
values, where it is seen that the K
sat
of
the sandy soil is two orders of magnitude greater than the K
sat
of the unstructured
loam (texture effect), but two orders of magnitude less than the K
sat
of the structured loam
(structure effect).
(a)
Pore water pressure head, (cm)
−300 −250 −200 −150 −100 −50 0 50
Hydraulic conducitvity, K( ) (cm s
–1
)
1e− 8
1e− 7
1e− 6
1e− 5
1e− 4
1e− 3
1e− 2
1e− 1
1e+0
Sand
Loam
Structured loam
(b)
Volumetric water content, q (cm
3
cm
−3
)
0.0 0.1 0.2 0.3 0.4 0.5 0.6 0.7
Hydraulic conducitvity, K(q ) (cm s
−1
)
1e− 8
1e− 7
1e− 6
1e− 5
1e− 4
1e− 3
1e− 2
1e− 1
1e+ 0
Sand
Loam
Structured loam
FIGURE 69.5. (a) Hydraulic conductivity, K(c), versus pore water matric (or pressure) head, c
and (b) hydraulic conductivity, K(u), versus volumetric water content, u, for a
representative sandy soil (Sand), and a representative loamy soil with structure
(structured loam) and without structure (loam).
ß 2006 by Taylor & Francis Group, LLC.
The sorptiv ity para meter, S(c ) [LT
À 1 =2
], is related to K ( c) and f( c) by (Phi lip 1957; Whi te
and Sully 1987)
S( c
0
) ¼guc
0
ðÞÀuc
i
ðÞ½
ð
c
0
c
i
K ( c)d c
"#
1 =2
¼guc
0
ðÞÀuc
i
ðÞ½fc
0
ðÞ½
1= 2
;
u( c
i
) u( c
0
) u
s
, c
i
c
0
0
(69 : 12)
whe re it is seen that the matric flu x potential , f( c
0
)[L
2
T
À 1
], is defined by (Gardn er 1 958)
f (c
0
) ¼
ð
c
0
c
i
K ( c)d c; À1<c
i
c
0
0 (69 : 13)
In Equat ion 69.12 and Equation 69.13, c
0
[L] is the pore water matric head at the infiltrat ion
(sorptio n) surface , c
i
[L] is the backgroun d o r antecede nt pore water matric head in the
porous medium at the time of the infiltrat ion mea surement, u( c
0
)[L
3
L
À 3
] is the porous
med ium volumetri c water cont ent at c¼c
0
, u( c
i
)[L
3
L
À 3
] is the porous med ium volumet -
ric water content at c¼c
i
, and g¼ 1:818 is a dimens ionless empirica l constant (Whit e and
Sully 1987) relat ed to the shape of the wett ing (or drainage ) front ( g¼ 1: 818 for wett ing, but
may be smaller for drainage). The shape and magnitude of the S(c
0
) and f(c
0
) relationships
is thus controlled by the shape and magnitude of the K(c) relationship, as well as the
magnitude of c
i
. Figure 69.6 gives the S( c
0
) and f( c
0
) relations hips correspo nding to the
K(c) (and u(c)) relationships for our three representative soils, and it is seen that S(c
0
) and
f(c
0
) are essentially ‘‘subdued replicas’’ of K(c). Note from Equation 69.12 and Equation
69.13, however, that S(c
0
) ¼ f(c
0
) ¼ 0 when u(c
0
) ¼ u(c
i
) or when c
0
¼ c
i
; and that S(c
0
)
and f(c
0
) do not exist for positive pore water pressure heads (i.e., c
p
> 0).
If the K(c) relationship is represented by the Gardner (1958) exponential function
K(c) ¼ K
sat
exp (ac); c 0 (69:14)
then Equation 69.13 becomes
f(c
0
) ¼
K(c
0
) À K(c
i
)
a(c
0
)
!
; c
i
< c
0
, K(c
i
) < K(c
0
) (69:15)
where the ‘‘alpha parameter,’’ a(c
0
)[L
À1
] gives the slope of ln K versus c. For most natural
porous materials at field capacity or dryer, K(c
i
) ( K(c
0
), and Equation 69.15 can conse-
quently be simplified to
f(c
0
) %
K(c
0
)
a*(c
0
)
; K(c
i
) ( K(c
0
) (69:16)
which defines the ‘‘sorptive number,’’ a*(c
0
)[L
À1
]. The a*(c
0
) parameter is generally used
rather than a(c
0
) because it avoids having to determine K(c
i
) in Equation 69.15, which can
be extremely difficult or impossible. Large a(c
0
) and a*(c
0
) values indicate dominance of
the gravitational force (gravity) over the porous medium adsorption forces (capillarity)
during infiltrat ion, whereas small a (c
0
) and a*(c
0
) values indicate the reverse (Raats
1976). The a(c
0
) relationships correspond ing to our three representative soils are given in
ß 2006 by Taylor & Francis Group, LLC.
Figure 69.7 a; and general ly speak ing, a( c
0
) increases as c
0
increases, indicating an increas e
in the import ance of the gravit y com ponent of infiltrat ion rel ative to the capi llarity compon-
ent as the soil gets wetter. Note, however , that the a (c
0
) relat ionships have com plex slopes,
and the sand and unst ructured loam produce curve s with loca l maxima and min ima. This
occurs because a( c
0
) is based on the expone ntial K ( c) functi on (i.e., Equation 69.14) ,
whereas the actual K ( c) relationship s were not expone ntial , especia lly those for the sand
and unstructur ed loam (see Figur e 69.5a). Generally speaking, the closer the K ( c) relation-
ship is to a mono tonic expone ntial functi on (i.e., Equation 69.14), the closer the a(c
0
)
relations hip is to a single constant valu e. Figure 69.7b compare s a*( c
0
)to a( c
0
) for the
(a)
Pore water pressure head, (cm)
−140 −120 −100 −80 −60 −40 −20 0 20
Sorptivity, S( ) (cm s
−1/2
)
0.0001
0.001
0.01
0.1
1
Sand
Loam
Structured loam
(b) Pore water pressure head, (cm)
−140 −120 −100 −80 −60 −40 −20 0 20
Matric flux potential, f( ) (cm
2
s
−1
)
1e−6
1e−5
1e−4
1e−3
1e−2
1e−1
1e+0
Sand
Loam
Structured loam
FIGURE 69.6. (a) Sorptivity, S(c), versus pore water matric (or pressure) head, c, and (b) matric
flux potential, f(c), versus pore water matric head, c, for a representative sandy
soil (sand), and a representative loamy soil with structure (structured loam) and
without structure (loam).
ß 2006 by Taylor & Francis Group, LLC.
structured loam, where it is seen that a*(c
0
) diverges progressively for c
0
< À50 cm.
This occurred because K(c
i
) ¼ K(À260 cm) in this scenario, and the assumption
K(c
i
) ( K(c
0
) became progressively more incorrect as c
0
decreased, resulting in increasing
error in a*(c
0
) with smaller (more negative) c
0
values. The a*(c
0
) parameter (and rela-
tionships based on the a*(c
0
) parameter) must consequently be used with caution when
K(c
i
) is not substantially less than K(c
0
), such as might occur in very wet porous materials,
or in fine-textured materials where K( c ) does not decr ease rapidly with decreasing c.
(a)
(b)
Pore water pressure head, (cm)
Pore water pressure head,
(cm)
−300 −250 −200 −150 −100 −50 0
Alpha parameter, a ( ) (cm
−1
)
0.0001
0.001
0.01
0.1
1
Sand
Loam
Structured loam
−300 −250 −200 −150 −100 −50 0
Alpha, a (y ), or sorptive number, a ∗( ) (cm
−1
)
0.001
0.01
0.1
1
a( )
a∗( )
FIGURE 69.7. (a) Alpha parameter, a(c), versus pore water matric (or pressure) head, c, for a
representative sandy soil (sand) and a representative loamy soil with structure
(structured loam) and without structure (loam) and (b) alpha parameter, a(c), and
sorptive number, a*(c), versus pore water pressure head, c, for the structured
loamy soil.
ß 2006 by Taylor & Francis Group, LLC.
Substituting Equat ion 69.16 into Equat ion 69.12 produces
S( c
0
) ¼g [ u( c
0
) Àu( c
i
)]
K ( c
0
)
a*( c
0
)
!
1 =2
(69: 17)
which show s that the abili ty of a porous medium to imbibe water (i.e., its sorptivity as
indicated by the mag nitude o f S( c
0
)) depend s on the avai lable water -storage capacity
(u( c
0
) Àu( c
i
)), the K ( c) relat ionship, and the a*( c
0
) relat ionship. Hen ce, a porous mater-
ial’s sorpt ivity decreases with increasing ante cedent water content (i.e., decreasing available
water-stor age capac ity), decreasing hydra ulic conduc tivity, and increas ing sorpti ve number.
Note also that the accur acy of Equat ion 69.17 will d epend strong ly on the accuracy of the
a*( c
0
) relationsh ip, as disc ussed above.
The FW M pore diameter, PD( c
0
) [L], is defined as (Phi lip 1 987)
PD( c
0
) ¼
2s K ( c
0
)
r gf (c
0
)
¼
2sa*( c
0
)
r g
(69: 18)
where s [MT
À 2
] is the air–por e water interfacial surf ace tension , r [ML
À 3
] is the pore water
density, and g [LT
À 2
] is the accelerat ion due to gravity. The PD( c
0
) parameter is oft en
referred to as the effective ‘‘equiv alent mea n’’ pore diameter conduc ting water whe n infiltra-
tion occurs at c
0
(Whi te and Sully 1987). It may be mor e accurate, howe ver, to view PD( c
0
)as
an inde x parameter that represe nts the mea n ‘‘wat er-conduc tiveness’’ o f the hydra ulicall y
active pores, rather than an actual pore size. This is becau se the PD( c
0
) parameter is derived
from a flow measur ement (ass ociated with the mea surement of K ( c
0
); Eq uation 69.18 ), and
must conseq uently reflect in some way the combine d sizes, tortuos ities, roughn esse s, and
connectivi ties of all water -conduct ing pores at c¼c
0
(Reynol ds et al. 199 7). Asso ciated with
PD( c
0
) is the ‘‘concen tration’ ’ of pore sizes, NP( c
0
) (number of pores L
À 2
), which may be
derived from Po iseuille’s law for flow in smo oth, cylindr ical capillar y tubes (Philip 1987):
NP( c
0
) ¼
128 mK (c
0
)
r g[PD (c
0
)]
4
(69: 19)
where m [ML
À 1
T
À 1
] is the dy namic viscosi ty of water and the othe r parame ters are as
defined above. The NP( c
0
) parameter is an indicator of the number of hydra ulicall y active
pores per unit area of infiltr ation surface , which have FWM d iameter, PD( c
0
). The relat ion-
ships amo ng PD( c
0
), NP( c
0
), and K (c
0
) for the struct ured loam soil are il lustrated in Figur e
69.8, whe re it is seen that a two-order of mag nitude increase in flow-we ighted mea n pore
diameter , PD( c
0
), correspo nded to about a six- order of mag nitude increas e in K ( c
0
), and
about a four -order of magn itude decr ease in NP( c
0
).
Equation 69.14 through Equation 69.19 also apply whe n mea suring saturat ed flow para m-
eters in unsatura ted porous materia ls (see Se ction 6 9.5). In this case, c
0
is at its maximum
value in the equatio ns (i.e., c
0
¼ 0), and conse quently the K ( c), f( c
0
), a*( c
0
), u( c
0
), S(c
0
),
PD( c
0
), and NP( c
0
) relat ionships becom e max imum-val ued const ants, which are indi cated
by K
sat
(i.e., K
s
or K
fs
), f
m
, a*, u
sat
(i. e., u
s
or u
fs
), S, PD, and NP, resp ective ly. As men tioned
in Sect ion 69.5, the matri c flu x potential ( f
m
), sorpti ve number ( a*), and sorpti vity ( S) are
measures of the capillary suction =p ull or ‘‘c apillarit y’’ that unsat urated hydrop hilic porous
materials exert on infiltrating water. Mathematically, f
m
is the area under the K(c) curve
between c ¼ c
0
¼ 0 and c ¼ c
i
(Equatio n 69 .13); and as a result, the magnitude of a
ß 2006 by Taylor & Francis Group, LLC.
mater ial’s capill arity depend s on the shape and magnitude of the K ( c) curve, and on the
antecede nt pore water matric head, c
i
. Porous media that are coarse-tex tured, struct ured,
biopo rous, or wet conse quently tend to have low er capillar ity (i.e., smaller area under the
K (c) curve) than porous media that are fine-text ured, struct ureless, dry, or devoi d of
biopo res. Furthermor e, all porous med ia (regard less of texture or struct ure) have zero
capillar ity (i. e., f
m
¼ 0) when they are saturated or field-satur ated b ecause under that
condi tion, c
0
¼c
i
¼ 0 in Equation 69.13. If the K (c ) functi on is represe nted by Equat ion
69.14, it can be shown that for porous materials at field capac ity or drier (Me in and Farrell
1974; Scotter et al. 1982; Reynolds et al. 1985; see also Section 69.4):
a%a * ( K
sat
=f
m
) %Àc
À 1
f
; c
f
< 0 <a * (69 : 20)
whe re a*[L
À 1
] is the maxim um sorptive number (for the mater ial in quest ion) and c
f
[L] is
the Green–Am pt wetting fron t matri c head (negative quantity). Nea r-zero c
f
(large a *)
occur s prima rily in porous materia ls that are coarse-tex tured and =or highly struct ured and =or
highly biopo rous, while large negat ive c
f
(small a*) occurs pri marily in mater ials that are
fine-text ured or structure less or devoi d of biopores . When c
0
¼ 0, the S, f
m
, K
sat
, a* , and c
f
para meters are related by
S ¼ [g(u
fs
À u
i
)f
m
]
1=2
¼
g(u
fs
À u
i
)
K
sat
a*
!
1=2
¼ [g(u
i
À u
fs
)K
sat
c
f
]
1=2
(69:21)
where u
fs
[L
3
L
À3
] is the field-saturated volumetric water content (Section 69.4), u
i
[L
3
L
À3
]
is the initial or antecedent volumetric water content, and the other parameters are as
previously defined. Note that in Equation 69.21, S decrease s to zero as u
i
increases to u
fs
,
indicating (as expected) that field-saturated porous material has no ability to absorb or store
Flow-wei
g
hted mean pore diameter, PD( ) (mm)
0.001 0.01 0.1 1 10
K( ) (cm s
−1
) or NP( ) (pores m
−2
)
1e− 8
1e− 7
1e− 6
1e− 5
1e− 4
1e− 3
1e− 2
1e− 1
1e+ 0
1e+ 1
1e+ 2
1e+ 3
1e+ 4
1e+ 5
1e+ 6
1e+ 7
1e+ 8
K( )
NP( )
FIGURE 69.8. Hydraulic conductivity, K(c), and number of FWM pores per unit area, NP(c),
versus FWM pore diameter, PD(c), for the structured loamy soil.
ß 2006 by Taylor & Francis Group, LLC.
additional water . The PD and NP para meters (Equati on 69.18 and Equat ion 69.19, resp ect-
ively) are often used to quant ify tempor al and managem ent-induced change s in porous
medium structure as they relat e to water flow (e.g., Whi te et al. 1992; Reynol ds et al. 1995).
In structure d porous mater ials, it is oft en important to disti nguish betwee n ‘‘matrix’’ flow
parameter s and ‘‘mac ropore’’ flow para meters, given that macropo res (e.g., large cracks,
worm hole s, abando ned root channels , large intera ggregate space s, etc.) can have a substan-
tial eff ect on near-satur ated water flow and solu te transport. Matri x pores are d efined as all
pores that are small enough to remain water-f illed at a specified pore water matric head,
c
mat
[L], whe reas macropo res are pores that are too lar ge to remai n water -filled at c
mat
. The
value of c
mat
is not yet agreed upon (i. e., various values have b een propos ed such as À 3, À 5,
À10 cm); howe ver, growin g exper imental evidence sugges ts that c
mat
¼À10 cm is
appropri ate (Jarvis et al. 2002), which corr esponds to an equi valent p ore diameter of
0.3 mm accor ding to classical capillar y rise theo ry (Or and Wra ith 2002). Using thi s
criterion, all p ores with equival ent diameter s 0:3mm(c c
mat
¼À10 cm) are matrix
pores, whe reas thos e with equival ent diamet ers > 0: 3mm (c>c
mat
¼À10 cm) are macro-
pores. The various ‘‘tot al porous medium’’ flow para meters described above (i.e., Equation
69.11 through Eq uation 69.21 that appl y to all pore siz es) can be recast as matrix flow
parameter s by simply restrictin g c
0
to the range, c
i
<c
0
<c
mat
. Macr opore flow para m-
eters can be simi larly defined by restrictin g c
0
to the range , c
mat
<c
0
< 0; however , the
hydraulic conduc tivity relations hips must be rewritten as
K
p
(c) ¼ K ( c) À K (c
mat
); c
mat
c 0 (69: 22)
K
p
( u) ¼ K ( u) À K [ u( c
mat
)]; u( c
mat
) u u
s
(69: 23)
where the subsc ript ‘‘p’ ’ denot es the macropo re flo w doma in, and K (c ) and K (u) refer to the
total porous med ium (i.e., both matrix pores and macropo res). As a result of thes e
definitions, the flow para meters in the matrix domain are at their max imum valu es whe n
c
0
¼c
mat
; wherea s the flow parameters in the macropo re doma in are either zero
(K
p
( c) ¼ K
p
( u) ¼f( c
0
) ¼ S( c
0
) ¼ 0) or undef ined (PD( c
0
) and NP( c
0
)) when c
0
¼c
mat
.
Figure 69 .9 and Figur e 69.10 illustr ate sel ected flow parameter relations hips for the matrix,
macropo re, and total porous med ium flow doma ins in our repr esentativ e struct ured loam soil.
Note in these figures that the matrix and total porous medium flow parame ters are coin cident
when c
0
c
mat
because the macropo res are emp ty, and thus only the matrix pores are water-
conducti ng. Note also that the macropo re relat ionships produc e com plex patterns and may
have values that are greater than, equal to, or less than the corr esponding matrix and
total porous med ium v alues, depend ing on the v alue of c
0
.
The p rimary physical and chemical factors affecting the above unsat urated flo w parame ters
include porous med ium textur e and structure , pore water viscosi ty, the conce ntration and
speciatio n of dissolv ed salts in the pore water , and porous medium hydrop hobicity. All of
the unsatura ted flow parameter s are h ighly sensi tive to porous med ium texture and structure
(compare Figur e 69.5 thr ough Figure 69.7), and hence measur ing tec hniques must preserve
the porous med ium in its natural =in-situ =ante cedent condition to as great an exte nt as
possible. The effects of pore water viscosity and dissolv ed salts on the u nsaturated flow
parameter s are similar to thos e describ ed for saturated and field-satur ated hydra ulic
conducti vity (see Sect ion 69.5). A hydrop hobic soil is nonw etting (i.e., it partially or
completely repels water rather than attracts water), and this in turn impedes infiltration
because of reduced (or even negative) capillarity. Soil hydrophobicity can be caused by
accumulation of certain naturally water-repelling organic constituents (such as pine tree
ß 2006 by Taylor & Francis Group, LLC.
needles), or by extreme or prolonged drying (such as after a long drought or after a forest
fire), which causes certain organic materials and mineral oxides lining the soil pores
to become partly or completely water-repellent. Hydrophobicity reduces the capillarity
parameters (i.e., f(c
0
), a(c
0
), a*(c
0
), S(c
0
), PD(c
0
), NP(c
0
)) relative to a hydrophilic
(water-wetting) situation, all other factors remaining equal. Although soil hydrophobicity
can be initially strong enough to prevent infiltration of even shallow-ponded water, it usually
breaks down over time, allowing normal soil capillarity to eventually return. Further
information on soil hydrophobicity and its impact s on soil hydraulic processes and properties
(a)
(b)
Pore water pressure head, (cm)
−40 −30 −20 −10 0 10
Hydraulic conductivity, K ( ) (cm s
−1
)
1e− 5
1e− 4
1e− 3
1e− 2
1e− 1
1e+ 0
K
p
( )
K
m
( )
K
t
( )
Pore water pressure head, (cm)
−40 −30 −20 −10 0 10
0.0001
0.001
0.01
0.1
1
S
t
( )
S
m
( )
S
p
( )
Sorptivity, S( ) (cm s
−1/2
)
FIGURE 69.9. For the structured loamy soil: (a) hydraulic conductivity, K(c), versus pore water
matric (or pressure) head, c, in the total soil (K
t
(c)), matrix flow domain, (K
m
(c)),
and macropore flow domain (K
p
(c)) and (b) sorptivity, S(c), versus pore water
pressure head, c, for the total soil (S
t
(c)), matrix flow domain (S
m
(c)), and macro-
pore flow domain (S
p
(c)).
ß 2006 by Taylor & Francis Group, LLC.
can be found in Bauters et al. (1998, 2000), Nieber et al. (2000), and refere nces contain ed
therein.
Unsaturat ed hy draulic prope rty methods are descr ibed in Chapter 80 through Cha pter 84 and
include the laboratory tension infiltrometer (Chapter 80), the evaporation method (Chapter 81),
the field tension infiltrometer (Chapter 82), the instantaneous profile method (Chapter 83), and
selected estimation methods (Chapter 84).
(a)
(b)
Pore water pressure head, (cm)
−40 −30 −20 −10 0 10
FWM pore diameter, PD (mm)
0.0
0.2
0.4
0.6
0.8
1.0
1.2
PD
p
( )
PD
m
( )
PD
t
( )
Pore water pressure head, (cm)
−40 − 30 − 20 − 10 0 10
Number of FWM pores/m
2
(NP)
0
10000
20000
30000
40000
NP
p
( )
NP
m
( )
NP
t
( )
FIGURE 69.10. For the structured loamy soil: (a) FWM pore diameter (PD), versus pore water
matric (or pressure) head, c, in the total soil (PD
t
(c)), matrix flow domain
(PD
m
(c)), and macropore flow domain (PD
p
(c)) and (b) number of FWM pores
per unit area, NP, versus pore water pressure head, c, in the total soil (NP
t
(c)),
matrix flow domain (NP
m
(c)), and macropore flow domain (NP
p
(c)).
ß 2006 by Taylor & Francis Group, LLC.
REFERENCES
Bauters, T.W.J., DiCarlo, D.A., Steenhuis, T.S.,
and Parlange, J Y. 1998. Preferential flow in
water repellent sands. Soil Sci. Soc. Am. J. 62:
1185–1190.
Bauters, T.W.J., Steenhuis, T.S., DiCarlo, D.A.,
Nieber, J.L., Dekker, L.W., Ritsema, C.J., Parlange,
J Y., and Haverkamp, R. 2000. Physics of water
repellent soils. J. Hydrol. 231–232: 233–243.
Bilderback, T.E., Warren, S.L., Owen, J.S.,
and Albano, J.P. 2005. Healthy substrates need
physicals too! HortTechnology 15: 747–751.
Bouma, J. 1983. Use of soil survey data to
select measurement techniques for hydraulic
conductivity. Agric. Water Manage. 6: 177–190.
Bouma, J. 1985. Soil variability and soil survey.
In J. Bouma and D.R. Nielsen, Eds. Proceedings
of Soil Spatial Variability Workshop. PUDOC,
Wageningen, The Netherlands, pp. 130–149.
Bouwer, H. 1966. Rapid field measurement of
air-entry value and hydraulic conductivity of soil
as significant parameters in flow system analysis.
Water Resour. Res. 2: 729–738.
Bouwer, H. 1978. Groundwater Hydrology.
McGraw-Hill, Toronto, ON, Canada.
Bruce, R.R. and Luxmoore, R.J. 1986. Water
retention: Field methods. In A. Klute, Ed.,
Methods of Soil Analysis, Part I—Physical and
Mineralogical Methods. 2nd ed. American Soci-
ety of Agronomy, Madison, WI, pp. 663–683.
Campbell, G.S. 1987. Soil water potential meas-
urement. In R.J. Hanks and R.W. Brown, Eds.,
Proceedings of International Conference on
Measurement of Soil and Plant Water Status,
Vol. 1. Logan, UT, July 1987, pp. 115–119.
Cassel, D.K. and Nielsen, D.R. 1986. Field cap-
acity and available water capacity. In A. Klute,
Ed., Methods of Soil Analysis, Part 1—Physical
and Mineralogical Methods. 2nd ed. American
Society of Agronomy, Madison, WI, pp. 901–926.
Cockroft, B. and Olsson, K.A. 1997. Case study
of soil quality in south-eastern Austrialia:
management of structure for roots in duplex
soils. In E.G Gregorich and M.R. Carter, Eds.,
Soil Quality for Crop Production and Ecosystem
Health. Developments in Soil Science, Vol. 25.
Elsevier, New York, pp. 339–350.
Constantz, J., Herkelrath, W.N., and Murphy, F.
1988. Air encapsulation during infiltration. Soil
Sci. Soc. Am. J. 52: 10–16.
Gardner, W.R. 1958. Some steady-state solutions
of the unsaturated moisture flow equation with
application to evaporation from a water table.
Soil Sci. 85: 228–232.
Grable, A.R. and Siemer, E.G. 1968. Effects
of bulk density, aggregate size, and soil water
suction on oxygen diffusion, redox potentials,
and elongation of corn roots. Soil Sci. Soc. Am.
Proc. 32: 180–186.
Gupta, S.C. and Hanks, R.J. 1972. Influence of
water content of electrical conductivity of the
soil. Soil Sci. Soc. Am. Proc. 36: 855–857.
Hillel, D. 1980. Applications of Soil Physics.
Academic Press, Toronto, ON, Canada.
Hopmans, J.W., Simunek, J., Romano, N., and
Durner, W. 2002. Simultaneous determination
of water transmission and retention properties:
inverse methods. In J.H. Dane and G.C. Topp,
Eds., Methods of Soil Analysis, Part 4—
Physical Methods, Soil Science Society of
America, Madison, WI, pp. 963–1004.
Jarvis, N.J., Zavattaro, L., Rajkai, K., Reynolds,
W.D., Olsen, P A., McGechan, M., Mecke, M.,
Mohanty, B., Leeds-Harrison, P.B., and Jacques, D.
2002. Indirect estimation of near-saturated
hydraulic conductivity from readily available soil
information. Geoderma 108: 1–17.
Koorevaar, P., Menelik, G., and Dirksen, C. 1983.
Elements of Soil Physics. Elsevier, New York,
228 pp.
McIntyre, D.S. 1974. Soil sampling techniques
for physical measurements. In J. Loveday, Ed.,
Methods for Analysis of Irrigated Soils. Tech.
ß 2006 by Taylor & Francis Group, LLC.