High Performance Computing in Remote Sensing - Chapter 4 pptx
Bạn đang xem bản rút gọn của tài liệu. Xem và tải ngay bản đầy đủ của tài liệu tại đây (1.88 MB, 27 trang )
Chapter 4
Parallel Implementation of the ORASIS
Algorithm for Remote Sensing Data Analysis
David Gillis,
Naval Research Laboratory
Jeffrey H. Bowles,
Naval Research Laboratory
Contents
4.1 Introduction 70
4.2 Linear Mixing Model 71
4.3 Overview of the ORASIS Algorithms 72
4.3.1 Prescreener 73
4.3.1.1 Exemplar Selection 74
4.3.1.2 Codebook Replacement 79
4.3.2 Basis Selection 80
4.3.3 Endmember Selection 81
4.3.4 Demixing 82
4.3.4.1 Unconstrained Demix 83
4.3.4.2 Constrained Demix 83
4.4 Additional Algorithms 83
4.4.1 ORASIS Anomaly Detection 83
4.4.2 N-FINDR 84
4.4.3 The Stochastic Target Detector 86
4.5 Parallel Implementation 86
4.5.1 ORASIS Endmember Selection 87
4.5.2 N-FINDR Endmember Selection 88
4.5.3 Spectral Demixing 89
4.5.4 Anomaly Detection 89
4.6 Results 90
4.7 Conclusions 92
4.8 Acknowledgments 94
References 94
69
© 2008 by Taylor & Francis Group, LLC
70 High-Performance Computing in Remote Sensing
ORASIS (the Optical Real-Time Adaptive Spectral Identification System) is a series
of algorithms developed at the Naval Research Lab for the analysis of HyperSpectral
Image (HSI) data. ORASIS is based on the Linear Mixing Model (LMM), which
assumes that the individual spectra in a given HSI scene may be decomposed into a
set of in-scene constituents known as endmembers. The algorithms in ORASIS are
designed to identify the endmembers for a given scene, and to decompose (or demix)
the scene spectra into their individual components. Additional algorithms may be
used for compression and various post-processing tasks, such as terrain classification
and anomaly detection. In this chapter, we present a parallel version of the ORASIS
algorithm that was recently developed as part of a Department of Defense program
on hyperspectral data exploitation.
4.1 Introduction
A casual viewing of the recent literature reveals that hyperspectral imagery is be-
coming an important tool in many disciplines. From medical and military uses to
environmental monitoring and geological prospecting the power of hyperspectral im-
agery is being shown. From a military point of view, the primary use of hyperspectral
data is for target detection and identification. Secondary uses include determination
of environmental products, such as terrain classification or coastal bathymetry, for
the intelligence preparation of the battlespace environment. The reconnaissance and
surveillance requirements of the U.S. armed forces are enormous. Remarks at an in-
ternational conference by General Israel put the requirements at a minimum of one
million square kilometers per day thatneedto be analyzed. Usually, this work includes
the use of high resolution panchromatic imagery, with analysts making determinations
based on the shapes of objects in the image. Hyperspectral imagery and algorithms
hold the promise of assisting the analyst by making determinations of areas of interest
or even identification of militarily relevant objects using spectral information with
spatial information being of secondary importance.
Both the power and the pitfalls of hyperspectral imaging originate with the vast
amount of data that is collected. This data amount is a consequence of the detailed
measurements being made. For example, given a sensor with a 2 meter ground sample
distance (GSD) and a spectral range of 400 to 1000 nanometers (with a 5 nanometer
spectral sampling), a coverage area of 1 square kilometer produces approximately
57 MB of hyperspectral data. In order to meet the million square kilometer require-
ment, a hyperspectral sensor would have to produce up to 57 terabytes per day. This is
truly a staggering number. Only by automating the dataprocessing,and by using state-
of-the-art processing capability, will there be any chance of hyperspectral imagery
making a significant contributiontomilitaryneedsinreconnaissanceandsurveillance.
In order to deal with the large amounts of data in HSI, a variety of new algorithms
have appeared in recent years. Additionally, advanced computing systems continue
© 2008 by Taylor & Francis Group, LLC
Parallel Implementation of the ORASIS Algorithm 71
to improve processing speed, storage, and display capabilities. This is particularly
true of the high-performance computing (HPC) systems.
One common technique used in hyperspectral data analysis is the Linear Mixing
Model (LMM). In general terms (details are given in the next section), the LMM
assumes that a given spectrum in a hyperspectral image is simply the weighted sum
of the individual spectra of the components present in the corresponding image pixel.
If we assume thatthe total number of major constituents in the scene (generally known
as the scene endmembers) is smaller than the number of bands, then it follows that the
original high-dimensional data can be projected into a lower-dimensional subspace
(one that is spanned by the endmembers) with little to no loss of information. The
projected data may then be used either directly by an analyst and/or fed to various
other post-processing routines, such as classification or targeting.
In order to apply the LMM, the endmembers must be known. There have been
a number of different methods for determining endmembers presented in the litera-
ture [1], including Pixel Purity [2], N-FINDR [3], and multidimensional morpholog-
ical techniques [4]. The Optical Real-Time Adaptive Spectral Identification System
(ORASIS) [5] is a series of algorithms that have been developed to find endmembers,
using no a priori knowledge of the scene, capable of operating in (near) real-time.
In addition to the main endmember selection algorithms, additional algorithms allow
for compression, constrained or unconstrained demixing, and anomaly detection.
The original ORASIS algorithm was designed to run in scalar (single-processor)
mode. Recently, we were asked to develop a parallel, scalable version of the ORASIS,
as part of a Department of Defense Common High-Performance Computing Software
Support Initiative (CHSSI) program [6]. In addition to ORASIS, this project included
the development of parallel versions of N-FINDR and two LMM-based anomaly
detection routines. In this chapter, we review the details of the algorithms involved in
this project, and discuss the modifications that were made to allow them to be run in
parallel. We also include the results of running our modified algorithms on a variety
of HPC systems.
The remainder of this chapter is divided into six sections. In Section 4.2 we present
the mathematical formalities of the linear mixing model. In Sections 4.3 and 4.4 we
give a general overview of the (scalar) ORASIS and the anomaly detection and N-
FINDR algorithms, respectively, used in this project. In Section 4.5 we discuss the
modifications that were made to the scalar algorithms in order to be run in parallel
mode, and present the computational results of our modifications in 4.6. We then
present our conclusions in 4.7.
4.2 Linear Mixing Model
The linear mixing model assumes that each spectrum in a given hyperspectral image
may be decomposed into a linear combination of the scene’s constituent spectra,
generally referred to as endmembers. Symbolically, let l be the number of spectral
bands, and consider each spectrum as a vector in l-dimensional space. Let E
j
be the
© 2008 by Taylor & Francis Group, LLC
72 High-Performance Computing in Remote Sensing
l-dimensional endmember vectors, k be the number of constituents in the scene, and
j = 1 ···k. Then the model states that each scene spectrum s may be written as the
sum
s =
k
j=1
α
j
E
j
+ N (4.1)
where α
j
is the abundance of the j
th
component spectrum E
j
, and N is an
l-dimensional noise vector. Intuitively, the α
j
’s represent the amount of each con-
stituent that is in a given pixel, and are often referred to as the abundance (or mixing)
coefficients. For physical reasons, one or both of the following constraints (respec-
tively, sum-to-one and nonnegativity) are sometimes placed on the α
j
’s:
k
j=1
α
j
= 1 (4.2)
α
j
≥ 0
(4.3)
Once the endmembers for a given scene are known (either by ORASIS or some
other method), the abundance coefficients may be estimated using a least squares
technique, a process generally known as demixing. If no constraints are placed on
the coefficients, then this calculation reduces to a simple (and fast) matrix-vector
product, as does the case involving the sum-to-one constraint (4.2). In the case of the
nonnegativity constraint (4.3), the coefficients can only be found by using numerical
optimization techniques. In this chapter, we consider only the unconstrained and
nonnegative constrained problems.
After demixing, each of the l-dimensional spectra from the original scene may be
replaced by the k-dimensional demixed spectra. In this way, a set of grayscale images
(generally known as either fraction planes orabundance planes) is constructed, where
each pixel in the image is given by the abundance coefficient of the corresponding
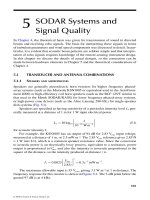
spectra for the given endmember. As a result, the fraction planes serve to highlight
groups of similar image spectra in the original scene. An example of this is given
in Figure 4.1, which shows a single band of a hyperspectral image taken at Fort AP
Hill with the NVIS sensor, along with two of the fraction planes created by ORASIS.
Also, since the number of endmembers is generally much smaller than the original
number of bands, the fraction planes retain the significant information in the scene
but with a large reduction in the amount of data.
4.3 Overview of the ORASIS Algorithms
In its most general form, ORASIS is a collection of algorithms that work together
to produce a set of endmembers. The first of these algorithms, the prescreener, is
used to ‘thin’ the data; in particular, the prescreener chooses a subset of the scene
© 2008 by Taylor & Francis Group, LLC
Parallel Implementation of the ORASIS Algorithm 73
(a) (b) (c)
Figure 4.1 Data from AP Hill. (a) Single band of the original data. (b) (c) Fraction
planes from ORASIS processing.
spectra (known as the exemplars) that is used to model the data. In our experience,
up to 95% of the data in a typical scene may be considered redundant (adding no
additional information) and simply ignored. The prescreener is used to reduce the
complexity and computational requirements of the subsequent ORASIS processing,
as well as acting as a compression algorithm. The second step is the basis selection
module, which determines an optimal subspace that contains the exemplars. The
existence of such a subspace is a consequence of the linear mixing model. Once
the exemplars have been projected into the basis subspace, the endmember selection
algorithm is used to actually calculate the endmembers for the scene. This algorithm,
which we call the shrinkwrap, intelligently extrapolates outside the data set to find
endmembers that may be closer to pure substances than any of the spectra that exist
in the data. Large hyperspectral data sets provide the algorithm with many examples
of the different mixtures of the materials present, and each mixture helps determine
the makeup of the endmembers. The last step in ORASIS is the demixing algorithm,
which decomposes each spectrum in the original scene into a weighted sum of the
endmembers.
In this section we discuss the family of algorithms that make up ORASIS. This
section is focused primarily on the original (scalar) versions of ORASIS; a discussion
of the modifications made to allow the algorithms to run in parallel mode is given in
Section 4.4.
© 2008 by Taylor & Francis Group, LLC
74 High-Performance Computing in Remote Sensing
4.3.1 Prescreener
The prescreener module in ORASIS has two separate but related functions. The first,
which we denote ”exemplar selection,” is to replace the relatively large set of spectra
in the original scene with a smaller representative set, known as the exemplars. The
reason for doing this is that, by choosing a small set of exemplars that faithfully rep-
resents the image data, subsequent processing can be greatly sped up, often by orders
of magnitude, with little loss in precision of the output. The second function of the
prescreener, which we denote codebook replacement, is to associate each image spec-
trum withexactly one memberoftheexemplar set.Thisis done forcompression.By re-
placing the original high-dimensional image spectra with an index to an exemplar, the
total amount of data that must be stored to represent the image can be greatly reduced.
The basic concepts used in the prescreener are easy to understand. The exemplar
set is initialized by adding the first spectrum in a given scene to the exemplar set. Each
subsequent spectrum in the image is then compared to the current exemplar set. If
the image spectrum is ‘sufficiently similar’ (meaning within a certain spectral ‘error’
angle), then the spectrum is considered redundant and is replaced, by reference, by
a member of the exemplar set. If not, the image spectrum is assumed to contain new
information and is added to the exemplar set. This process continues until every image
spectrum has been processed.
The prescreener module can thus be thought of as a two-step problem; first, the
exemplar selection process, is to decide whether or not a given image spectrum is
‘unique’ (i.e., an exemplar). If not, the second step (codebook replacement) is to find
the best ‘exemplar’ to represent the spectrum. The trick, of course, is to perform
each step as quickly as possible. Given the sheer size of most hyperspectral images,
it is clear that a simple brute-force search and replace method would be quickly
overwhelmed. The remainder of this subsection discusses the various methods that
have been developed to allow the prescreener to run as quickly as possible (usually in
near-real-time). In ORASIS, the two steps of the prescreener are intimately related;
however, for ease of exposition, we begin by examining the exemplar selection step
separately, followed by a discussion of the replacement process.
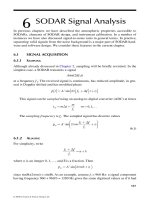
It is worth noting that the number of exemplars produced by the prescreener is a
complicated function of instrument SNR, scene complexity (which might be viewed
as a measure of how much hyperspectral ‘space’ the data fill), and processing error
level desired (controlled by the error angle mentioned above). Figure 4.2 provides an
example of how the number of exemplars scales with the error angle. This scaling is
an important aspect of the porting of the ORASIS to the HPC systems. As discussed
in later sections, the exponential increase in the number of exemplars as the error
angle decreases creates problems with our ability to parallelize the prescreener.
4.3.1.1 Exemplar Selection
The exemplar selection algorithm selects a subset of spectra (known as the exemplars)
from the image that is used to represent the image. Let {X
1
, X
2
, ···, X
N
} represent
the image spectra, where N is the total number of pixels in the image. The exemplar
set is initialized by setting the first exemplar E
1
equal to the first image spectrum X
1
.
© 2008 by Taylor & Francis Group, LLC
Parallel Implementation of the ORASIS Algorithm 75
Cuprite (reflectance)
Cuprite (radiance)
Florida Keys
Los Angeles
Forest Radiance
60
50
20
10
0
0 0.5 1 1.5 2
Exemplar Error Angle (degrees)
Exemplar Percentage
2.5 3 3.5 4 4.5 5
30
40
Figure 4.2 The number of exemplars as a function of the error angle for various
hyperspectral images.
For each of the remaining image spectrum, the spectrum X
i
is compared to the current
set of exemplars E
1
, ···, E
m
to see if it is ‘sufficiently similar’ (as defined below)
to any member of the set. If not, the image spectrum is added to the exemplar set:
E
m+1
= X
i
. Otherwise, the spectrum is considered to be spectrally redundant and is
replaced by a reference to the matching exemplar. This process continues until every
spectrum in the image has either been assigned to the exemplar set or given an index
into this set.
By ‘sufficiently similar’ we simply mean that the angle θ (X
i
, E
j
) between the
image spectrum X
i
and the exemplar E
j
must be smaller than some predetermined
error angle θ
T
. Recall that the angle between any two vectors is defined as θ(X
i
, E
j
) =
cos
−1
|X
i
,E
j
|
X
i
·E
j
, where X
i
, E
j
is the standard (Euclidean) vector inner (or dot) prod-
uct, and X
i
is the standard (Euclidean) vector norm. It follows that an image
spectrum is rejected (not added to the exemplar set) only if θ(X
i
, E
j
) ≤ θ
T
for some
exemplar E
j
. If weassumethatthevectors havebeennormalizedto unit norm, then the
rejection condition for an incoming spectrum becomes simply |X
i
, E
j
| ≥ cos
−1
θ
T
.
Note that the inequality sign is reversed, since the cosine function is decreasing on
the interval (0, π).
The easiest approach to calculating the exemplar set would be a simple brute-
force method where the entire set of angles between the candidate image spectrum
© 2008 by Taylor & Francis Group, LLC
76 High-Performance Computing in Remote Sensing
and each member of the exemplar set is calculated and the minimum found. Given
that the typical hyperspectral image contains on the order of 100,000 pixels (and
growing), this approach would simply take far too long; thus, faster methods needed
to be developed. The basic approach ORASIS uses to speed up the processing is to try
to reduce the actual number of exemplars that must be checked in order to decide if a
match is possible. To put this another way, instead of having to calculate the angle for
each and every exemplar in the current set, wewould like to be able toexclude as many
exemplars as possible beforehand, and calculate angles only for those (hopefully few)
exemplars that remain. In order to do this, we use a set of ‘reference vectors’ to define
a test that quickly (i.e., in fewer processing steps) allows us to decide whether a given
exemplar can possibly match a given image spectrum. All of the exemplars that fail
this test can then be excluded from the search, without having to actually calculate the
angle. Any exemplar that passes the test is still only a ‘possible’ match; the angle must
still be calculated to decide whether the exemplar does actually match the candidate
spectrum.
To define the reference vector test, suppose that we wish to check if the angle
θ(X, E) between two unit normalized vectors, X and E, is below some threshold θ
T
.
Using the Cauchy-Schwarz inequality, it can be shown [5] that
θ(X, E) ≤ θ
T
⇔ σ
min
≤E, R≤σ
max
(4.4)
where
σ
min
=X, R−
2(1 − cos(θ
T
))
σ
max
=X, R+
2(1 − cos(θ
T
))
and R isan arbitrary unit normalized vector. Toputthisanotherway, to testwhetherthe
angle between two given vectors is sufficiently small, we can choose some reference
vector R, calculate σ
min
, σ
max
and E, R, and check whether or not the rejection
condition (Eq. 4.4) holds. If not, then we know that the vectors X and E cannot be
within the threshold angle θ
T
. We note that the converse does not hold.
Obviously, the above discussion is not of much use if only a single angle needs
to be checked. However, suppose we are given two sets of vectors X
1
, ···, X
n
(the
candidates) and E
1
, ···, E
m
(the exemplars), and assume that for each X
i
we would
like to see if there exists some E
j
such that the angle between them is smaller than
some threshold θ
T
. Using the above ideas, we choose a reference vector R with
R=1 and define σ
i
=
E
j
E
j
, R, for each exemplar E
i
. By renumbering the
exemplars, if necessary, we may assume that σ
1
≤ σ
2
≤···≤σ
m
.
To test the candidate vector X
i
we calculate
σ
i
min
=X
i
, R−
2 − (1 −cos(θ
T
))
σ
i
max
=X
i
, R+
2 − (1 −cos(θ
T
))
By the rejection condition (Eq. 4.4), it follows that the only exemplars that can
be within the threshold angle are those whose sigma value σ
j
lies in the interval
© 2008 by Taylor & Francis Group, LLC
Parallel Implementation of the ORASIS Algorithm 77
[σ
i
min
,σ
i
max
]; we call this interval the possibility zone for the vector X
i
. All other
exemplars can be immediately excluded. Assuming that the reference vector is chosen
so that the sigma values are sufficiently spread out, and that the possibility zone for
a given candidate is relatively small, then it is often possible using this method to
significantly reduce the number of exemplars that need to be checked.
The preceding idea can be extended to multiple reference vectors as follows. Sup-
pose that R
1
, ···, R
k
is an orthonormal set of vectors, and let X=E=1. Then
X and E can be written as
X =
k
i=1
α
i
R
i
+ α
⊥
R
⊥
E =
k
i=1
σ
i
R
i
+ σ
⊥
S
⊥
where α
i
=X, R, σ
i
=E, R, and R
⊥
, S
⊥
are the residual vectors of X and E,
respectively. In particular, R
⊥
, S
⊥
have unit norm and are orthogonal to the subspace
defined by the R
i
vectors. It follows that the dot product of X and E is given by
X, E=
α
i
σ
i
+ α
⊥
σ
⊥
R
⊥
, S
⊥
.
By the Cauchy-Schwartz inequality, R
⊥
, S
⊥
≤R
⊥
·S
⊥
=1, and by the
assumption that X and E have unit norm
α
⊥
=
1 −
α
2
i
σ
⊥
=
1 −
σ
2
i
.
If we define the projected vectors α
p
= (α
1
, ···,α
k
,α
⊥
) and σ
p
= (σ
1
, ···,
σ
k
,σ
⊥
), then the full dot product satisfies X, E≤
α
i
σ
i
+ α
⊥
σ
⊥
≡α
p
,σ
p
.
This allows us to define a multizone rejection condition that, as in the single ref-
erence vector case, allows us to exclude a number of exemplars without having to
do a full dot product comparison. The exemplar search process becomes one of first
checking that the projected dot product α
p
,σ
p
is below the rejection threshold. If
not, there is no need to calculate the full dot product, and we move on to the next
exemplar. The trade-off is that each of the reference vector dot products must be taken
before using the multizone rejection test. In our experience, the number of reference
zone dot products (we generally use three or four reference vectors) is generally much
smaller than the number of exemplars that are excluded, saving us from having to
calculate the full band exemplar/image spectra dot products, and thus justifying the
use of the multizone rejection criterion. However, the overhead does limit the number
of reference vectors that should be used.
We note that the choice of reference vectors is important in determining the size
of the possibility zone, and therefore in the overall speed of the prescreener. The
principal components of the exemplars tend to give the best results, which is not
surprising since the PCA eigenvectors provide by construction the directions that
© 2008 by Taylor & Francis Group, LLC
78 High-Performance Computing in Remote Sensing
50
45
40
35
30
25
Number of Exemplars
Projected Exemplars (PC 1)
20
15
10
5
–0.23
–0.023
0.18
0.39
0.59
0.29
0.18
0.073
–0.034
–0.13
0.39
0.29
Projec
ted Exemplars (PC 2)
0.18
0.073
–0.034
–0.13
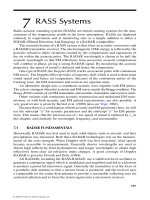
Figure 4.3 Three-dimensional histogram of the exemplars projected onto the first
two reference vectors.
maximize the variance ofthe projected exemplars. In the prescreener, the PCA vectors
are calculated on the fly using a weighted exemplar substitution method to calculate
the (noncentered) covariance matrix and then the eigenvectors. Experience has shown
that sufficiently accurate directions can be determined using only the first hundred
or so exemplars. Conceptually, the use of PCA eigenvectors for the reference vectors
assures that a grass spectrum is compared only to exemplars that look like grass and
not to exemplars that are mostly water, for example.
An example of the power of the possibility zone is given in Figure 4.3, which shows
a histogram of aset of exemplars projected onto two reference vectors (in this example
the reference vectors are the first two principal components of the exemplars). Using
the multizone rejection condition, only the highlighted (lighter colored) exemplars
need to be fully tested for the given candidate image spectrum. All other exemplars
can be immediately excluded, without having to actually calculate the angle between
them and the candidate.
The singleandmultizonerejection conditions allow ustoquicklyreduce the number
of exemplars that must be compared to an incoming image spectrum to find a match.
We note that each test uses only the spectral information of the exemplars and image
spectra; however, hyperspectral images typically exhibit a large amount of spatial
homogeneity. As a result, neighboring pixels tend to be spectrally similar. In terms of
© 2008 by Taylor & Francis Group, LLC
Parallel Implementation of the ORASIS Algorithm 79
exemplar selection, this implies that if two consecutive pixels are rejected, then there
is a reasonable chance that they both matched the same exemplar. For this reason,
we keep a dynamic list (known as the popup stack) of the exemplars that were most
recently matched to an image spectrum. Before applying the rejection conditions, a
candidate image spectrum is compared to the stack to see if it matches any of the
recent exemplars. This list is continuously updated, and should be small enough to
be quickly searched but large enough to capture the natural scene variation. In our
experience, a size of four to six works well; the current version of ORASIS uses a
five-element stack.
4.3.1.2 Codebook Replacement
In addition to exemplar selection, the second major function of the prescreener is the
codebook replacement process, which substitutes each redundant (i.e., non-exemplar)
spectrum in a given scene with an index to one of the exemplar spectra. By doing so,
the high-dimensional image spectra may be replaced by a simple scalar (the index),
thus greatly reducing the amount of data that must be stored. In the compression
community, this is known as a vector quantization compression scheme. We note
that this process only affects how the image spectra pair up with the exemplars, and
does not change the spectral content of the exemplar set. Thus, it does not affect any
subsequent processing, such as the endmember selection stage.
In exemplar selection, each new candidate image spectrum is compared to the list
of ‘possible’ matching exemplars. A few of these candidate spectra will not ‘match’
any of the exemplars and will become new exemplars. However, the majority of the
candidates will match at least one of the exemplars and be rejected as redundant.
In these cases, we would like to replace the candidate with a reference to the ‘best’
matching exemplar, for some definition of best.
In ORASIS, there are a number of different ways ofdoing this replacement. For this
project, we implemented two replacement strategies, which we denote ‘first match’
and ‘best fit.’ Wenote for completeness that other replacementstrategies are available;
however, they were not implemented in this version of the code.
The ‘first match’ strategy simply replaces the candidate spectrum with the first
exemplar within the possibility zone that it matches. This is by far the easiest and
fastest method, and is used by default.
The trade-off for the speed of the first match method is that the first matching
exemplar may not be the best, in the sense that there may be another exemplar that
is closer (in terms of difference angles) to the candidate spectrum. Since the search
is stopped at the first matching exemplar, the ‘better’ matching exemplar will never
be found. In a compression scenario, this implies that the final amount of distortion
from using the first match is higher than it could be if the better matching exemplar
was used.
To overcome the shortcomings of the first match method, the user has the option
of the ‘best fit’ strategy, which simply checks every single exemplar in the possibility
zone and chooses theexemplar that is closest to the candidate.This method guarantees
that the distortion between the original and compressed images will be minimized.
© 2008 by Taylor & Francis Group, LLC
80 High-Performance Computing in Remote Sensing
The obvious drawback is that this approach can take much longer than the simple first
match method. Since, as we noted earlier, the codebook replacement does not affect
any steps later in the program, we use the best fit strategy only when compression is
a major concern in the processing.
4.3.2 Basis Selection
Once the prescreener has been run and the exemplars calculated, the next step in
the ORASIS algorithm is to define an appropriate, low-dimensional subspace that
containstheexemplars. Onewaytointerpretthe linearmixingmodel (Eq. 4.1)isthat, if
we ignore noise, then every image spectrum may be written as a linear combination of
the endmember vectors. It follows that the endmembers define some subspace within
band space that contains the data. Moreover, the endmembers are, in mathematical
terms, a basis for that subspace. Reasoning backwards, it follows that if we can find
some low-dimensional subspace that contains the data, then we simply need to find
the ‘right’ basis for that subspace to find the endmembers. Also, by projecting the data
into this subspace, we can reduce both the computational complexity (by working in
lower dimensions) as well as the noise.
The ORASIS basis selection algorithm constructs the desired subspace by building
up a set of orthonormal basis vectors from the exemplars. At each step, a new dimen-
sion is added until the subspace contains the exemplar set, up to a user-defined error
criterion. The basis vectors are originally chosen from the exemplar set, and then they
orthonormalized using a Gramm-Schmidt-like procedure (we note for completeness
that earlier ORASIS publications have referred to the basis selection algorithm as
a ‘modified Gramm-Schmidt procedure.’ We have since learned that this term has
a standard meaning in mathematics that is unrelated to our procedure, and we have
stopped using this phrase to describe the algorithm.)
The algorithm begins by finding the two exemplars E
i(1)
, E
i(2)
that have the largest
angle between them. These exemplars become known as ‘salients,’ and the indices
i(1) and i(2) are stored for use later in the endmember selection stage. The first
two salients are then orthonormalized (via Gramm-Schmidt) to form the first two
basis vectors B
1
and B
2
. Next, the set of exemplars is projected down into the two-
dimensional subspace (plane) spanned by B
1
and B
2
, and the residual (distance from
the original to the projected spectrum) is calculated for each exemplar. If the value of
the largest residual is smaller than some predefined error threshold, then the process
terminates. Otherwise, the exemplar E
i(3)
with the largest residual is added to the
salient set, and the index is saved. This exemplar is orthonormalized to the current
basis set to form the third basis vector B
3
. The exemplars are then projected into the
three-dimensional subspace spanned by {B
1
, B
2
, ···, B
k
} and the process repeated.
Additional basis vectors are added until either a user-defined error threshold is reached
or a predetermined maximum number of basis vectors has been chosen.
At the end of the basis selection process, there exists a k-dimensional subspace
that is spanned by the basis vectors {B
1
, B
2
, ···, B
k
}, and all of the exemplars have
been projected down into this subspace. As we have noted, under the assumptions of
© 2008 by Taylor & Francis Group, LLC
Parallel Implementation of the ORASIS Algorithm 81
the linear mixing model, the endmembers must also span this same space. It follows
that we are free to use the low-dimensional projected exemplars in order to find the
endmembers. The salients {E
i(1)
, E
i(2)
, ···, E
i(k)
} are also saved for use in the next
step, where they are used to initialize the endmember selection algorithm.
It is worthnotingthatthebasisalgorithmdescribed above guaranteesthatthelargest
residual (or error) is smaller than some predefined threshold. In particular, ORASIS
will generally include all outliers, by increasing the dimensionality of the subspace
until it is large enough to contain them. This is by design, since in many situations
(e.g., target and/or anomaly detection) outliers are the objects of most interest. By
comparison, most statistically based methods (such as Principal Component Analysis)
are designed to exclude outliers(which by definition lie in the tails of the distribution).
One problem with our inclusive approach is that it can be sensitive to noise effects and
sensor artifacts; however, this is usually avoided by having the prescreener remove
any obviously ‘noisy’ spectra from the scene.
We note for completeness that newer versions of ORASIS include options for
using principal components as a basis selection scheme, as well as an N-FINDR-like
algorithm for improving the original salients. Neither of these modifications were
used in this version of the code.
4.3.3 Endmember Selection
The next stage in the ORASIS processing is the endmember selection algorithm,
or the ‘shrinkwrap.’ As we have discussed in previous sections, one way to interpret
the linear mixing model (Eq. 4.1) is that the endmember vectors define some k-
dimensional subspace (where k is equal to the number of endmembers) that contains
the data. If we apply the sum-to-one (Eq. 4.2) and nonnegativity (Eq. 4.3) constraints,
then a slightly stronger statement may be made; the endmembers are in fact the
vertices of a (k − 1) simplex that contains the data. Note that this simplex must lie
within the original k-dimensional subspace containing the data.
ORASIS uses this idea by defining the endmembers to be the vertices of some
‘optimal’ simplex that encapsulates the data. This is similar to a number of other
‘geometric’ endmember algorithms, such as Pixel Purity Index (PP) and N-FINDR,
and is a direct consequence of the linear mixing model. We note that, unlike PP and
N-FINDR, ORASIS does not assume that the endmembers are necessarily in the data
set. We believe this is an important point. By assuming that each endmember must be
one of the spectra in the given scene, there is an implicit assumption that there exists at
least one pixel that contains only the material corresponding to the endmember. If this
condition fails, then the endmember will only appear as a mixture (mixed pixel), and
will not be present (by itself ) in the data. This can occur, for example, in scenes with
a large GSD (where the individual objects may be too small to fill an entire pixel).
One of the goals of ORASIS is to be able to detect these ‘virtual’-type endmembers
(i.e. those not in the data), and to estimate their signature by extrapolating from the
mixtures those that are present in the data.
© 2008 by Taylor & Francis Group, LLC
82 High-Performance Computing in Remote Sensing
From the previous subsection, the inputs to the endmember module are the exem-
plars from the prescreener, projected down into some k-dimensional subspace, as well
as an initial setof k vectors known as thesalients. By construction, the salientsform an
initial (k −1) simplex within the subspace. The basic idea behind the shrinkwrap is to
systematically ‘push’ the vertices of this simplex outwards. At each step, the vertices
of the simplex are adjusted and a new simplex is formed. This process continues until
every exemplar lies within the new simplex.
To begin the shrinkwrap, we check to see if all the exemplars are already inside
the simplex defined by the salients. If so, then we assume that the salients are in fact
the endmembers, and we are done. In almost every case, however, there will be at
least one point outside of the initial simplex, and it must be expanded in order to
encapsulate the exemplars. To do so, we find the exemplar E
max
that lies the furthest
distance outside of the current simplex. This is easily done by using the current
endmembers (the vertices of the current simplex) to demix the data and search for
the most negative abundance coefficient. The vertex V
max
that is the furthest from
the most outlaying exemplar E
max
is held stationary, and the remaining vertices are
moved outward (using steps of convex combinations) until the E
max
exemplar lies
inside the new simplex. The process is then simply repeated until all exemplars are
within the simplex. The final endmembers are then defined to be the vertices of this
final encompassing simplex.
4.3.4 Demixing
The final step in ORASIS is to decompose each of the scene spectra into a weighted
sum of the endmembers. In the HSI literature this process is commonly referred to as
demixing the data. Note that, in almost all cases, the measured image spectra will not
lie exactly in the subspace defined by the endmembers; this is due to both modeling
error and various typesof sensor noise. It follows that the demixing process will not be
exactly solvable, and the abundance coefficients must be estimated. The process of es-
timating the coefficients will differ depending on whether or not either (or both) of the
constraints given in Eqs. 4.2 and 4.3 are applied. In this subsection, we discuss the two
demixing algorithms (constrained and unconstrained) that are available in ORASIS.
The demixed data (with or without constraints) produced by the linear mixing
model have a number of useful properties. For example, demixing allows the original
high-dimensional image spectra to be replaced with the lower-dimensional demixed
data, with little loss of information. This reduction, typically on the order of 10 to 1,
can greatly simplify and speed up further processing. Also, demixing the data pro-
duces ‘maps’ of the abundance coefficients α
i, j
. By replacing each image spectrum
with its demixed version, a series of k (= number of endmembers) grayscale images
can be created. Each image will highlight only those pixels that contain the given end-
member. For example, in a scene containing water, grass, and dirt elements, the pix-
els that contain water will be bright (have high abundance coefficients) only in the
water endmember image, and will be dark in the remaining grass and dirt endmember
images. Remembering that physically the α
i, j
’s represent the abundance of mate-
rial j in image spectrum i, the images produced in this way are often referred to as
© 2008 by Taylor & Francis Group, LLC
Parallel Implementation of the ORASIS Algorithm 83
abundance planes (or maps). Exactly what the abundance planes measure physically
depends on what calibrations/normalizations have been performed during the pro-
cessing. If the data have been calibrated and the endmembers are normalized, then
the abundance maps represent the radiance associated with each endmember. Other
interpretations are possible, such as relating the abundance maps to the fraction of
total radiance from each endmember. In this case, the abundance maps are sometimes
called the fraction planes.
4.3.4.1 Unconstrained Demix
The easiest method for demixing the data occurs when no constraints are placed on
the abundance coefficients. If we let P be the k ×n matrix (where k is the number of
endmembers and n is the number of spectral bands) defined by P = (X
t
· X)
−1
X
t
,
where |X
1
X
2
···X
k
| is the n × k matrix whose columns are the endmembers, then
it is straightforward to show that the least squares estimate ˆα to the true unknown
mixing coefficients α for a given image spectrum Y is given by ˆα = PY.
Note that the matrix P depends only on the endmembers. It follows that once P
has been calculated, the unconstrained demixing process reduces to a simple matrix-
vector product, which can be done very quickly.
4.3.4.2 Constrained Demix
The constrained demixing algorithm is used when the nonnegativity constraints
(Eq. 4.3) are applied to the abundance coefficients. In this case, there is no known
analytical solution, and numerical methods must be used. Our approach is based on the
well-known Non-Negative LeastSquares (NNLS) method of Lawson and Hanson [7].
The NNLS algorithm is guaranteed to converge to the unique solution that is closest
(in the least squares sense) to the original spectrum. The FORTRAN code for the
NNLS algorithm is freely available from Netlib [8]. We note that, compared to the
unconstrained demixing algorithm, the NNLS can be significantly (orders of mag-
nitude) slower. At the current time, ORASIS does not implement the sum-to-one
constraint, either with or without the nonnegativity constraint.
4.4 Additional Algorithms
While the main focus in this chapter is the ORASIS algorithm, we include for com-
pleteness a brief description of the other major algorithms that were implemented in
this project. This section discusses the algorithms in their original scalar form; we
discuss the modifications made to run them in parallel in the next section.
4.4.1 ORASIS Anomaly Detection
The ORASIS Anomaly Detection (OAD) algorithm [9], originally developed as part
of the Adaptive Spectral Reconnaissance Program (ASRP), is a method for using
© 2008 by Taylor & Francis Group, LLC
84 High-Performance Computing in Remote Sensing
the ORASIS outputs (exemplars and endmembers) to identify potential objects of
interest within hyperspectral imagery. The term ‘anomaly’ is generally used in the
HSI literature to refer to objects that are significantly different (generally in a spectral
sense, though spatial context is also used) from the background clutter of the scene.
Generally speaking, anomaly detection algorithms do not attempt to identify (in a
material sense) the detected anomalies; incontrast,target detection algorithms attempt
to find those spectra in the image containing specific materials (targets).
The first step of OAD is to simply run ORASIS to create a set of exemplars
and to identify endmembers. Next, each exemplar is assigned an ‘anomaly measure’
as defined below. An initial target map is then created by assigning to each image
spectrum a score equal to that of its corresponding exemplar. A threshold is applied
to the target map and the surviving spectra are segmented to create a list of distinct
objects. Finally, the various spatial properties (e.g., width, height, aspect ratio) of the
objects are calculated and stored. Spatial filters may then be applied to reduce false
alarms by removing those objects that are not relevant.
The OAD anomaly measure attempts to define how spectrally different a given
exemplar is from the general background of the scene. To do so, OAD first separates
the set of endmembers into ‘target’ and ‘background’ classes. Intuitively, background
endmembers are those endmembers that appear as a mixture element in a large number
of the exemplars; conversely, target endmembers are those that appear in only a small
number of exemplars. To put it another way, the abundance coefficient corresponding
to a background endmember will be relatively large for a majority of the exemplars
in a given scene, while the abundance coefficient of a target endmember should
be relatively small for almost all exemplars. In statistical terms, the histogram of
abundance coefficients for a background endmember will be relatively wide (high
standard deviation) with a relatively large mean value (see Figure 4.4(a)), while target
endmembers will have relatively thin (low standard deviation) histograms, with small
means and a few pixels with more extreme abundance values (Figure 4.4(b)).
After the endmembers have been classified, the OAD algorithm discards the back-
ground endmembers and uses only the target dimensions. A number of partial mea-
sures are calculated, including measures of how ‘target-like’ (i.e., how much target
abundance is present) a given exemplar is, and how ‘isolated’ or unique (i.e., how
many other exemplars are nearby, in target space) that exemplar is. The partial mea-
sures are then combined into a single scalar anomaly measure.
As an example, Figure 4.5 shows the results of applying the OAD algorithm (with
spatial filters) to the HYDICE Forest Radiance I data set.
4.4.2 N-FINDR
The N-FINDR algorithm is an alternative endmember selection algorithm developed
by Technical Research Associates,Inc.As with ORASIS, N-FINDR uses the structure
imposed on the data by the linear mixture model to define endmembers. In geomet-
rical terms, the LMM (Eq. 4.1) states that the endmembers form a k-dimensional
subspace that contains the image spectra (ignoring noise). If the sum-to-one and non-
negativity constraints (Eqs. 4.2 and 4.3, respectively) are enforced, then the linear
© 2008 by Taylor & Francis Group, LLC
Parallel Implementation of the ORASIS Algorithm 85
200015001000500
Data Value
0–500
0
200
400
600
Frequency
800
1000
1200
1400
10000800060004000
Data Value
20000
0
1000
2000
3000
Frequency
4000
Figure 4.4 Abundance coefficient histograms. (a) The histogram of a background
endmember. (b) The histogram of a target endmember.
(a)
(b)
Figure 4.5 HYDICE data from Forest Radiance. (a) A single band of the raw data.
(b) Overlay with the results of the OAD.
© 2008 by Taylor & Francis Group, LLC
86 High-Performance Computing in Remote Sensing
mixing model implies that the endmembers are in fact the vertices of a (k − 1)
simplex that encapsulates the data. Roughly speaking, N-FINDR uses this approach
to determine endmembers by choosing the k image spectra that define a solid whose
volume is maximized. The number of endmembers k that are chosen may be defined
by the user, or determined autonomously using a principal components-like analysis.
We note that, in contrast to ORASIS, N-FINDR will only choose spectra that are in
the image to be endmembers, and thus implicitly assumes that full-pixel examples of
each endmember exist in the data. On the other hand, unlike ORASIS, this approach
guarantees that each endmember is physically meaningful.
4.4.3 The Stochastic Target Detector
The Stochastic Target Detector (STD) [10] is an anomaly detection algorithm that
was originally developed by Technical Research Associates, Inc. STD is similar to
OAD in that endmembers are divided into target and background groups, although
STD also includes a ‘neutral’ endmember type, which includes endmembers that are
neither target or background endmembers (e.g. noise artifacts, shading effects, etc.).
The algorithm then uses various statistical measures on the target and background
endmember planes to determine how ‘anomalous’ a given input spectra is. The final
output is a target map, assigning a single detection measure to each image spectra. As
with OAD, the target map can then be thresholded, segmented, spatially filtered, etc.
4.5 Parallel Implementation
The algorithms presented in the two previous sections were all originally designed to
run in scalar (single processor) environments. In this section, we discuss the changes
that were made to run the various algorithms in parallel.
One of the goals of our project was to present the algorithms in such a way as to
allow the user to be able to ‘mix-n-match’ various pieces in order to obtain a specific
result as quickly as possible. For example, a user interested only in anomaly detection
has no need for compression. Similarly, a user may want to be able to compare results
using different endmember selection schemes, etc. With this in mind, we divided the
various algorithms into four general processing steps:
1. ORASIS Endmember Selection. This step includes all of the major ORASIS
algorithms (prescreener, basis selection, shrinkwrap) and outputs a set of end-
members. In addition, the user may optionally select the ‘compression’ option,
which runs the best-fit module of the prescreener.
2. N-FINDR Endmember Selection. This step simply runs the parallel version of
N-FINDR and outputs a set of endmembers.
3. Demixing. This step uses the endmembers from either of the first two steps to
demix the image spectra. The user has the option of using either unconstrained
or nonnegatively constrained demixing.
© 2008 by Taylor & Francis Group, LLC
Parallel Implementation of the ORASIS Algorithm 87
4. Anomaly Detection. This step uses the endmembers from either of the first two
steps to run the OAD or STD algorithms.
Each of the preceding four steps was modified to be able to run in parallel mode.
Note that the steps themselves must be run serially, since each step depends on the
outcome of the earlier steps in order to be run. Also, in general only one of the
endmember selection schemes will be used.
The general strategy we used for parallelization was the well-known master-slave
paradigm, in which one process (the master) acts as a scheduler, distributing data
and tasks to the remaining processes (slaves), which in turn send results back to the
master for consolidation and output. Inter-process communication was done using
the Message Passing Interface (MPI) [11], a communications library that has been
implemented by all major HPC hardware manufacturers. We note that, at the time of
this project, the full MPI-2 standard had not yet been implemented by all vendors.
Since one of the requirements for this project was to be as portable as possible, we
decided to use the older MPI-1.1 standard. In particular, we did not have access to
the parallel Input/Output (I/O) routines of the MPI-2 standard. As a result, the master
was tasked with reading the input image files and then distributing the data to each
of the slaves. Given the size of typical hyperspectral images, this presented a rather
large bottleneck, and forced us to structure the code in ways that were perhaps not
ideal. As the MPI-2 standard and Parallel I/O become better implemented, it is hoped
that these bottlenecks can be removed.
4.5.1 ORASIS Endmember Selection
The first step in the ORASIS program, the exemplar selection part of the prescreener,
turned out to be quite difficult to parallelize. For a number of reasons, which we
discuss in more detail later in this subsection, we decided to use only a limited number
(typically three or four) of slave processes in this step. The master began by sending
to each slave a fixed number of lines from the beginning of the cube; for example, the
first slave received the first 100 lines of the cube, the second slave received the next
100 lines, etc. The individual slaves would then run their own (scalar) version of the
prescreener, with each slave keeping a ‘personal’ list of exemplars. Once a slave had
finished the initial block of data, it would ask the master for a new block to process,
using its own internal list of exemplars, until the entire cube had been processed. In
this way, each slave process builds up a set of exemplars, which is then sent to the
master. The master then consolidates the individual lists into a ‘full’ set of exemplars,
which it then broadcasts to all of the slave processes (including those processes not
involved with the exemplar selection).
If the compression option is selected by the user, then the next step is the codebook
replacement module, which replaces each image spectrum with the closest member
of the exemplar list. We again use a master-slave formulation; the master begins by
sending each slave an image frame to process. The slavethenrunsthe(scalar)‘best-fit’
codebook replacement algorithm on the frame. As the slave finishes, it sends back to
© 2008 by Taylor & Francis Group, LLC
88 High-Performance Computing in Remote Sensing
the master the codebook for that frame, and receives a new frame. This process simply
continues until the entire image has been processed. The frame-by-frame approach
is needed since the amount of time needed to find the best matching exemplar can
vary widely among the incoming image spectra, which tended to lead to serious load
balancing issues.
The two remainingmodules,basisdeterminationandendmemberselection,operate
only on the exemplars. At this point, each process has a copy of the exemplar list,
and the master distributes the computing load by assigning each process a subgroup
of exemplars to work on. The slaves send the results of their computations back to
the master, who first selects the basis vectors and then (after further processing by the
slaves) determines the endmembers.
We conclude this subsection with a discussion of why wedecided to cap the number
of slave processes used during the exemplar selection process. The reason for doing
so was due to the fact that the prescreener is based on accumulated knowledge. In
particular, each incoming spectrum must be compared to the entire list of already
known exemplars. Since each process contains its own list of exemplars, it is possible
that aprocesscouldencounter an incoming spectrumthatappearsto be a new exemplar
(since it does notmatch any exemplar on its list), whilein reality it should be discarded
(since it matchesanexemplar found on anotherprocess’s list).Asaresult,each process
contains a number of ‘redundant’ exemplars, and the total number of exemplars will
increase with the number of processes. As an extreme example, if the number of
slave processes was equal to the number of image spectra, then no spectrum would be
considered redundant, and every image spectrum would become an exemplar. Since
the computation time of the remaining modules scales approximately as the square
of the number of exemplars, the speedup resulting in parallelizing the prescreener
(using all available slaves) was quickly nullified by the increase in computing time
needed for the rest of the algorithm. For this reason, it was decided to cap the number
of processes used in the prescreener.
We also note that the reason for sending ‘blocks’ of data, instead of simply par-
titioning the scene into equal areas and then assigning each area to a slave, was a
load balancing problem. The actual amount of processing time needed to run the
prescreener varies directly with the number of exemplars, which is itself closely tied
to the scene. For example, a given image may contain both large, homogenous areas
(grass fields, say) as well as areas with very diverse spectra (e.g. urban areas). In this
type of image, the homogeneous areas will have only a relatively few spectra, and
thus run very quickly, since very few comparisons are needed to see if a match occurs.
Conversely, the urban areas will contain relatively many exemplars, and consequently
take much longer to run than the grass fields.
4.5.2 N-FINDR Endmember Selection
To parallelize N-FINDR, a master-slave formulation was again used, and the scene
partitioned spatially.Torun the algorithm,themaster process readsinthe data cubeand
sends a given number of spatially contiguous frames to each process. The individual
© 2008 by Taylor & Francis Group, LLC
Parallel Implementation of the ORASIS Algorithm 89
processes then run a (slightly modified) version of the scalar N-FINDR algorithm to
determine a set of ‘possible’ endmembers for that section of the data. Each set of
possible endmembers is returned to the master process, which then consolidates the
combined list of possible endmembers to create a final set of endmembers. We note
that the design and implementation of the parallel N-FINDR algorithm was done by
Michael Winter of the University of Hawaii and TRA.
4.5.3 Spectral Demixing
Once the endmembers have been calculated, either by ORASIS or by N-FINDR, the
next step is to estimate the abundance coefficients, or demix, the individual spectra.
Two demixing routines are available: an unconstrained demix, which places no re-
strictions on the abundance coefficients, and a constrained demix, which requires that
the abundance coefficients be strictly nonnegative. We note that either demixing rou-
tine operates strictly on a spectrum-by-spectrum case and is therefore embarrassingly
parallel.
In the parallel version of the demixing algorithm, the master begins by sending
the endmembers to each of the slave processes, which then calculates the correct
(constrained or unconstrained) demixing matrix. The master then sends out a single
image frames to each of the slaves. Each slave demixes the individual pixels in the
frame and returns the demixed frame to the master, who then sends out a new frame to
the slave. Once each frame has been demixed, the master then writes out the demixed
cube to disk.
4.5.4 Anomaly Detection
After the demixing process, the next (optional) step in the program is anomaly de-
tection. The user may choose one of two anomaly detection routines: the ORASIS
Anomaly Detection (OAD) algorithm or the Stochastic Target Detector (STD)
algorithm.
In the parallel version of OAD, the master separates the endmembers into target/
background classes and broadcasts that information to the slaves. At this point in the
processing, each slave already contains a copy of the exemplars and the endmembers.
The exemplars are then partitioned by the master into subgroups, and each slave
calculates the anomaly measures for each of the exemplars in its group. The master
then receives back each of the anomaly measures, creates a target image, and writes
out the target image to disk.
In the STD algorithm, the actual calculation times are dominated by matrix-matrix
multiplications. Most of these multiplications involve small matrices (on the order
of the number of endmembers) with a few relatively large ones (on the order of
the number of pixels in the scene). Using platform-specific optimized linear algebra
libraries, the total running time of the (scalar) STD algorithm for the images we used
was on the order of a few seconds; therefore, we did not attempt to develop a parallel
version of this algorithm.
© 2008 by Taylor & Francis Group, LLC
90 High-Performance Computing in Remote Sensing
4.6 Results
In this section, we discuss the timing and validation results of the parallel algorithms
presented in the last section. We begin with a discussion of the hardware used in
the test procedure. As we have noted earlier, this work was done as part of a CHSSI
project on hyperspectral data validation. One of the requirements of this project was
to design the code to be completely portable, while also allowing for the use of opti-
mized, hardware-specific libraries. To meet this requirement, we ran our algorithms
on three different HPC systems representing a variety of architectures and operating
systems. The details of the hardware are summarized in Table 4.1. The base code was
written in ISO compatible C++ (except the public domain WNNLS routine used in
the constrained demixing algorithm, which is written in FORTRAN). All message
passing and numerical linear algebra calculations were done using vendor-specific
implementations of the MPI and BLAS (including LAPACK) libraries, respectively.
The code compilation and linking of the various libraries was handled through the
use of machine-specific make files.
To test our algorithms, we ran a series of experiments on each of the three test
machines. The major goals of the test procedure were to show that the algorithms
performed well on a variety of data cubes and under various user configurations.
With that in mind, we constructed a series of five test runs for each machine, meant to
model typical hyperspectral linear modeling tasks. In particular, we developed tests
for compression, terrain categorization, and anomaly detection [12].
The first test, compression, used only the endmember selection and unconstrained
demixing modules. Since N-FINDR is not designed forcompression,weusedonly the
ORASIS endmember selection module(includingthe‘best-fit’codebookreplacement
algorithm) for this test.
The second test, terrain categorization (TerrCat), used only the endmember selec-
tion and constrained demixing algorithms. This test was subdivided into two parts,
one for each of the two endmember selection algorithms.
The third test, anomaly detection (ATR), used the endmember selection and un-
constrained demixing algorithms, as well as one of the anomaly detection algorithms.
As in TerrCat, this test was subdivided into two parts, one for each of the endmember
selection algorithms. For the ORASIS endmember test, the OAD anomaly detection
algorithm was used; the STD algorithm was used for the N-FINDR endmember tests.
Each of the three test scenarios was applied to different image cubes, to verify that
the code was able to handle data from various sensors and in various formats. The
specifications for each of the image cubes used are summarized in Table 4.2.
TABLE 4.1 Summary of HPC Platforms
Machine Location Machine Type Operating System Processors
Longview SPAWAR HP Superdome HP-UX 48
Huinalu MHPCC IBM Netfinity Supercluster Linux 512
Shelton ARL IBM P5 AIX 512
© 2008 by Taylor & Francis Group, LLC
Parallel Implementation of the ORASIS Algorithm 91
TABLE 4.2
Summary of Data Cubes
Test Sensor Cube Name Samples Lines Bands Data Type
Compression AVIRIS Cuprite VNIR 610 1024 64 16 bit integer
TerrCat AVIRIS Cuprite 610 1024 224 16 bit integer
ATR NVIS AP Hill 244 512 293 32 bit float
In Tables 4.3–4.5, we summarize the timing results for each of the three HPC
platforms. Each table contains the results of running each of the five test runs, with
the times given in seconds. Each test was run on a number of different processors
(4, 8, 16, and 64) to testscalability. A Not Applicable (NA) score in the tables indicates
that the given test was not run on the specified number of processors.
A second series of tests was developed to test the validity of the results. This test
was somewhat of a challenge, since there is no ‘correct’ answer to the endmember
selection process. However, we can use the compression test from above to verify
that the endmember selection and demixing algorithms are working correctly, by first
compressing the image cube and then comparing the decompressed cube with the
original input cube. Since we can derive theoretical limits on how much distortion
can occur, it is reasonable to assume that if the actual measured distortion is within the
theoretical bounds, then the algorithms are performing correctly. Or, to put in another
way, when the algorithms are not performing correctly, the distortion is much higher
than it should be.
TABLE 4.3 Timing Results for the Longview Machine (in seconds)
Number of Processes
Test Algorithm 4 8 32 64
Compression ORASIS 83 NA 32 NA
TerrCat ORASIS 152 NA 35 NA
TerrCat N-FINDR 168 NA 41 NA
ATR ORASIS 48 NA 15 NA
ATR N-FINDR 25 NA 11 NA
TABLE 4.4
Timing Results for the Huinalu Machine (in seconds)
Number of Processes
Test Algorithm 4 8 32 64
Compression ORASIS 111 80 32 53
TerrCat ORASIS 128 78 57 51
TerrCat N-FINDR 140 82 60 48
ATR ORASIS 77 47 32 31
ATR N-FINDR 24 21 9 19
© 2008 by Taylor & Francis Group, LLC
92 High-Performance Computing in Remote Sensing
TABLE 4.5
Timing Results for the Shelton
Machine (in seconds)
Number of Processes
Test Algorithm 4 8 32 64
Compression ORASIS 97 70 46 NA
TerrCat ORASIS 197 111 59 6
TerrCat N-FINDR 11 10 11 NA
ATR ORASIS 158 94 35 25
ATR N-FINDR 13 9 7 NA
TABLE 4.6
Statistical Tests used for Compression.
X = original Spectrum, Y = Reconstructed Spectrum,
n =Number of Bands
Measure Formula
Absolute error
1
n
n
i=1
|X
i
− Y
i
|
Relative error
1
n
n
i=1
|X
i
−Y
i
|
X
i
RMS
n
i=1
(X
i
−Y
i
)
2
n
SNR 10 · log
10
(maxY
i
)
2
RMS
Error angle cos
−1
(
X·Y
X
i
·Y
i
)
To verify the compression results, we calculated a variety of statistical measures to
compare the original input cube and the decompressed image cube. For our test cube,
we used the Cuprite image from Table 4.2, and the error angle in the prescreener
was set to 0.5 degrees. Each measure was calculated on a pixel-by-pixel case, by
comparing the original and reconstructed spectra. We then calculated the minimum,
maximum, and mean results (among all pixels) for each measure. The details of
the individual measures are given in Table 4.6, and the results for each of the three
platforms are summarized in Tables 4.7–4.9. We note that the results were consistent
among each of the three platforms, implying that the code was running correctly on
each machine.
TABLE 4.7 Compression Results for the Longview
Machine
Measure Mean Min Max
Absolute error 541.8 374.6 1140.3
Relative error 0.75 0.73 0.75
RMS 592.9 390.6 1341.5
SNR 23.2 19.7 27.9
Error angle 0.38 0.05 0.73
© 2008 by Taylor & Francis Group, LLC
Parallel Implementation of the ORASIS Algorithm 93
TABLE 4.8
Compression Results for the
Huinalu Machine
Measure Mean Min Max
Absolute error 541.8 374.6 1140.2
Relative error 3.0 2.9 3.01
RMS 592.9 390.6 1341.4
SNR 35.2 31.8 39.9
Error angle 0.38 0.05 1.4
4.7 Conclusions
Given the size of most hyperspectral images, it is clear that automated, and efficient,
processing algorithms are needed in order to keep up with the flow of data. Modern
high-performance systems appear to offer the best hope of doing so, but a number of
issues remain.
In the particular case of ORASIS, these issues include the data passing overhead, as
the master process needs to send large chunks of data to each of the slaves. Better im-
plementation of the MPI-2 standard, including the use of Parallel I/O, should remove
most of thatoverhead. A bigger issuein our case was our lack of success in completely
parallelizing the prescreener. This was offset by the near perfect speedup of the demix-
ing routines, which, especially in the case of the constrained demix, tends to dominate
the total processing time. In compression tasks, the best-fit algorithm performed well
up to about 32 processes; for reasons we do not yet fully understand, increasing the
number above that led to a decrease in performance. The remaining algorithms (basis
determination, endmember selection, and OAD) also performed reasonably well, but,
given the performance of the scalar versions, the speedup that results from paralleliza-
tion is fairly slight. We note that N-FINDR, which was better able to take advantage
of parallel processing by partitioning the scene spatially, performed very well.
One last issue, which we did not discuss in the text, is the question of how best to
process the data spatially. Modern pushbroom sensors, which take data on a line-by-
line basis, are capable of producing images that are many thousands of lines long (and
TABLE 4.9 Compression Results for the
Shelton Machine
Measure Mean Min Max
Absolute error 541.8 374.6 1140.3
Relative error 3.0 2.9 3.0
RMS 592.9 390.6 1341.4
SNR 35.2 31.8 39.9
Error angle 0.39 0.05 0.74
© 2008 by Taylor & Francis Group, LLC