High Performance Computing in Remote Sensing - Chapter 14 pptx
Bạn đang xem bản rút gọn của tài liệu. Xem và tải ngay bản đầy đủ của tài liệu tại đây (1.86 MB, 24 trang )
Chapter 14
AVIRIS and Related 21st Century Imaging
Spectrometers for Earth and Space Science
Robert O. Green,
Jet Propulsion Laboratory,
California Institute of Technology
Contents
14.1 Introduction 336
14.2 AVIRIS and the Imaging Spectroscopy Measurement 338
14.2.1 The AVIRIS Imaging Spectrometer Characteristics 339
14.2.2 The AVIRIS Measured Signal 342
14.2.3 Range of Investigations Pursued with AVIRIS Measurements 345
14.2.4 The AVIRIS Data Archive and Selected Imaging Spectroscopy
Analysis Algorithms 346
14.3 Objectives and Characteristics of a Spaceborne Imaging
Spectrometer for the Moon 348
14.3.1 Objectives of the Moon Mineralogy Mapper 348
14.3.2 Characteristics of the M
3
Imaging Spectrometer 348
14.3.3 Prospects for the M
3
Imaging Spectrometer Data Set 351
14.4 Objectives and Characteristics of a Future Spaceborne Imaging
Spectrometer for the Earth 352
14.4.1 Objectives of an Earth Imaging Spectrometer for Measuring
the State of Terrestrial and Aquatic Ecosystems 352
14.4.2 Characteristics of an Ecosystem Focused Earth
Imaging Spectrometer 353
14.4.3 Roles for High-Performance Computing 354
14.5 Acknowledgments 356
References 356
Imaging spectroscopy (also known as hyperspectral imaging) is a field of scientific in-
vestigation based upon the measurement and analysis of spectra measured as images.
The human eye qualitatively measures three colors (blue, green, and red)in the visible
portion of the electromagnetic spectrum when viewing the environment. The human
eye-brain combination is a powerful observing system, however, it generally pro-
vides a non-quantitative perspective of the local environment. Imaging spectrometer
335
© 2008 by Taylor & Francis Group, LLC
336 High-Performance Computing in Remote Sensing
instruments typically measure hundreds of colors (spectral channels) across a much
wider spectral range. These hundreds of spectral channels are recorded quantitatively
as spectra for every spatial element in an image. The measured spectra provide the
basis for a new approach to understanding the environment from a remote perspective
based in the physics, chemistry, and biology revealed by imaging spectroscopy.
The measurement of hundreds of spectral channels for each spatial element of an
image consisting of millions of spatial elements creates an important requirement
for the use of high-performance computing. First, high-performance computing is
required to acquire, store, and manipulate the large data sets collected. Second, to
extract the physical, chemical, and biological information recorded in the remotely
measured spectra requires the development and use of high-performance computing
algorithms and analysis approaches.
This chapter uses the Airborne Visible/Infrared Imaging Spectrometer (AVIRIS)
to review the critical characteristics of an imaging spectrometer instrument and the
corresponding characteristics of the measured spectra. The wide range of scientific
research as well as application objectives pursued with AVIRIS is briefly presented.
Roles for the application of high-performance computing methodsto AVIRIS datasets
are discussed. Next in the chapter a review is given of the characteristics and mea-
surement objectives of the Moon Mineralogy Mapper (M3) imaging spectrometer
planned for launch in 2008. This is the first imaging spectrometer designed to acquire
high precision and high uniformity spectral measurements of an entire planetary-sized
rocky body in our solar system. The size of the expected data set and roles for high
performance computing are discussed. Finally, a review is given of one design for an
Earth imaging spectrometer focused on investigation of terrestrial and aquatic ecosys-
tem status and composition. This imaging spectrometer has the potential to deliver
calibrated spectra for the entire land and coastal regions of the Earth every 19 days.
The size of the data sets generated and the sophistication of the algorithms needed
for full analysis provide a clear demand for high-performance computing. Imaging
spectroscopy and the data sets collected provide an important basis for the use of high-
performance computing from data collection to data storage through to data analysis.
14.1 Introduction
Imaging spectroscopy is based in the field of spectroscopy. Sir Isaac Newton first
separated the color of white light into the rainbow in the late 1600s. In the 1800s,
Joseph von Fraunhofer and others discovered absorption lines in the solar spectrum
and light emitted by flames. Through investigation of these absorption lines, the
linkage between composition and signatures in a spectrum of light was established.
The field of spectroscopy has been pursued by astronomers for more than 100 years
to understand the properties of stars as well as planets in our solar system. On Earth,
spectroscopy has been used by physicists, chemists, and biologist to investigate the
properties of materials relevant to their respective disciplines. In the later half of the
© 2008 by Taylor & Francis Group, LLC
AVIRIS and Related 21st Century Imaging Spectrometers 337
25002200190016001300
Wavelength (nm)
1000700400
0.0
0.1
0.2
0.3
0.4
0.5
Reflectance
0.6
0.7
0.8
0.9
1.0
Kaolinite
Conifer Grass Broad Leaf Sage_Brush NPV
Gypsum Jarosite Dolomite Hematite
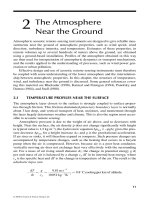
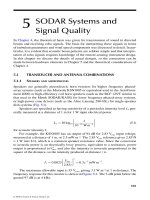
Figure 14.1 A limited set of rock forming minerals and vegetation reflectance spec-
tra measured from 400 to 2500 nm in the solar reflected light spectrum. NPV cor-
responds to non-photosynthetic vegetation. A wide diversity of composition related
absorption and scattering signatures in nature are illustrated by these materials.
20
th
century Earth scientists developed spaceborne instruments that view the earth in a
fewspectralbandscapturingaportion of the spectral informationinreflectedlight.The
AVHRR, LandSat, and SPOTare importantexamples of this multispectral approachto
remote sensing of the Earth.However, the few spectral bands of multispectralsatellites
fail to capture the complete diversity of the compositional information present in
the reflected energy spectrum of the Earth. Figure 14.1 shows a set of measured
reflectance spectra from a limited set of rock forming minerals and vegetation spectra.
A wide diversity of composition-related absorption and scattering signatures exist for
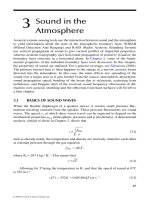
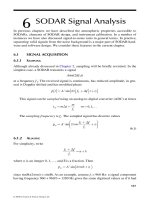
such materials. Figure 14.2 shows these selected reflectance spectra convolved to
the band passes of the LandSat Thematic Mapper. When mixtures and illumination
factors are included, the 6 multispectral measurements of the multispectral Thematic
Mapper are insufficient to unambiguously identify the 10 materials present. In the
1970s, realization of the limitations of the multispectral approach when faced with the
diversity and complexity of spectralsignatures found onthe surface of the Earth lead to
the concept of an imaging spectrometer. The use of an imaging spectrometer was also
understood to be valid for scientific missions to other planets and objects in our solar
system. Only in the late 1970s did the detectorarray, electronics,computer, and optical
technology reach significant maturity to allow design of an imaging spectrometer.
With the arrival of these technologies and scientific impetus, the Airborne Imaging
Spectrometer (AIS) was proposed and built at the Jet Propulsion Laboratory [1]. The
© 2008 by Taylor & Francis Group, LLC
338 High-Performance Computing in Remote Sensing
25002200190016001300
Wavelength (nm)
1000700400
0.0
0.1
0.2
0.3
0.4
0.5
Reflectance
0.6
0.7
0.8
0.9
1.0
Kaolinite
Conifer Grass Broad Leaf Sage_Brush NPV
Gypsum Jarosite Dolomite Hematite
Figure 14.2 The spectral signatures of a limited set of mineral and vegetation spec-
tra convolved to the six solar reflected range band passes of the multispectral LandSat
Thematic Mapper. When mixtures and illumination factors are included, the six mul-
tispectral measurements are insufficient to unambiguously identify the wide range of
possible materials present on the surface of the Earth.
AIS first flew in 1982 aswell as in severalsubsequentyears as atechnologyand science
demonstration experiment. Concurrently with the development of the AIS a role for
high-performance computing was identified and pursued [2]. The AIS instrument had
limited spectral coverage as well as limited spatial coverage. Even as a demonstration
experiment, the success of the AIS led to the formulation of the proposal for the
Airborne Visible/Infrared Imaging Spectrometer. This next generation instrument
was specified to measure the complete solar reflected spectrum from 400 to 2500 nm
and to capture a significant spatial image domain. The broader spectral and spatial
domain of this full range instrument continued to grow the role for high-performance
computing in the field of imaging spectroscopy.
14.2 AVIRIS and the Imaging Spectroscopy Measurement
The Airborne Visible/Infrared Imaging Spectrometer (AVIRIS) [3, 4] measures the
total upwelling spectral radiance in the spectral range from 380 to 2510 nm at ap-
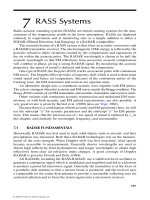
proximately 10 nm sampling intervals and spectral response function. Figure 14.3
shows a plot of the AVIRIS spectral range in conjunction with an atmospheric trans-
mittance spectrum. Also shown for comparison are the spectral response functions
© 2008 by Taylor & Francis Group, LLC
AVIRIS and Related 21st Century Imaging Spectrometers 339
250022001900160013001000700400
0
0.1
0.2
0.3
0.4
0.5
0.6
0.7
0.8
0.9
1
Wavelength (nm)
Atmosphere Transmittance
Transmittance
AVIRIS 224 Contiguous Spectral Channels
Landsat TM 6 Multispectral
Bands
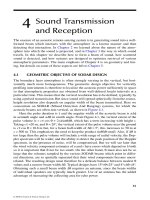
Figure 14.3 AVIRIS spectral range and sampling with a transmittance spectrum of
the atmosphere and the six LandSat TM multi-spectral bands in the solar reflected
spectrum.
of the multispectral LandSat Thematic Mapper. With AVIRIS a complete spectrum
is measured with contiguous spectral channels. Across this spectral range the atmo-
sphere transmits energy reflected from the surface, except in the spectral regions of
strong water vapor absorption centered near 1400 and 1900 nm. These strong water
vapor absorption regions are used for cirrus cloud detection and compensation. Mea-
surement of this complete spectral range allows AVIRIS to be used for investigations
beyond those possible with a multispectral measurement. In addition, measurement
of the full spectrum allows use of new, more accurate, computationally intensive
algorithms that require high-performance computing.
In the spatial domain, AVIRIS measures spectra as images with a 20 m spatial
resolution and an 11 km swath with up to 1000 km image length from NASA’s ER-2
aircraft flying at 20 km altitude. On the Twin Otter aircraft flying at 4 km altitude, the
spatial resolution is 4 m with a 2 km swath and up to 200 km image length. Figure 14.4
shows an AVIRIS data set collected over the southern San Francisco Bay, California,
from the ER-2 platform in image cube representation. The spectrum measured for
each spatial element in the data set may be used to pursue specific scientific research
questions via the recorded interaction of light with matter.
14.2.1 The AVIRIS Imaging Spectrometer Characteristics
The full set of AVIRIS spectral, radiometric, spatial, temporal, and uniformity charac-
teristics are given in Table 14.1. These characteristics have been refined and improved
since the initial development of AVIRIS based upon the requirements from scientists
© 2008 by Taylor & Francis Group, LLC
340 High-Performance Computing in Remote Sensing
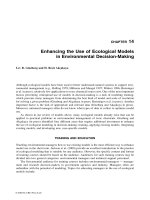
Figure 14.4 AVIRIS image cube representation of a data set measured of the south-
ern San Francisco Bay, California. The top panel shows the spatial content for a 20 m
spatial resolution data set. The vertical panels depict the spectral measurement from
380 to 2510 nm that is recorded for every spatial element.
TABLE 14.1 Spectral, Radiometric, Spatial, Temporal, and
Uniformity Specifications of the AVIRIS Instrument
Spectral properties:
Range 380 to 2510 nm in the solar reflected spectrum
Sampling 10 nm across spectral range
Response FWHM < 1.1 of sampling
Accuracy Calibrated to 2% of sampling
Precision Stable within 1% of sampling
Radiometric properties:
Range 0 to maximum Lambertian radiance
Sampling 16 bits measured
Response > 99% linear
Accuracy > 96% absolute radiometric calibration
Precision (SNR) As specified at reference radiance
Spatial properties:
Range 34 degree field-of-view (FOV)
Sampling 0.87 milliradian cross and along track
Response FWHM of IFOV < 1.2 of sampling
Temporal properties:
Airborne As requested 1987 to present
Uniformity:
Spectral cross-track > 99% uniformity of position across the FOV
Spectral-IFOV > 98% IFOVs uniformity over the spectral range
© 2008 by Taylor & Francis Group, LLC
AVIRIS and Related 21st Century Imaging Spectrometers 341
250022001900160013001000700400
0
200
400
600
Signal-to-Noise Ratio
Radiance (uW/cm^2/nm/sr)
Signal-to-Noise Ratio
Reference (0.5 at 23.5z)
800
1000
1200
1400
30
25
20
15
10
5
0
Wavelength (nm)
Figure 14.5 The 2006 AVIRIS signal-to-noise ratio and corresponding benchmark
reference radiance.
using AVIRIS data. Of particular importance has been the improvement of the signal-
to-noise ratio. An increased signal-to-noise ratio has been a critical factor enabling
more advanced algorithms and sophisticated analysis approaches. Figure 14.5 gives
the 2006 AVIRIS signal-to-noise ratio at the specified AVIRIS reference radiance.
The AVIRIS reference radiance was specified in the original AVIRIS proposal as
the radiance from a 0.5 reflectance surface illuminated by the sun at a 23.5 degree
solar zenith angle through the standard mid-latitude atmospheric model. The current
AVIRIS signal-to-noise ratio is 10 to 20 times greater than when the instrument first
flew in 1986.
Of special importance for valid physically based imaging spectroscopy science
is the uniformity of the imaging spectrometer measurement. Two aspects of unifor-
mity are critical. The first is cross-track spectral uniformity. The spectral cross-track
uniformity requirement is that each spectrum in the image have the same spectral
calibration to some percentage near 100%. For AVIRIS, the spectral cross-track uni-
formity exceeds 99% because each spectrum in the image is measured by the same
spectrometer. This is inherent in the AVIRIS whiskbroom imaging spectrometer de-
sign. For the (approximate) 10 nm spectral sampling of AVIRIS, this 99% uniformity
assures that the spectral calibration is the same for all spectra measured in an image
to the level of 0.1 nm. Excellent spectral cross-track uniformity is required for all
analysis algorithms that are applied directly to all spatial elements in an image. Some
of the most powerful algorithms such as spectral dimensional analysis and spectral
unmixing require near-perfect spectral cross-track uniformity.
The second critical form of uniformity for an imaging spectrometer is spectral
instantaneous-field-of-view (IFOV) uniformity. The IFOV is the sampling area on the
surface for a single spatial element. Spectral-IFOV uniformity requires that the IFOV
© 2008 by Taylor & Francis Group, LLC
342 High-Performance Computing in Remote Sensing
Cross Track Sample
Wavelength
Figure 14.6 Depiction of the spectral cross-track and spectral-IFOV uniformity for
a uniform imaging spectrometer. The grids represent the detectors, the gray scale
represents the wavelengths, and the dots represent the centers of the IFOVs. This
is a uniform imaging spectrometer where each cross-track spectrum has the same
calibration and all the wavelengths measured for a given spectrum are from the same
IFOV.
for a given spectrum be the same for all wavelengths to some high percentage near
100%. This assures that the same area on the ground is sampled for all wavelengths
measured in a spectrum. Again, because AVIRIS is a whiskbroom spectrometer, the
spectral IFOV uniformity is high at better than 98%. Figure 14.6 depicts the spectral
cross-track and spectral IFOV uniformities for a 100% uniform instrument. Several
imaging spectrometers have been constructed with low spectral cross-track and low
spectral-IFOV uniformities undermining their potential use.
14.2.2 The AVIRIS Measured Signal
Understanding the detailed nature of the AVIRIS or any imaging spectrometer mea-
surements is essential for appropriate analysis of the data. Figure 14.7 shows the
reflectance spectrum of a vegetation canopy. From this reflectance spectrum a wide
range of plant composition and status information may be extracted. This informa-
tion is contained in the molecular absorption and constituent scattering signatures
recorded in the vegetation canopy spectrum.
An Earth-looking imaging spectrometer such as AVIRIS does not measure re-
flectance. AVIRIS measures the total upwelling radiance incident at the instrument
© 2008 by Taylor & Francis Group, LLC
AVIRIS and Related 21st Century Imaging Spectrometers 343
25002200190016001300
Wavelength (nm)
1000700400
0.00
0.20
0.40
Reflectance
0.60
0.80
Figure 14.7 Vegetation reflectance spectrum showing the molecular absorption and
constituent scattering signatures present across the solar reflected spectral range.
aperture. When flying on the NASA ER-2 aircraft, the aperture is looking down
from 20 km. Figure 14.8 show the modeled [5, 6] radiance incident at the AVIRIS
aperture for the vegetation canopy reflectance spectrum. This spectrum includes the
combined effects of the solar irradiance, two-way transmittance, and scattering of the
atmosphere, as well as the reflectance of the vegetated canopy. This is the radiance in
25002200190016001300
Wavelength (nm)
1000700400
0
5
10
Radiance (uW/cm^2/nm/sr)
15
20
Figure 14.8 Modeled upwelling radiance incident at the AVIRIS aperture from a
wel-illuminated vegetation canopy. This spectrum includes the combined effects of
the solar irradiance, two-way transmittance, and scattering of the atmosphere, as well
as the vegetation canopy reflectance.
© 2008 by Taylor & Francis Group, LLC
344 High-Performance Computing in Remote Sensing
224208192176160144128112
Channel (#)
9680644832160
0
500
1000
1500
2000
Signal (DN)
2500
3000
3500
4000
Figure 14.9 AVIRIS measured signal for the upwelling radiance from a vegetation
covered surface. The instrument optical and electronic characteristics dominate for
recorded signal.
terms of power per area per wavelength per solid angle available to measure for the
pursuit of imaging spectroscopy.
As with any radiance measuring instrument, AVIRIS has optical components that
collect the incident light and focus it on a detector. At the detector the incident light
is converted to measurable signals that are amplified, digitized, and recorded. Figure
14.9 shows the AVIRIS recorded signal for the vegetation canopy upwelling radiance
spectrum. The AVIRIS signal has no inherent radiometric or spectral calibration and
is recorded as digitized number (DN) versus channel.
The process of spectral and radiometric calibration in the AVIRIS data processing
subsystem converts the measured signal to units of spectral radiance. Considerable
effort has been expended over the years of AVIRIS’ operation to develop spectral,
radiometric, and spatial calibration methods in the laboratory [7, 8]. A companion
effort has been applied to validate the calibration of AVIRIS in the flight environment
[9, 10]. Figure 14.10 shows the AVIRIS calibrated radiance spectrum of the vege-
tation canopy target. Accurate calibration is an essential requirement for the spectra
measured by AVIRIS or any imaging spectrometer to be analyzed quantitatively for
science research or application objectives.
If the objective of the investigation is the understanding of surface properties, the
calibrated radiance spectra must be corrected for the effects of the atmosphere. Atmo-
spheric correction generally includes compensation for the solar irradiance as well as
atmospheric absorbing and scattering effects. Figure 14.11 show the atmospherically
corrected spectrum for the vegetation canopy target. The portions of the spectrum lo-
cated in the strong atmospheric water vapor absorption bands near 1400 and 1900 nm
are lost due to the lack of a measurable signal.
© 2008 by Taylor & Francis Group, LLC
AVIRIS and Related 21st Century Imaging Spectrometers 345
25002200190016001300
Wavelength (nm)
1000700400
0
5
10
Radiance (uW/cm^2/nm/sr)
15
20
Figure 14.10 Spectrally and radiometrically calibrated spectrum for the vegetation
canopy target.
14.2.3 Range of Investigations Pursued with AVIRIS Measurements
The AVIRIS imaging spectrometer was originally proposed to investigate two spe-
cific spectral signatures. These were the absorption doublet of the mineral Kaolinite
centered near 2200 nm and the red-edge of vegetation in the 700 nm region of the
250022001900160013001000700400
0.00
0.20
0.40
Reflectance
0.60
0.80
Wavelength (nm)
Figure 14.11 Atmospherically corrected spectrum from AVIRIS measurement of
a vegetation canopy. The 1400 and 1900 nm spectral regions are ignored due to
the strong absorption of atmospheric water vapor. In this reflectance spectrum the
molecular absorption and constituent scattering properties of the canopy are clearly
expressed and available for spectroscopic analysis.
© 2008 by Taylor & Francis Group, LLC
346 High-Performance Computing in Remote Sensing
TABLE 14.2
Diversity of Scientific Research and Applications Pursued with
AVIRIS
Atmosphere: Water Vapor, Clouds Properties, Aerosols, Absorbing Gases
Ecology: Chlorophyll, leaf water, lignin, cellulose, pigments,
structure, nonphotosynthetic constituents
Geology and soils: Mineralogy, geochemistry, soil type
Coastal and inland Chlorophyll, plankton, dissolved organics, sediments,
waters: bottom composition, bathymetry
Snow and ice Snow cover fraction, grainsize, impurities, melting
hydrology:
Biomass burning: Subpixel temperatures/extent, smoke, combustion products
Environmental Contaminants directly and indirectly, geological substrate
hazards:
Calibration: Aircraft and satellite sensors, sensor simulation, validation
Modeling: Radiative transfer model validation and constraint
Commercial: Mineral exploration, agriculture, and forest status
Algorithms: Autonomous atmospheric correction, spectra derivation
Other: Human infrastructure
spectrum. Fortunately, a full solar reflected energy imaging spectrometer was de-
veloped and the AVIRIS instrument has been used to pursue a much broader range
of scientific research and application objectives. Table 14.2 summarizes the span of
AVIRIS investigations across a range ofscientific researchand application disciplines.
This list illustrates the power of imaging spectroscopy that arises from measurement
of the complete solar reflected spectrum from 400 to 2500 nm. Imaging spectroscopy
becomes relevant whenever a material absorption or scattering spectral signature can
be directly or indirectly linked to the scientific research or application question of
interest.
14.2.4 The AVIRIS Data Archive and Selected Imaging Spectroscopy
Analysis Algorithms
The AVIRIS archive is maintained at the Jet Propulsion Laboratory. All data in the
archive are available for distribution in units of calibrated upwelling spectral radi-
ance. The current volume of data exceeds 10 Terabytes. Geographically the AVIRIS
archive includes measurements from northern Alaska to southern Argentina as well
as from Hawaii to portions of the eastern Caribbean. From the perspective of sur-
face composition, the archive includes a wide range of vegetation types ranging from
tropical to temperate to desert environments. In addition, a wide range of geological
surfaces have been measured spanning sedimentary, metamorphic, and igneous rock
domains as well as a diversity of soils. Snow and ice data sets have been collected
including form the frozen Beaufort Sea in Alaska as well as many snow- and ice-
covered mountain regions of the western United States. The AVIRIS archive includes
atmospheric conditions from tropical to desert as well as high to low aerosol loading.
© 2008 by Taylor & Francis Group, LLC
AVIRIS and Related 21st Century Imaging Spectrometers 347
A number of active fires have been measured over the years capturing the associated
fire spectral signatures. In total, the AVIRIS archive contains the most diverse set of
well-calibrated Earth spectral signatures collected to date.
In the years over which the AVIRIS data set has been collected a wide range of new
analysis algorithms have been developed and applied. A number of these algorithms
have involved forward inversion of the AVIRIS spectra with a physically based model.
Algorithms for the inversion of AVIRIS spectra for water vapor [11, 12, 13] as well as
simultaneous inversions for water, vapor,liquid water, andfrozen water [14]have been
developed. Related forward inversion algorithms havebeendeveloped for determining
the temperature and fractionalareaofactively burningbiomass fires [15, 16].Inversion
of a physically based model with imaging spectrometer measurement is one of the
more powerful methods for extracting parameters from well-calibrated spectra. These
parameters are then used to pursue the science research or application objectives of
interest.
Another important set of algorithms applied to AVIRIS imaging spectroscopy mea-
surements includes spectral mixture analysis. These approaches began with simple
unmixing [17, 18] and extended to multiple endmember spectral mixture analysis
(MESMA) [19]. An automated Monte Carlo spectral analysis method has also been
developed [20, 21], as have techniques for the estimation of spectral endmembers
from within imaging spectrometer data sets [22]. Spectral mixture analysis appropri-
ately addressed the fact that every AVIRIS measured spectrum contains a mixture of
spectral signatures. The derived component fractions for each spatial element in an
image enable pursuit of a wide range of investigations.
Spectral feature fitting is an imaging spectroscopy algorithm approach that has
been pursed extensively by scientists of the United States Geological Survey. The
result of this multidecade activity is the Tetracorder algorithm [23]. This approach
focuses on the direct spectral fitting of measured absorption features with those from
a comprehensive spectral library. Results of this and related spectral feature fitting
algorithms have been applied successfully to a wide range of geological research
investigations as well as other scientific disciplines.
A wide range of supervised and unsupervised classification algorithms have been
developed for use with AVIRIS and other imaging spectrometer measurements. The
Multispec software suite [24] of the Purdue Research Foundation represents an ex-
ample containing a wide range of classification algorithms used for the analysis of
AVIRIS measurements.
Only a few examples of algorithms employing physical model inversion, spectral
mixture analysis, spectral feature analysis, and classification have been briefly de-
scribed here. In addition, many hybrid algorithms exist that include aspects of two or
more of these approaches. OtherAVIRIS imaging spectroscopymeasurement analysis
methods exist as well. To explore the breadth and depth of algorithms that have been
successfully applied to AVIRIS measurements, a full search of the refereed and non-
refereed literature is required and is beyond the scope of this chapter. Finally, given
the diverse spectral signature content of high precision and high uniformity spectra,
there is clear potential for the development of new algorithms and approaches for the
extraction of valuable information from existing AVIRIS measurements.
© 2008 by Taylor & Francis Group, LLC
348 High-Performance Computing in Remote Sensing
14.3 Objectives and Characteristics of a Spaceborne Imaging
Spectrometer for the Moon
The Moon Mineralogy Mapper (M
3
) was selected as a NASA Discovery Mission of
Opportunity in early 2005. The M
3
instrument is a 21st century high uniformity and
high precision imaging spectrometer of the pushbroom type. M
3
measures spectra as
images in the solar dominated portion of the electromagnetic spectrum. The basis for
the use of imaging spectroscopy for mapping the mineralogy of the moon is found
in the diversity of lunar minerals returned to Earth from the Apollo missions of the
late 20th century. High precision (signal-to-noise ratio) is required to measure the less
pronounced spectral signaturesof dust and mineralmixtures as wellas to measurehigh
quality spectra near the poles where the solar illumination is reduced. M
3
is planned
to be launched as a guest instrument provide by NASA on the Chandrayaan-1 mission
of the Indian Space Research Organization (ISRO) in early 2008.
14.3.1 Objectives of the Moon Mineralogy Mapper
The overarching science and exploration objectives of the M
3
instrument and mission
are
r
Characterize and map the lunar surface composition in the context of its geo-
logic evolution.
r
Assess and map the Moon mineral resources at highspatial resolution to support
planning for future, targeted missions.
These overarching objectives translate into the following more specific objectives:
r
Evaluate the primary components of the crust and their distribution across the
highlands.
r
Characterize the diversity and extent of different types of basaltic volcanism.
r
Explore for, identify, and assess deposits containing volatiles.
r
Map fresh craters to assess abundance of small impacts in the recent past.
r
Identify and evaluate concentrations of unusual/unexpected minerals.
All of these objectives may be pursued based upon the spectral signatures of the
materials on the surface of the moon. Figure 14.12 shows a suite of spectra measured
from samples returned to the Earth during the Apollo missions of the 1960s and the
1970s. To pursue these material identification objectives, an imaging spectrometer
measuring reflected light in the solar reflected spectrum is required.
14.3.2 Characteristics of the M
3
Imaging Spectrometer
Based upon the scientific objectives and the spectroscopic approach, a detailed spec-
ification of the M
3
imaging spectrometer was established [25, 26]. These spectral,
© 2008 by Taylor & Francis Group, LLC
AVIRIS and Related 21st Century Imaging Spectrometers 349
28002500220019001600
Wavelength (nm)
13001000700400
0
0.1
0.2
0.3
0.4
Reflectance
0.5
0.6
0.7
0.8
0.9
1
N-Olivine C-Olivine
Olivine <45 mm
78235 Cpx <45 mm
15415 Plag <250 mm
A881757 Cpx <45 mm
Terrestrial
OH absorption
12063 Opx <500 mm
Maskelynite
12030 Soil 20-45 mm
Soil 67481 20-45 mm
Soil 14141 20-45 mm
Figure 14.12 Spectra of samples returned by the NASA Apollo missions show-
ing the composition-based spectral diversity of surface materials on the Moon. This
spectral diversity provides the basis for pursing the objectives of the M
3
mission with
an imaging spectrometer. Upon arrival on Earth the ultradry lunar Samples have ad-
sorbed water, resulting in the absorption feature beyond 2700 nm. These spectra were
measured by the NASA RELAB facility at Brown University.
radiometric, spatial, temporal, and uniformity requirements are given in Table 14.3.
The reference radiance at which the precision requirement of M
3
is set is the modeled
radiance from the returned Apollo 16 soil reflectance (BKR1LR117) illuminated with
a 0-degree solar zenith angle.
With the detailed spectral, radiometric, spatial, temporal, and uniformity specifica-
tions, a high uniformity and high precision Offner pushbroom imaging spectrometer
design was selected [27]. Figure 14.13 shows the mechanical design implementation
for M
3
. This design uses a three-mirror telescope with fold mirror to feed light through
a uniform slit to the Offner spectrometer. The spectrometer consists of one spherical
mirror used twice and a custom convex grating. The spectrally dispersed light from
the spectrometer passes through an order sorting filter to the detector array that is
sensitive from 430 to 3000 nm. This comparatively simple design was enabled by the
structured blaze convex grating in the core of the uniform full-range spectrometer.
M
3
is a high uniformity and high precision pushbroom imaging spectrometer. The
cross-track swath is 40 km with 70 m spatial sampling in the along-track and cross-
track directions. For each 70 m advance of the image swath in the orbit direction
around the moon, a full set of 600 cross-track spectra will be read out from the
© 2008 by Taylor & Francis Group, LLC
350 High-Performance Computing in Remote Sensing
TABLE 14.3 Spectral, Radiometric, Spatial, Temporal and
Uniformity Specifications of The M
3
Imaging Spectrometer for the
Moon
Spectral properties:
Range 430 to 3000 nm in the solar reflected spectrum
Sampling 10 nm across spectral range
Response FWHM < 1.2 of sampling
Accuracy Calibrated to 10% of sampling
Precision Stable within 5% of sampling
Radiometric properties:
Range 0 to specified saturation radiance (2 × Apollo 16)
Sampling 12 bits measured
Response Linear to 1%
Accuracy > 90% absolute radiometric calibration
Precision (SNR) > 400 equatorial reference
> 100 polar reference
Spatial properties:
Range 24 degree field-of-view (FOV)
Sampling 0.7 milliradian cross and along track
Response FWHM of IFOV < 1.2 of sampling
Temporal properties:
Global > 95% coverage in 2 years (reduced resolution)
Target > 5% coverage in 2 years (full resolution)
Uniformity:
Spectral-crosstrack > 99% uniformity of position across the FOV
Spectral-IFOV > 90% IFOVs uniformity over the spectral range
Spectrometer
Grating
Detector Array
Telescope
Figure 14.13 Mechanical drawing of the M
3
imaging spectrometer that has been
built for mapping the composition of the Moon via spectroscopy. The M
3
instrument
has the following mass, power, and volume characteristics: 8 kg, 15 Watts, 25 ×18 ×
12 cm. The M
3
instrument was built in 24 months.
© 2008 by Taylor & Francis Group, LLC
AVIRIS and Related 21st Century Imaging Spectrometers 351
40 km Swath
Orbit Path
Continuous
70 m Sampling
260 Band
Spectrum
Figure 14.14 Depiction of the spectral spatial and pushbroom imaging approach of
the M
3
high uniformity and high precision imaging spectrometer.
detector array simultaneously. Each spectrum will consist of 260 spectral channels
from 430 to 3000 nm. A depiction of the type of data to be measured by M
3
is shown
in Figure 14.14. To accommodate data rate limitations for transmission to Earth, M
3
will also have a global data acquisition mode with reduced spectral and spatial res-
olution. In this mode, 260 spectral channels will be selectively summed to give 86
contiguous channels covering the range from 430 to 3000 nm. In the spatial domain
the data will by summed to give 140 meter samplings. The balance between coverage
of the Moon in global and full resolution modes will depend on the available data
downlink at the time of the mission. A critical characteristic of M
3
is uniformity. The
cross-track spectral uniformity enables the direct comparison of spectra across the
swath and throughout the image and is required for a range of advanced computa-
tional analysis techniques. The excellent spectral-IFOV uniformity of M
3
is required
for rigorous spectroscopic analysis across the spectral range of M
3
. If the area sam-
pled on the surface changes with wavelength, a basic assumption of spectroscopy is
violated.
14.3.3 Prospects for the M
3
Imaging Spectrometer Data Set
M
3
is the first imaging spectrometer designed to provide complete coverage of a
planetary sized body in our solar system at high spatial resolution. The data set
is currently expected to have a volume of at least 5.8 Terabytes at the end of the
mission. During the mission, portions of the M
3
data set will be available for analysis
through the NASA planetary data system (PDS). After the end of the mission, final
© 2008 by Taylor & Francis Group, LLC
352 High-Performance Computing in Remote Sensing
calibration and validation the complete data set will become available. Throughout
the M
3
mission and following, the imaging spectrometer measurements will be used
to characterize and map the lunar surface composition and to assess and map mineral
resources at high spatial resolution to support future missions. The volume, quality,
and comprehensive nature of the M
3
data set presents a unique opportunity for the
application of high-performance computing.
14.4 Objectives and Characteristics of a Future Spaceborne
Imaging Spectrometer for the Earth
The diversity and complexity of scientific research questions being pursued for the
global Earth system require the use of satellite observations. Due to limits of technol-
ogy, early satellite observations systems measured only a few spectral bands. With
only a few spectral bands the typical algorithms consisted of band ratios and band in-
dices. The normalize vegetation difference index (NDVI) [28] isa prominentexample.
There are limitations to the interpretation and portability of these simple algorithms
using only a few spectral bands, because many more than two components of the
Earth’s surface and atmosphere system contribute to the measured signals. Realiza-
tion of these limitations and the advance of technology have led to the current set of
Earth observing instruments that in some cases measure tens of spectral bands. How-
ever, even with tens of spectral bands, limitations arise for quantitative and portable
algorithms due to the undersampling of the available spectral signal. Now in the 21st
century, new Earth observing instruments are being designed and proposed with full
spectral coverage in the solar reflected spectrum. In this section a description of ob-
jectives and characteristics of an Earth imaging spectrometer focused on terrestrial
and aquatic ecosystem is discussed.
14.4.1 Objectives of an Earth Imaging Spectrometer for Measuring
the State of Terrestrial and Aquatic Ecosystems
The overarching objective of this Earth imaging spectrometer is understanding the
health, composition, and productivity of both terrestrial and aquatic ecosystems at
a seasonal time scale over the entire globe. The aquatic focus is in the coastal and
inland water regions where the ecosystem diversity is greatest. Companion objectives
are to understand how these terrestrial and aquatic ecosystems are being altered
by human activities and how these changes affect the fundamental processes upon
which these ecosystems depend. From these objectives, a set of research area topics
arise including: (1) ecosystem function and diversity, (2) biogeochemical cycles, and
(3) ecosystem disturbance and response. To address the specific questions in these
research areas, a set of measurement products have been identified. These products
are given in Table 14.4.
© 2008 by Taylor & Francis Group, LLC
AVIRIS and Related 21st Century Imaging Spectrometers 353
TABLE 14.4
Earth Imaging Spectrometer Products for
Terrestrial and Aquatic Ecosystems Understanding
Terrestrial ecosystem science products:
Calibrated full-optical range surface radiance and reflectance
Fractional cover of biotic and abiotic materials
Leaf and canopy water content
Leaf and canopy pigments and nitrogen concentrations
Plant functional types and species dominance
Ecosystem disturbance and response
Plant light-use efficiency and productivity
Aquatic ecosystem science products:
Calibrated full-optical range surface radiance and reflectance
Coastal ocean and inland water optical properties and ecosystem
Component concentrations
Phytoplankton functional groups & species dominance
Benthic and inland water communities
Plant physiological status
Ecosystem productivity
Ecosystem disturbance and response
Based upon the almost 20 years of research results using AVIRIS measurements
as well as measurements from other imaging spectrometers and in conjunction with
theoretical, laboratory, and field spectroscopic efforts, it has become clear that an
Earth spaceborne imagingspectrometer is requiredto pursue these objectives globally.
The use of imaging spectroscopy to pursue these objectives is further supported by
the 2007 National Research Council, Committee on Earth Science and Applications
from Space: A Community Assessment and Strategy for the Future [29]. Among
other important missions, an Earth imaging spectrometer is specified to pursue a set
of objectives for understanding and managing ecosystems.
14.4.2 Characteristics of an Ecosystem Focused Earth
Imaging Spectrometer
To generate the required science products, a basis for what is measurable from a satel-
lite perspective must be established. The literature now contains numerous publica-
tions establishing the physical basis and approach for generating the required science
products from spectroscopic measurements. From this work spanning 20 years, a set
of spectral, radiometric, spatial, temporal, and uniformity requirements have been
defined for such measurements. These represent one set of requirements that are fea-
sible with currently available technology and are given in Table 14.5. One of the most
critical measurement requirements is the precision or signal-to-noise ratio. For this
imaging spectrometer, the precision is specified at a set of four reference radiances
given in Figure 14.15. The corresponding signal-to-noise ratios required are shown
in Figure 14.16. The signal-to-noise ratios specified here are high in order to pursue
© 2008 by Taylor & Francis Group, LLC
354 High-Performance Computing in Remote Sensing
TABLE 14.5
Nominal Characteristics of an Earth Imaging Spectrometer
for Terrestrial and Aquatic Ecosystems’ Health, Composition, and
Productivity At a Seasonal Time Scale
Spectral properties:
Range 380 to 2510 nm
Sampling 10 nm (uniform over range)
Response < 1.2× sampling (FWHM) (uniform over range)
Accuracy < 0.5nm
Radiometric properties:
Range 0 to specified saturation radiance
Sampling 14 bits measured (possibly 13 down linked)
Response > 95% absolute radiometric calibration
Accuracy > 90% absolute radiometric calibration
> 98% on-orbit reflectance
Stability > 99.5%
Precision (SNR) As specified at benchmark radiances
Linearity > 99% characterized 0.1%
Polarization < 2% sensitivity, characterized to 0.5%
Stray light < 1:200 characterized to 0.1%
Spatial properties (at
˜
700 km altitude):
Cross-track samples 2440
Range 146 km FOV (12 degrees)
Sampling 60 m
Response < 1.2 sampling (FWHM)
Temporal properties:
Global land coast repeat 19 days at the equator
Rapid response revisit 3 days
Uniformity:
Spectral cross-track > 95% cross-track uniformity
Spectral-IFOV > 95% spectral IFOV uniformity
the required science products in the low signal areas of coastal water and dark green
vegetation.
14.4.3 Roles for High-Performance Computing
The current specifications for this imaging spectrometer create many opportunities
for high-performance computing. The first and perhaps most important is fast loss-
less data compression. The instantaneous data rate of the imaging spectrometer is
200 megabits per second. Even limiting to only collecting daylight data over the
terrestrial and coastal regions of the Earth will overwhelm satellite onboard storage
and data downlink capabilities. The science community is also unwilling to accept
compression algorithms that lose some of the measured data fidelity. Realization
of the data rate and volume challenges of imaging spectrometers have led to new
lossless compression approaches [30]. Some recent results are encouraging with fast
© 2008 by Taylor & Francis Group, LLC
AVIRIS and Related 21st Century Imaging Spectrometers 355
24502150185015501250
Wavelength (nm)
950650350
0
5
10
15
0.01 Reflectance (z45)
0.05 Reflectance (z45)
0.25 Reflectance (z23.5)
0.50 Reflectance (z23.5)
20
25
30
Radiance (uW/cm^2/nm/sr)
Figure 14.15 Benchmark reference radiance for an Earth imaging spectrometer
focused on terrestrial and aquatic ecosystem objectives.
lossless compression ratios of greater than 4 to 1 achieved for data collected by an
airborne pushbroom imaging spectrometer that is a close analog to this spaceborne
Earth imaging spectrometer. Irrespective of the use of lossless compression on-orbit
and for downlink, the size of the uncompressed data set on the ground will be large.
Table 14.6 shows the orbit, daily, and yearly data volumes with the spectra held at
16 bit integers. The scale of this data set and the information contained within the
measured spectra demand the use of high-performance computing in the areas of
storage, algorithms, data I/O, computations, and visualization.
24502150185015501250
Wavelength (nm)
950650350
0
200
400
600
SNR 0.01 Reflectance (z45)
SNR 0.05 Reflectance (z45)
SNR 0.25 Reflectance (z23.5)
SNR 0.50 Reflectance (z23.5)
800
1000
1200
Signal-to-Noise Ratio
Figure 14.16 The signal-to-noise ratio requirements for each of the bench-mark
reference radiances.
© 2008 by Taylor & Francis Group, LLC
356 High-Performance Computing in Remote Sensing
TABLE 14.6
Earth Ecosystem Imaging Spectrometer Data Volumes
Period Volume Period Volume Period Volume Period Volume
Orbit 94 GB Day 1.37 TB Year 502 TB Mission 1.5 PB
14.5 Acknowledgments
This work was carried out at the Jet Propulsion Laboratory of the California Institute
of Technology, Pasadena, California, under contract with the National Aeronautics
and Space Administration. The broad and deep advances in the field of imaging
spectroscopy over the past two decades derive from the contributions of an extensive
group of investigators pursuing research questions spanning a wide range of scientific
disciplines.
References
[1] G. Vane, A. F. H. Goetz, J. B. Wellman, Airborne imaging spectrometer: A
new tool for remote-sensing. IEEE Transactions on Geoscience and Remote
Sensing, vol. 22, pp. 546–549, 1984.
[2] A. S. Mazer, M. Martin, M. Lee, et al., Image-processing software for imaging
spectrometry data-analysis. Remote Sensing of Environrment, vol. 24, pp. 101–
110, 1988.
[3] G. Vane, R. O.Green, T. G. Chrien,et al., The AirborneVisible Infrared Imaging
Spectrometer (AVIRIS). Remote Sensing of Environment, vol. 44, pp. 127–143,
1993.
[4] R. O. Green, M. L. Eastwood, C. M. Sarture, et al., Imaging spectroscopy and
the Airborne Visible Infrared Imaging Spectrometer (AVIRIS). Remote Sensing
of Environment, vol. 65, pp. 227–248, 1998.
[5] A. Berk, L. S. Bernstein, D.C. Robertson, MODTRAN: A moderate resolution
model for LOWTRAN 7. Final report, GL-TR-0122, AFGL, Hanscomb AFB,
MA., pp. 42, 1989.
[6] G. P. Anderson, M. L. Hoke, J. H. Chetwynd, Jr., A. J. Ratkowski, L. S. Jeong,
A. Berk, L. S. Bernstein, S. M. Adler-Golden, et al., MODTRAN4 radiative
transfer modeling for remote sensing. Proc. SPIE, vol. 4049, pp. 176–183,
2000.
[7] T. G. Chrien, R. O. Green, M. Eastwood, Laboratory spectral and radiometric
calibration of the Airborne Visible/Infrared Imaging Spectrometer (AVIRIS).
Proc. SPIE, vol. 1298, Imaging spectroscopy of the terrestrial environment,
1990.
© 2008 by Taylor & Francis Group, LLC
AVIRIS and Related 21st Century Imaging Spectrometers 357
[8] T. G. Chrien, R. O. Green, C. Chovit, M. Eastwood, J. Faust, P. Hajek, H.
Johnson, H. I. Novack, C. Sarture. New calibration techniques for the Airborne
Visible/Infrared Imaging Spectrometer (AVIRIS), Proc. Fifth Annual Airborne
Earth Science Workshop, JPL Pub. 95–1, 1995.
[9] Green, R. O., J. E. Conel, V. Carrere, C. J. Bruegge, J. S. Margolis, M. Rast,
G. Hoover, In-flight validation and calibration of the spectral and radio-
metric characteristics of the Airborne Visible/Infrared Imaging Spectrome-
ter (AVIRIS). Proc. SPIE Conference on Aerospace Sensing, Imaging Spec-
troscopy of the Terrestrial Environment, Orlando, Florida, 1990.
[10] R. O. Green, J. E. Conel, C. Margolis, C. Chovit, J. Faust, In-flight calibra-
tion and validation of the Airborne Visible/Infrared Imaging Spectrometer
(AVIRIS). Proc. Sixth Annual Airborne Earth ScienceWorkshop,Jet Propulsion
Laboratory, JPL Pub. 96–4, vol. 1, March 3–5, 1996.
[11] R. O. Green, V. Carrere, J. E. Conel, Measurement of atmospheric water vapor
using the Airborne Visible/Infrared Imaging Spectrometer. Proc. of the ASPRS
conference on Image Processing ’89, pp. 23–26, 1989.
[12] B. C. Gao, A. F. H. Goetz, Column atmospheric water-vapor and vegetation
liquid water retrievals from airborne imaging spectrometer data. Journal of
Geophysical Research-Atmospheres, vol. 95, pp. 3549–3564, 1990.
[13] R. O. Green, J. E. Conel, J. Margolis, C. Bruegge, G. Hoover, An inversion al-
gorithm for retrieval of atmospheric and leaf water absorption from AVIRIS ra-
diance with compensation for atmospheric scattering. Proc. of the Third AVIRIS
Workshop, JPL Publication 91–28, pp. 51–61, 1991.
[14] R. O. Green, T. H. Painter, D. A. Roberts, et al. Measuring the ex-
pressed abundance of the three phases of water with an imaging spectrom-
eter over melting snow. Water Resources Research, vol. 42, no. W10402,
2006.
[15] R. O. Green, Estimation of biomass fire temperature and areal extent from cal-
ibrated AVIRIS spectra. Proc. Sixth Annual Airborne Earth Science Workshop,
Jet Propulsion Labratory, JPL Public 96, vol. 1, March 3–5, 1996.
[16] P. E. Dennison, K. Charoensiri, D. A. Roberts, et al. Wildfire temperature and
land cover modeling using hyperspectral data. Remote Sensing of Environment,
vol. 100, pp. 212–222, 2006.
[17] D. A. Roberts, M. O. Smith, J. B. Adams, Green vegetation, nonphotosynthetic
vegetation, and soils in AVIRIS data. Remote Sensing of Environment, vol. 44,
pp. 255–269, 1993.
[18] J. B. Adams, M. O. Smith, A. R. Gillespie, Imaging spectroscopy: interpre-
tation based on spectral mixture analsyis. In: Remote Geochemical Analysis:
Elemental and Mineralogical Composition, C. M. Pieters and P. Englert, Eds.,
Cambridge University Press, New York, pp. 145–166, 1993.
© 2008 by Taylor & Francis Group, LLC
358 High-Performance Computing in Remote Sensing
[19] D. A. Roberts, M. Gardner, R. Church, et al., Mapping chaparral in the Santa
Monica Mountains usingmultipleendmember spectral mixturemodels, Remote
Sensing of Environment, vol. 65, pp. 267–279, 1998.
[20] G. P. Asner, Biophysical and biochemical sources of variability in canopy
reflectance. Remote Sensing of Environment, vol. 64, pp. 234–253, 1998.
[21] G. P. Asner, D. B. Lobell, A biogeophysical approach to automated SWIR
unmixing of soils and vegetation. Remote Sensing of Environment, vol. 74,
pp. 99–112, 2000.
[22] A. Plaza, P. Martinez, R.M. Perez, J. Plaza. A new approach to mixed pixel clas-
sification of hyperspectral imagery based on extended morphological profiles.
Pattern Recognition, vol. 37, no. 6, pp. 1097–1116, 2004.
[23] R. N. Clark, G. A. Swayze, K. E. Livo, et al., Imaging spectroscopy: Earth
and planetary remote sensing with the USGS Tetracorder and expert systems,
Journal of Geophyisical Research-Planets, vol. 108, no. 5131, 2003.
[24] L. Biehl, D. Landgrebe, MultiSpec—A tool for multispectral-hyperspectral
image data analysis. Computers & Geosciences, vol. 28, pp. 1153–1159, 2002.
[25] C. Pieters, J. Boardman, B. Buratti, R. Clark, R. O. Green, J. W. Head, T. B.
McCord, J. Mustard, C. Ryunyon, M. Staid, J. Sunshine, L. A. Taylor, S. Tomp-
kins, Global mineralogy of the moon: A cornerstone to science and exploration,
Proc. Lunar & Planetary Science Conference, Houston, 2006.
[26] R. O. Green, C. Pieters, P.Mouroulis, G. Sellars,M. Eastwood, S. Geier, J.Shea,
The Moon Mineralogy Mapper: Characteristics and early laboratory calibration
results, Proc. Lunar & Planetary Science Conference, Houston, 2006.
[27] P. Mouroulis, R. O. Green, T. G. Chrien, Design of pushbroom imaging spec-
trometers for optimum recovery of spectroscopic and spatial information.
Applied Optics, vol. 13, pp. 2210–2220, 2000.
[28] J. W. Rouse, R. H. Haas, J. A. Schell, D. W. Deering, Monitoring vegetation
systems in the Great Plains with ERTS. Proc. Third ETRS Symp., Washington,
DC, NASA NASA SP353, 1973.
[29] Earth Science and Applications from Space: National Imperatives for the Next
Decade and Beyond,Committee on Earth ScienceandApplications from Space:
A Community Assessment and Strategy for the Future,TheNationalAcademies
Press, Washington, D.C., ISBN: 978-0-309-10387-9, 400 pages, 2007.
[30] M. Klimesh, Low-complexity adaptive lossless compression of hyperspectral
imagery. Proc. SPIE, vol. 6300, 9 pages, San Diego, CA, 2006.
© 2008 by Taylor & Francis Group, LLC