Advances in Gas Turbine Technology Part 17 docx
Bạn đang xem bản rút gọn của tài liệu. Xem và tải ngay bản đầy đủ của tài liệu tại đây (5.46 MB, 30 trang )
New Non-Destructive Methods of Diagnosing Health of Gas Turbine Blades
469
The soaking time affected also the change in thickness of the aluminium protective coating
(Fig. 4). The film thickness is calculated on the basis of ten distances measured in pixels (d
n
,
n = 1, 2, 3, … 10) – Fig. 5. The obtained distances (in pixels) were then multiplied by the scale
parameter, i.e. the size of one pixel in m. In that way the value of average thickness for the
aluminium coating was calculated for each of the recorded (and then analyzed) images. The
coating thickness was measured at three locations, i.e. on the leading edge, in the centre, and
on the trailing edge of the blade. Fig. 6 presents averaged values of the protective coating
thickness for various soaking times. On the basis of graphs in Fig. 3 and Fig. 6, for the needs
of examining the effect of high temperatures onto the blade material, the soaking time was
assumed to be 1h at constant temperature, i.e. 1223 K. It was the time when rapid growth in
the size of particles of the ’ phase occurred, with only slight increase in the coating
thickness.
Fig. 5. Measurement of coating thickness
Fig. 6. Soaking–time dependent variation in thickness of the protective coating
d
1
d
n
1
2
3
4
5
6
7
8
9
10
Advances in Gas Turbine Technology
470
Images of surfaces of blade specimens were acquired both before and after specimens
soaking in the furnace. The photos were taken on a purpose-built workbench (Bogdan &
Błachnio, 2007; Błachnio & Bogdan, 2008;) with a digital photo camera, while the surfaces
were illuminated with scattered white light. Repeatability of the obtained results was
proved by taking multiple photos of the same specimens, under the same conditions with
appropriate settings of parameter of the digital photo camera. The soaking of blade
specimens in the furnace led to alterations in colour of the surfaces. An exemplary set of
images is shown in Fig. 7.
Fig. 7. Images of surfaces of specimens soaked at various temperatures
It was also determined how the temperature of blade soaking affects their microstructures.
Examination was carried out using metallographic microsections and both an optical and a
scanning electronic microscope (SEM). Fig. 8 shows the (new) blade structure before
soaking. One can see the coating of the aluminium alloy (Fig. 8a) diffused in the blade
parent metal as well as cuboidal precipitates of the ’ phase of the alloy (Fig. 8b).
Fig. 8. Metallographic structure of the blade prior to soaking: a) coating (magn. x450);
b) subsurface layer (magn. x4500)
The microstructures of high-temperature affected gas turbine blades were also observed.
This provided detailed information about changes in the microstructures of both the coating
layer (alteration in the coating thickness) and in the parent material. Changes in material
parameters, mainly modifications in the size and distribution of the ’ phase, substantially
affect mechanical properties of the material (Błachnio, 2009; Decker & Mihalisin, 1969;
Dudziński, 1987; Mikułowski, 1997; Poznańska, 2000; Sims et al.,1987). Results of the
examination of specimens subjected to soaking in the furnace at 1223 K and 1323 K are
shown in Fig. 9 and Fig. 10, respectively.
a)
b)
1023 K 1123 K 1223 K 1323 K
1423
K
New Non-Destructive Methods of Diagnosing Health of Gas Turbine Blades
471
Fig. 9.
Metallographic structure of the blade after soaking for 1 h at 1223 K: a) coating
(magn. x450); b) subsurface layer (magn. x4500)
Fig. 10. Metallographic structure of the blade after soaking for 1 h at 1323 K: a) coating
(magn. x450); b) subsurface layer (magn. x4500)
Relationship between the average thickness of the aluminium alloy coating and the soaking
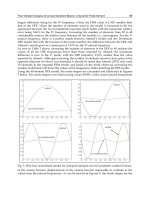
temperature of specimens is graphically shown in Fig. 11.
Fig. 11. Variation in the aluminium layer thickness against temperature
One can see the non-linear growth of the coating as a function of temperature, both nearby
the surface and within the diffused layer. In consequence of that growth the layers exhibit
less density (poorer tightness) and increased roughness that leads to amendments of the
reflection parameters with regard to the incident light that illuminates the surface. In turn,
b) a)
b)
a)
Advances in Gas Turbine Technology
472
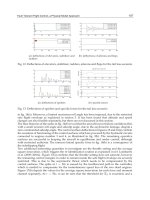
the graphic relationship between the average value of the ’ strain hardening phase
emissions and the heating temperatures for the EI 867-WD alloy is plotted in Fig. 12 and
demonstrates the exponential nature, but can be approximated with a polynomial.
Fig. 12. Variation in γ’ particles of average size against temperature
Examination of the microstructure of blade specimens revealed that as early as at 1123 K
there appeared the initial stage of coagulation of precipitates of the strengthening ’ phase
of relatively regular structure and very high density. As the temperature kept growing, the
structure of the ’ phase became less regular, and grain size was also growing. The initial
period when cubic grains joined together to form plates started at 1223 K (Fig. 9b). It was
found that as soon as the temperature reached 1323 K, the substantial growth and
coagulation of ’ phase precipitates followed; the ’ precipitates adopted shapes of plates
(Fig. 10b). Also, the number of particles was reduced but they were much larger than those
at 1223 K.
To determine the blade serviceability (fit-for-use) threshold, it proved reasonable to develop
a nomogram that presented correlation between the colour saturation in blade images and
the size of the ’ precipitates. The following assumptions resulting from the already
described laboratory experiment were adopted:
1. Illumination – scattered white light;
2. No disturbing interferences of light reflected from other surfaces;
3. New gas turbine blades were used for tests;
4. Specimens cut out of blades were randomly selected and subjected to soaking (three
pieces at a time) at five temperature values with the increment of 100 K, starting from
the temperature of 1023 K;
5. Alteration in saturation (amplitudes of different wavelengths) of primary colours was
adopted as the parameter that defines alterations in both chrominance and luminance
of the examined surfaces.
To determine parameters that would enable description of the degree to which the
microstructure of examined surfaces was changed (overheated), the technique of image
analysis for the decomposition of primary colours, i.e. Red, Green and Blue (RGB) and
shades of grey (parametric description of histograms) was employed. Due to the nature of
the investigated phenomenon it was reasonable to only consider changes in the locations of
New Non-Destructive Methods of Diagnosing Health of Gas Turbine Blades
473
maximum saturation amplitudes (for individual histograms representing distributions of
brightness of digital images (Bogdan, 2008) – Fig. 13.
Fig. 13. Changes in locations of maximum amplitudes of saturation with RGB colours and
shades of grey for various temperatures of specimen soaking
In order to find correlations between changes in colour of blade surfaces and the effect of
temperature upon the blade microstructure the following nomograms were developed (Fig.
3.14 a, b) for the assessment of blade condition.
The assessment of blade condition is based on colour analysis of blade-surface images and is
closely related with the material criterion (modification in the strengthening
’ phase , i.e. in
both changes of shapes from cuboidal to plate-like and growth of precipitates), i.e.
deterioration in high-temperature creep resistance and heat resistance after exceeding the
temperature threshold of 1223 K. The nomogram that presents relationship between changes
in colours of blade surface (in Red and greys) and temperature of blade soaking serves as
the basis for the assessment of how much the microstructure of the EI 867-WD alloy was
affected. When a mathematical description of the discussed phenomenon is introduced, the
following regression curve equations result (the nomogram in Fig. 14b) for changes in:
intensity of shades of grey (x
2
):
0.0189( 1150)
2
1
0.2793 187.1
z
xe
(2)
the square of the correlation coefficient: R
2
=0,9998
average size of γ’ precipitates (y
2
):
0.0142( 1150 )
2
1
0.0058 0.1
z
ye
(3)
the square of the correlation coefficient: R
2
=0,9998
Advances in Gas Turbine Technology
474
Fig. 14. Nomogram for the assessment of health of gas turbine blades on the basis of a) –
alteration in Red saturation, b) – changes in shades of grey, as affected with changes in
γ’ precipitates at different temperatures of blade soaking
New Non-Destructive Methods of Diagnosing Health of Gas Turbine Blades
475
average size of γ’ precipitates as a function of greys intensity:
0.7513
22
0.11512( 187.1)yx (4)
where: z
1
– temperature [K].
Based on the foregoing functional relationship (equation 4) it is possible to assess condition
of any blade (by its microstructure, i.e. the average size of the
’ precipitates) on the basis of
the already calculated value of the degree of grey on the images of blade surfaces. Such an
approach may prove useful, after taking account of disturbances and interferences, in
formulating a mathematical model – the assessment of blade condition on the basis of
changes in colours.
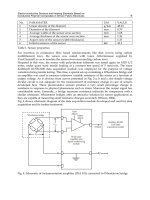
High temperature not only entails both changes in thickness of the aluminium coating (variable
light-reflecting area) and modifications in the structure of
’ phase. In practice, alterations of the
aluminium coating lead to variations of the luminance and chrominance of the surface that is
recorded by the optoelectronic system furnished with the light-sensitive detector, i.e. the CCD
matrix (digital images). The investigated microstructure of the subsurface layer reflects
transformation of the EI 867-WD alloy and serves as the evidence for overheating of its
structure (Fig. 10b, 11) after heating of the blade specimens at temperatures exceeding 1223K.
When assuming the material criterion, i.e. size alterations of emissions for the ’ phase, as a
criterion that is decisive for approval of blades for further operation, it is possible to find out the
operability threshold that would qualify or disqualify blades for further use.
The soaking of blade specimens leads to structural changes in the superalloy. At the same
time, roughness changes and thickness of the aluminum coating increases (Fig. 11). Changes in
the coating’s parameters (roughness, thickness) influence capability of the surface to reflect a
luminous flux and its spectral composition (saturation in RGB). In addition, investigation into
the chemical composition revealed that the soaking results in modification of the percentage
weight-in-weight concentration of elements that make up the coating – Table 1. A substantial
difference can be noted mainly in the content of such elements as W, Mo, Ni and Al.
Soaking
temperature
[K]
Elements by weight [%]
O Al Cr Fe Co Ni Mo W
1423[K] 9.89 9.66 11.73 0.68 4.50 41.12 11.73 10.58
1023[K] 6.26 2.94 10.31 0.84 5.44 57.27 5.66 7.28
Table 1. Chemical composition of the aluminium coating subjected to soaking at 1023 and
1423 [K]
These are also the factors that affect conditions of reflecting the luminous flux to result in
changes of colours of blade surfaces for particular soaking temperatures.
3. Diagnostic examination of operated stator vanes
The research program assumed examination of gas-turbine stator vanes of an aircraft jet
engine. The vanes were manufactured of the ŻS6K alloy. The alloy in question has been
strengthened with cubical
’ phase particles, the content of which amounts to approx. 64%.
It is classified to the group of cast alloys. Figures below (Figs 15, 16 and 17) present
exemplary sets of recorded images of turbine vanes with different degrees of overheating
(according to the already applied classification of vane condition).
Advances in Gas Turbine Technology
476
Fig. 15. Recording of vane surface images with a photo camera
Fig. 16. Recording of vane surface images with a videoscope No. 1
Differences in colours of recorded images of turbine vanes surfaces result from properties of
optoelectronic systems (chiefly, the CCD matrix) and variations in illumination (type of
light) used in particular instruments. When images were taken with a photo camera, the
illuminating light was uniformly scattered on entire surfaces of vanes, whilst the light
emitted by videoguides was of focused nature.
The analysis of the collected vane-surface images in terms of estimation of changes in
colours and shades of grey resulted in finding out the following changes in locations of
maximum amplitudes for particular component colours:
for images recorded with the digital photo camera (Fig. 18):
for images recorded with use of the videoscope No 1(Fig. 19):
I State II State
III State
IV State
V State
State I State II
State III
State IV
State V
New Non-Destructive Methods of Diagnosing Health of Gas Turbine Blades
477
Fig. 17. Recording of vane surface images with a videoscope No. 2
Fig. 18. Dislocation of the maximum saturation amplitudes of the image for various states of
vanes: a) RGB components; b) grey shades
Fig. 19. Changes in locations of maximum amplitudes of image saturation for various states
of vanes: a) RGB components; b) shades of grey
Advances in Gas Turbine Technology
478
for images recorded with the videoscope No 2 (Fig. 20)
Fig. 20. Changes in locations of maximum amplitudes of image saturation for various states
of vanes: a) RGB components; b) shades of grey
The curves (trend lines) demonstrate correlation coefficients much worse than those
obtained from laboratory tests. It has been caused by the forms of histograms (the colour
range of images is wider). However, for images recorded with a digital photo camera the
surface colour represents changes due to the exposure of the material to high temperature
(Fig. 18). To recognise microstructures of vanes that had already been in operation further
metallographic examination was carried out under laboratory conditions. As in the
experiment with new blades subjected to soaking, the examination was carried out using
metallographic microsections. Two microscopes were used: optical and scanning (SEM)
ones. After long-time operation the vanes manufactured of the ŻS6K alloy demonstrated
different health conditions. On the basis of metallographic examination (Bogdan, 2009) it
was found that initially, after some time of operation, the vane coating suffers no
degradation and its thickness is nearly the same as that of a new vane. Later on, it starts to
suffer swelling, which after a pretty short time may result in crack nucleation due to thermal
fatigue. Since the working agent (exhaust gas) of high kinetic energy keeps affecting the
vane material (the surface layer), successive changes in thickness of this layer follow. The
coating is getting thinner and thinner and, therefore, loses its protective properties.
Consequently, temperature of vane material grows by approx. 100 K and it is no longer
protected against chemical effect of the exhaust gas. The vane becomes much more
vulnerable to the exhaust gas, which results in complete deterioration of the protective
coating or even the parent material. Furthermore, morphology of the
’ phase has been
found to prove that after critical temperature is exceeded the alloy becomes overheated. The
turbine vane cannot be then considered serviceable (fit for use). Therefore, on the basis of
findings of vane microstructure analysis it is possible to state that vane no. 1 (i.e. State I)
exhibits correct microstructure, whilst the structure of vane no. 5 (i.e. State V) is overheated.
When these results are compared to those of the analysis of blade surface images, it is
possible to infer that vanes no. 1 and 2 are in sound condition, since parameters of image
properties are comparable. On the other hand, vanes no. 4 and 5 are overheated, as values
calculated from the histogram (as well as from the co-occurrence matrix) are much different
from those for earlier discussed items. Thus, it is feasible to demonstrate correlation between
New Non-Destructive Methods of Diagnosing Health of Gas Turbine Blades
479
images of surfaces of turbine vanes in service and condition of microstructures of these
vanes made of the ŻS6K alloy, covered with protective coatings. Metallographic
examination of vanes in service has also allowed of the development of two methods for
scanning surface images, i.e. one based on colour profiles, and another based on the value of
plane. The subsequent stages of the first method are listed below:
acquisition of images with a digital photo camera (laboratory conditions) or two
videoscopes (real operating conditions),
cutting of vane no. 5 (according to the earlier assessment, considered as overheated);
plotting of averaged colour profiles down the cutting lines with account taken of the
width of cutting (the model adopted to represent digital images – the RGB model);
determination of variations in the coating thickness and changes in both sizes of
precipitates and distribution of the strengthening
’ phase (the SEM microscope – the
computer-aided analysis of metallographic images);
on the basis of alterations in microstructure parameters - determination of colour lines
that represent overheated and non-overheated structures;
scanning of images of conditions I - V against the selected colour profiles.
According to the already applied classification, the fifth condition (state) denotes an
overheated vane. To verify this judgement, further metallographic examination was carried
out along two cutting lines. The changes in the coating thickness (on the aluminium matrix)
were measured and changes in size of precipitates and shape of the strengthening
’ phase
(the scanning (SEM) microscope, the computer-aided analysis of metallographic images).
Alterations in these two parameters are of crucial importance for the heat resistance and
high-temperature creep resistance of turbine vanes. Thus, it was possible to plot an
averaged colour profile (taking account of the width of cutting) that represents an
overheated structure (the selected range along line 1 – Figs 21a, b, and a non-overheated
structure (the selected range along line 2 – Figs 22 a, b).
Fig. 21. Averaged RGB profiles: a) along line no. 1 – parallel to the normal direction (KN);
b) the selected range that represents an overheated structure
Advances in Gas Turbine Technology
480
Fig. 22. Averaged RGB profiles: a) along the line no. 2 – perpendicular to the normal
direction (KN); b) the selected range that represents a non-overheated structure
Next, on the basis of two ranges of colour profiles (Fig. 21b, Fig. 22b) each component (one
pixel after another) of surfaces from states (I-V) of vanes was examined with regard to the
occurrence of colour dots (RGB) that correspond to either overheated or non-overheated
structure. Finally, the ratio of the overheated surface area to the overall surface area of the
vane was obtained (Fig. 23).
Fig. 23. Ratio of the overheated surface area to the total surface area for particular states of
the vane – detection of images with a photo camera and two types of videoscopes
New Non-Destructive Methods of Diagnosing Health of Gas Turbine Blades
481
In the second method (Bogdan & Błachnio, 2009), the surface colour of the State V vane (the
overheated structure according to metallographic examination) was assumed the
overheating criterion. Based on the developed histograms, the criterion threshold was
determined, where the threshold value was calculated on the basis of saturation (location of
the maximum amplitude) for individual RGB components (R+G+B/3=162). The criteria
threshold (value of the plane) was then referred to 3-D distributions of colours on surfaces
of individual vanes from states I to V. Points with values below the determined plane were
deemed the overheated surface points (pixels). Instances of estimating overheated surfaces
for vanes from states I and V have been graphically shown in Figs 24 and Fig. 25, with
images recorded with the digital photo camera. To make the image more clear, the Cartesian
coordinate system was adopted (where: x, y – dimensions of the vane image in pixels, z –
RGB saturation).
The dashed lines (Fig. 24a, Fig. 25a) represent the non-uniform effect of temperature on the
vanes under examination, caused by faulty operation of injectors – irregularities in the
combustion process inside the combustion chamber.
The area of overheated surface (the set of image points) extends as condition of vanes
deteriorates - Fig. 24c, Fig. 25c. Introduction of the threshold plane (criterion of vane
material overheating) in the 3-D charts of RGB distribution in images of surfaces of the
turbine component under examination allows of the determination of the ratio of the
overheated surface to the overall surface.(Fig. 26).
Fig. 24. Vane representing State I: a) surface image; b) 3-D distribution of RGB primary
colours; c) vane surface viewed from below – the result of introduction of the criterion plane
The best results were gained for images of vane surfaces recorded under laboratory
conditions with the digital photo camera. On the basis of the plotted curves (Fig. 23, Fig. 26
and Fig. 27) one can conclude that changes in colours of vane surfaces reflect
health/maintenance status of the examined turbine components. Application of one of the
z
Black colour – non-
overheated surface
x
y
State I
(0, 0)
x
y
z
a) b) c)
Advances in Gas Turbine Technology
482
two proposed methods , or both of them, of scanning the vane surfaces, i.e. the method
based on the already determined colour.
Fig. 25. Vane representing State V: a) surface image; b) 3-D distribution of RGB primary
colours; c) vane surface viewed from below – the result of introduction of the criterion plane
Fig. 26. Ratio of the overheated surface area to the overall surface area –images recorded
with a digital photo camera
Identical relationships were determined for images recorded with two videoscopes (Fig. 27).
a) b) c)
New Non-Destructive Methods of Diagnosing Health of Gas Turbine Blades
483
Fig. 27. Ratio of the overheated surface area to the overall surface area, a) images recorded
with videoscope No. 1, b) images recorded with videoscope No. 2
profiles that respectively represent the correct and the overheated structures, and the
method of the criterion plane improves likelihood (objectivity) of the assessment of the vane
condition. The computer-aided acquisition of images together with dedicated software for
image recognition will improve the process of the assessment itself and contribute to more
trustworthy analyses than it used to be in past. Percentage differences between particular
states result from the applied type of light and the way of illuminating the examined vanes.
Under laboratory conditions only white scattered light was used, whilst videoscopes
incorporate sources of light focused in other colour. Capability to recognize and record
colours may also be different due to light-sensitive CCD matrices installed in various
detection instruments. Nevertheless, it must be noted here that the application of
endoscopes (videoscopes) for the acquisition of images may be used to track (monitor)
changes in vane condition (development of failures, health/maintenance status of
components under examination) in the course of periodical inspections with no need to
dismantle the entire gas turbine.
4. Application of neural networks in diagnostics of vanes
The subsequent paragraphs present the opportunities to apply artificial neural networks to
diagnostic examination of vanes, both new ones (after heating) and those that have already
been in operation. The major objective was to develop such a neural network that would be
capable of diagnosing the technical status of the turbine component under test on the basis
of parameters for images of their surfaces. The metallographic examinations were carried
out to assess technical condition of the turbine component in question. Alterations of the
metal structure were taken into account, such as thickness alteration of the protective
aluminium coating and changes in average size of emissions for the ’ phase (the strain
hardening phase of the alloy, which is the phase that predominantly decides on creep
resistance properties). The metallographic examination made it possible to classify vanes
according to their technical condition. Fig. 28 explains an example of such classification of
vanes that demonstrate various technical conditions (wear degree) – the material criterion.
On the basis of conclusions related to assessment of the overheating degree (vanes
applicable and inapplicable for further operation) and drawn from microstructure
Advances in Gas Turbine Technology
484
examinations, the pattern images were adopted for vane surfaces representing various
degrees of deterioration (the neuronal pattern classification). Nowadays a great number of
supervised networks are available, although, in fact, they are merely options or variants of a
limited number of models. For this study only models that offered the best results
(verification of classification correctness on a set of test benchmarks) were taken into
account, i.e. the Multi-Layer Perceptron (MLP) and the network with Radial Basis Function
(RBF). Examples for structures of such networks are shown in Fig. 29. Each of the networks
is made up of three layers (one input layer, one hidden and one output) with the same
number of neurons per each layer.
Fig. 28. Acquisition of surface images of blades/vanes: a) heated (images recorded with a
photo camera); b) operated (images recorded with the videoscope no. 2 Three-state)
Fig. 29. Diagram of the network: a) the Multi-Layer Perceptron (MLP); b) the Radial Basis
Function (RBF) network
For the perceptron network the neurons are deployed exclusively between subsequent
layers and signals propagate to only one direction (the unidirectional network). The number
of hidden layers is actually unlimited, but it has been proved that two layers are perfectly
sufficient for any transformation of input data into output ones. Learning of networks of
1023 K 1123 K 1223 K 1323 K
1423 K
a)
State I
State II
State III State IV
State V
b)
output layer
hidden la
y
er
input layer
New Non-Destructive Methods of Diagnosing Health of Gas Turbine Blades
485
such a type is usually carried out in the mode with a teacher, by means of the gradient
method of the first of second order, by minimization of the error function. In case of a multi-
layer perceptron the excitation level of a neuron is the weighted sum of inputs (plus the
threshold value that is added as a bias). When a auxiliary bias input is added to a neuron the
networks acquires higher ability to learn owing to the possibility to shift the activation
threshold depending on the weight of the bias input. For Radial Basis Function (RBF)
networks the bias input is added exclusively to neurons within the output layer. Moreover,
the network type that uses the radial basis functions has usually one hidden layer that
comprises neurons with a radial function of activation. Output neurons usually represent
the weighted sum of signals coming from radial neurons deployed in the hidden layer.
Learning of that type of networks consists in selection of weight coefficients for the output
layer and parameters of the Gaussian radial basis functions.
The objective of the newly designed neuronal classifier was to develop a (computer-aided)
method that would enable to recognize technical condition of a specific vane on the basis of
its surface image (its properties). Two following cases were considered:
1. Two-state classification (for blades and operated vanes):
- class 1: operable status (non-overheated blade/vane);
- class 2: inoperable status (overheated blade/vane);
2. 2. Three-state classification (only for operated vanes):
- class 1: operable status (non-overheated vane);
- class 2: partly operable status (the vane suspected to be overheated);
- class 3: inoperable status (overheated vane);
The first phase of the development consisted in acquisition of data that were subsequently
used to model the network (input data) and for further tests (verification of ability to correct
classification). In order to reduce the amount of information, the colour images were
converted into black and white ones (8 bit encoding of grey shades, 0-255). Then 10 input
parameters were selected (image parameters). Six first parameters (P1-P6) describe the
histogram, i.e. distribution of pixel brightness. Four subsequent parameters (P7-P10) were
found out on the basis of the co-occurrence matrix (for the distance of 1 and angle
of 0º) – Table 2.
Designation Specification
P1 value of maximum saturation
P2 value of average brightness
P3 fluctuation of brightness distribution
P4 histogram skewness
P5 histogram kurtosis
P6 histogram excess
P7 contrast
P8 correlation
P9 energy
P10 homogeneity
Table 2. Input data – the feature vector
Advances in Gas Turbine Technology
486
The preliminary metallographic investigations (the material criterion) made it possible to
state that the new blades heated at the temperatures of 1023K and 1123K exhibit correct
metallographic structure whilst the ones that are heated at 1323K or 1423K are overheated
(Fig. 28a). In case of vanes that have already been in operation, the vanes of correct
metallographic structure are those of the I and II state, whilst overheated vanes are from the
IV and V state (Fig. 28b). Owing to such classification it was possible to embark on the
network modelling. The modelling phases were the following:
1. Standardization of data and encoding of outputs (classes);
2. Subdivision of data into the learning pattern and test pattern (at the shares of 50% to
50%);
3. Determination of parameters for the neuronal network, such as minimum and
maximum number of hidden layers (for MLP and RBF networks), types of activation
functions, both for hidden and output neurons (for the MLP network), minimum and
maximum values for reduction of weight coefficients, for both hidden and output
neurons (for the MLP network).
Fig. 30. Comparison between validity of classification
The network was subjected to the learning process with use of the set of input data. As a
result of the simulation process, both in the learning and the test modes, the optimum
models of neuronal networks were developed for each case (two-state and three-state
classifications). It was confirmed that neuronal networks offer a useful tool to assess
status of vanes, both new ones (after heating) and those that have already been in
operation (Fig. 30).
The developed neural classification models (networks with a defined architecture) make it
possible to determine technical condition of vanes on the basis of features (parameters)
attributable to their images with satisfying dependability. The additional advantage of such
an approach is the possibility to carry out the diagnosis process under conditions of
continuous operation of the turbine (with no need to have it dismantled), where images of
specific parts of turbines are acquired with use of a videoscope and then transmitted to the
control computer, where the dedicated software extracts the required features (parameters)
of the images. Finally, the ‘modelled network’ (well learned) indicates whether the vane is
suitable for further operation. The three-state classification enhances the diagnostic process
by the possibility of approving a vane for further, but supervised operation i.e. until the date
of scheduled assessment.
New Non-Destructive Methods of Diagnosing Health of Gas Turbine Blades
487
5. The thermographic method for technical condition assessment of gas
turbine vanes and blades
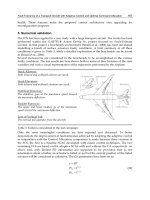
5.1 The passive infrared thermography
Thermographic methods represent relatively new but rapidly developing approach to non-
destructive diagnostic examination of materials. Thermography not only enables
measurements of temperature, but also determination of temperature distribution on the
basis of the detection of infrared radiation emitted by examined surfaces. In the literature,
the thermography is frequently referred to as ‘thermovision’ (Oliferuk, 2008).
For the entire spectral range, power of electromagnetic (EM) radiation emitted by surfaces
of materials depends on temperature of a given surface, and peaks of the radiation of
power fall within the infrared (IR) range. The infrared radiation fits within the range of
electromagnetic waves from 0.75 to 100 m, i.e. remains outside the very narrow interval
of light visible to the human eye (0.4 to 0.7 m). With a suitable infrared detector
available, and with both the relationship between radiation power and temperature of the
emitting surface and dependencies of the signal at the detector output on this power
known, it is possible to determine temperature of the surface in a non-contact way. The
infrared thermography method based on detection of infrared radiation (like all non-
destructive testing methods) can be split into passive and active techniques. A research
method based on detection of infrared radiation without the need to additionally
stimulate the examined object (supplying with energy) is referred to as the passive
infrared thermography.
Emissivity of materials is expressed by the following formula (Oliferuk, 2008):
,
e
dW
ET
d
(5)
where: dW
e
is the energy of electromagnetic radiation emitted in a time unit by a unit of
surface of the material within the range of wavelengths λ to λ+dλ.
Among a number of fields, the thermographic method is also widely applied to technical
diagnostics, owing to advanced thermographic systems offering the possibility of
determining the temperature distribution on the examined surface with temperature
resolution better than 0.1K. The range of applications of the method includes inspection of
electric circuits and systems, integrated circuits, mating parts of machinery and
structures, civil engineering, power engineering, diagnostics of high-temperature
structures.
The diagnosing of gas turbines with the passive thermographic techniques consists in the
recording of images of temperature distribution of turbine components at the exhaust
nozzle’s outlet. The starting point for any efforts intended to assess condition of the turbine
components is development of pattern thermograms for correct operation of the turbine.
Then, in the course of routine inspection carried out during regular operation of the turbine
components the generated thermograms are compared with available patterns. If only a
slight anomaly appears, it is considered a signal to initiate searching for any reason for the
discrepancies. Owing to such an approach, it is possible to detect defects such as erosion of
the turbine, failures to vanes/blades, incorrect operation of the combustion chamber, etc.,
i.e. ones hard to detect with other non-destructive inspection methods (Korczewski, 2008;
Lewitowicz, 2008)
Advances in Gas Turbine Technology
488
Fig. 31. Infrared radiation emitted by the turbine during the engine start-up: a) – start-up, b)
– pre-heat, c) – operation (Haralick R. M. et al, 1973)
5.2 Active infrared thermography
The essence of the active infrared thermography consists in determination of thermal
response of the examined material to stimulation by means of an external pulse of heat.
Nowadays, research into the application of the active infrared thermography to detection of
defects in surface layers of materials experience flourishing development. When a specific
quantum of heat is delivered to the material surface, e.g. in the form of a heat pulse, the
temperature of the material surface will be changing rapidly after the pulse termination.
Owing to thermal diffusion, a thermal front moves deeper into the material. The presence of
areas that differ in thermal properties (i.e with defects) from defect-free areas provokes
some change in the rate of diffusion.
Fig. 32. Change in temperature of the specimen’s surface after stimulation with an external
heat pulse (Thermal Wave Imaging, Inc., 2009)
Thus, the monitoring of the temperature field on the surface of a specimen subjected to
cooling provides capability to show locations of defects. The simpliest method of processing
the signal recorded with an infrared thermograph while cooling the examined surface down
consists in calculating the temperature contrast. The contrast is defined by the following
relationship (Oliferuk, 2008):
C
a
(t) =T
p
(t) – T
pj
(t), (6)
New Non-Destructive Methods of Diagnosing Health of Gas Turbine Blades
489
where: C
a
(t) – absolute contrast, T
p
(t) – temperature at any point of surface of the examined
material, T
pj
(t) – temperature at the point of surface above the homogeneous (i.e. defect-free)
material.
Values of the absolute contrast are higher than zero at the points of surface right above the
area of the material where a discontinuity exists. Depending on the stimulation method,
several types of the active thermography are distinguished, namely: the pulsed
thermography, the lock-in thermography with modulated heating and the pulsed phase
thermography (Maldague, 2001; Thermal Wave Imaging, Inc., 2009).
The pulsed thermography is deemed as a rather simple variation of the active thermography
and consists in the determination and analysis of temperature distribution on the examined
surface when the surface is being cooled down after having been uniformly heated with
a thermal pulse (Fig. 33). For the one-dimensional model and homogenous material, the
equation that describes the change in temperature while the surface is being cooled down after
heating with a short thermal pulse takes the following form (Oliferuk, 2008; Luikov, 1969):
11
22
0Tt T Q t
(7)
where: Q stands for energy of the thermal pulse per each surface unit, t - time when the
surface is being cooled down, α- thermal diffusivity, T(0) – temperature at a selected point
or on the area of the heated surface, just after termination of the thermal pulse and T(t) -
temperature at any moment of the cooling process.
Fig. 33. Diagram to explain the application of pulse thermography (Thermal Wave Imaging,
Inc., 2009)
When any flaws occur in the examined material, diffusion rates are reduced, which makes
the temperature of the area of the surface above the flaw be different from the temperature
of the area of the surface below with no defect – the nature of the foregoing interrelationship
changes. Various physical properties of materials facilitate specialized diagnostic
examination, e.g. determination of materials health, constitution of their structures, or
identification of the material under examination, etc. The pulsed thermography enables one
to distinguish temperature values in the course of cooling the specimen’s surface down after
Advances in Gas Turbine Technology
490
preliminary treatment with a thermal pulse. The acquired information contained in thermal
response from the examined surfaces enables detection of other types or grades of materials
present in the specimen (Fig. 34)
Obviously, this method (as other ones) has its limitations, since it enables one to detect flaws
only in subsurface layers of materials due to the fact that the temperature contrast rapidly
fades out with the depth of penetration. The research work has demonstrated that flaws
located in deeper layers reveal themselves, however, later and with a poorer contrast. Time
t
d,
from the termination of the stimulating pulse to the flaw revealing itself is proportional to
the square of the flaw depth z (Oliferuk, 2008):
2
d
z
t
(8)
whilst contrast C substantially fades as the depth of flaw increases (Oliferuk, 2008):
3
1
C
z
(9)
The experiments have also demonstrated that the radius of the smallest detected flaw must
be at least twice as high as the depth where the flaw is located.
Fig. 34. Thermal response to a thermal pulse for selected grades of materials (Thermal Wave
Imaging, Inc., 2009)
The drawback of the pulse thermography is that the examined surface has to meet
requirements of the emission homogeneity, which is associated with the need to coat it
before examination with a homogenous film, i.e. graphite.
On the other hand, methods based on another parameter, i.e. on the phase of the thermal
wave, are free of the mentioned drawback. This is why these methods are widely applied in
the active lock-in thermography with modulated heating and in the pulsed phase
thermography (Oliferuk, 2008). The lock-in thermography with modulated heating, contrary
to the pulsed one, not only allows of finding out surface distribution of power of infrared
radiation emitted by the surface of the material under examination and distribution of the
associated temperature, but also enables us to determine distribution of amplitudes and
New Non-Destructive Methods of Diagnosing Health of Gas Turbine Blades
491
phases of thermal waves on the area in question. Amplitude of a thermal wave found on the
basis of detected IR radiation emitted by the examined surface depends on the emissivity of
the surface, whereas the phase is independent of this emissivity. These are properties
deemed the most important advantage of the lock-in thermography with modulated
heating. When the examined surface is not uniformly heated or the subsurface layer has
been altered due to operating conditions, emissivity is locally affected. When the phase
shifts have been mapped against the stimulating signal, one can infere the presence of flaws
under the material surface (Oliferuk, 2008).
The pulsed phase thermography combines advantages of the pulsed thermograpy and the
lock-in thermography with modulated heating. The response signal recorded with
a thermovision camera represents the relationship between the surface temperature and
time T(t) for particular locations of the surface being cooled down after treating it with
a thermal pulse. The signal is then subjected to discrete Fourier transformation (Oliferuk,
2008), which allows of finding particular waves for each point of the thermal image of the
examined surface, and of development of phase maps. The phase maps, as in the method of
the lock-in thermography with modulated heating, reveal locations of flaws in examined
materials. The basic difference between the pulsed phase thermography and the lock-in
thermography with modulated heating is that the pulsed phase thermography is focused on
the analysis of a non-stationary process, i.e. the cooling of the surface of the object under
examination, earlier treated with a thermal pulse. On the contrary, the lock-in thermography
with modulated heating is applicable to stationary processes, i.e. stationary oscillations of
the temperature field on the examined surface as a result of harmonic stimulation by heat
(Oliferuk, 2008; Maldague, Matinetti, 1996; Maldague et al, 2002; Saenz et al, 2004).
5.3 Application of the thermographic method to assess condition of gas turbine
vanes/blades
The pulsed thermography method was applied to a number of studies, including the project
intended to determine the applicability of the method to assess flow capacity of internal
cooling channels of turbine vanes/blades. Improvement in general efficiency of the turbine
and increase in the power/weight ratio are directly associated with the exhaust-gas
temperature. Increase in the exhaust gases temperature due to material problems has
enforced application of turbine vanes/blades of more sophisticated geometrical shapes. It
has, in turn, complicated vane/blade manufacturing processes and many other treatments,
e.g. cooling the blades and vanes. Operational experience and examination of vanes and
blades in repair workshops have demonstrated that, besides material defects, also
disturbances in the internal cooling system caused by obstructions in cooling channels quite
frequently cause defects of vanes and blades. Fig. 35 presents images of a damaged vane,
taken with a conventional optical method, the raw pulsed thermography and the TSR
(Thermographic Signal Reconstruction) technique employed in tomography devices.
Application of the pulsed thermography method together with the dedicated software
enables easy inspection of the internal system of cooling channels and flow capacity thereof.
The advantages of the proposed method, as compared to the X-ray technique, are as follows:
it keeps the operator safe from the hazardous X-ray radiation and, in consequence, does not
require any dedicated, purposefully safeguarded rooms to carry out the examination; the
unit cost of a test is reduced as there is no need to purchase expensive consumables; results
are obtained in a very short time. The method based on the measurement of the amount of
fluid flowing via the cooling channels within the blade offers much less accuracy and is
more time- and labour-consuming than the thermographic technique.
Advances in Gas Turbine Technology
492
Results of examining turbine vanes and blades with the pulsed thermography methods
while investigating into discontinuities in the subsurface layer of the material became the
inspiration to embark upon further research on the feasibility of this thermographic
technique to assess alterations in microstructures of gas turbine blades and vanes using
available devices and instruments. The examination involved specimens from new blades
made of the EI 867-WD alloy and subjected to thermal ageing in a furnace at various
temperatures. What resulted were distinct changes in the relationships between parameters
of the thermal response from specimen materials and stimulation by a thermal pulse
(Fig. 36).
Fig. 35. Images of high-pressure turbine blades (aircraft engine), acquired with various
methods: optical, raw, TSR (Thermal Wave Imaging, Inc., 2009)
Fig. 36. Images of specimens cut out from blades (EI 867-WD alloy) subjected to soaking at
1123 K, 1223 K, 1323 K; graph of their responses to a thermal pulse
After completion of metallographic examination, the assessment of changes in micro-
structures of the specimens was carried out, mainly of change in the strengthening γ’ phase -
New Non-Destructive Methods of Diagnosing Health of Gas Turbine Blades
493
Ni
3
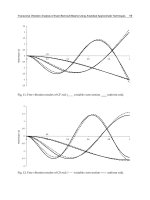
(Al,Ti). Findings of this examination are presented in Fig. 37 as a nomogram. The
relationship between the thermal response of the specimen’s material, represented as the
value of ln(T-To) against the average size of the γ’ precipitates allows of the assessment
condition/health of the specimen material. This relationship, in conjunction with the
knowledge on permissible changes in the microstructure, serves as a basis to judge whether
the specimen’s material remains fit for further service, or not.
High temperature results in both changes in thickness of the aluminium coating and
modification of the γ’ phase structure. The examined microstructure of the subsurface layer
reflects changes in the EI 867-WD alloy and proves the alloy structure suffered overheating
as soon as the specimens were subjected to soaking at 1223 K (Figs 9 and 10). When the
material criterion is adopted, i.e. a change in the size of γ’ precipitates, a threshold value of
their remaining serviceable (fit for use) is considered the criterion that determines suitability
of the blades for further operation. Results from metallographic examination confirm that
the vane/blade material loses its high-temperature creep resistance at temperatures above
1223 K due to the clustering of fine-grain (Fig. 9) cubical particles of the γ’ phase and
formation of plates (Fig. 10).
Fig. 37. Nomogram for the assessment of microstructures of specimens from gas turbine
blades made of EI 867-WD alloy on the basis of relationship between change in ln(T-To)
parameter and that in size of γ’ precipitates at different soaking temperatures