báo cáo khoa học: " Identification of Single Nucleotide Polymorphisms and analysis of Linkage Disequilibrium in sunflower elite inbred lines using the candidate gene approach" docx
Bạn đang xem bản rút gọn của tài liệu. Xem và tải ngay bản đầy đủ của tài liệu tại đây (611.1 KB, 14 trang )
BioMed Central
Page 1 of 14
(page number not for citation purposes)
BMC Plant Biology
Open Access
Research article
Identification of Single Nucleotide Polymorphisms and analysis of
Linkage Disequilibrium in sunflower elite inbred lines using the
candidate gene approach
Corina M Fusari
1
, Verónica V Lia
1,2
, H Esteban Hopp
1,2
, Ruth A Heinz
1,2
and
Norma B Paniego*
1
Address:
1
Instituto Nacional de Tecnología Agropecuaria (INTA), Instituto de Biotecnología (CNIA), CC 25, Castelar (B1712WAA), Buenos Aires,
Argentina and
2
Facultad de Ciencias Exactas y Naturales, Universidad de Buenos Aires, Buenos Aires, Argentina
Email: Corina M Fusari - ; Verónica V Lia - ; H Esteban Hopp - ;
Ruth A Heinz - ; Norma B Paniego* -
* Corresponding author
Abstract
Background: Association analysis is a powerful tool to identify gene loci that may contribute to
phenotypic variation. This includes the estimation of nucleotide diversity, the assessment of linkage
disequilibrium structure (LD) and the evaluation of selection processes. Trait mapping by allele
association requires a high-density map, which could be obtained by the addition of Single
Nucleotide Polymorphisms (SNPs) and short insertion and/or deletions (indels) to SSR and AFLP
genetic maps. Nucleotide diversity analysis of randomly selected candidate regions is a promising
approach for the success of association analysis and fine mapping in the sunflower genome.
Moreover, knowledge of the distance over which LD persists, in agronomically meaningful
sunflower accessions, is important to establish the density of markers and the experimental design
for association analysis.
Results: A set of 28 candidate genes related to biotic and abiotic stresses were studied in 19
sunflower inbred lines. A total of 14,348 bp of sequence alignment was analyzed per individual. In
average, 1 SNP was found per 69 nucleotides and 38 indels were identified in the complete data
set. The mean nucleotide polymorphism was moderate (θ = 0.0056), as expected for inbred
materials. The number of haplotypes per region ranged from 1 to 9 (mean = 3.54 ± 1.88). Model-
based population structure analysis allowed detection of admixed individuals within the set of
accessions examined. Two putative gene pools were identified (G1 and G2), with a large
proportion of the inbred lines being assigned to one of them (G1). Consistent with the absence of
population sub-structuring, LD for G1 decayed more rapidly (r
2
= 0.48 at 643 bp; trend line, pooled
data) than the LD trend line for the entire set of 19 individuals (r
2
= 0.64 for the same distance).
Conclusion: Knowledge about the patterns of diversity and the genetic relationships between
breeding materials could be an invaluable aid in crop improvement strategies. The relatively high
frequency of SNPs within the elite inbred lines studied here, along with the predicted extent of LD
over distances of 100 kbp (r
2
~0.1) suggest that high resolution association mapping in sunflower
could be achieved with marker densities lower than those usually reported in the literature.
Published: 23 January 2008
BMC Plant Biology 2008, 8:7 doi:10.1186/1471-2229-8-7
Received: 22 October 2007
Accepted: 23 January 2008
This article is available from: />© 2008 Fusari et al; licensee BioMed Central Ltd.
This is an Open Access article distributed under the terms of the Creative Commons Attribution License ( />),
which permits unrestricted use, distribution, and reproduction in any medium, provided the original work is properly cited.
BMC Plant Biology 2008, 8:7 />Page 2 of 14
(page number not for citation purposes)
Background
Association genetics via LD mapping is an emerging field
of genetic mapping that has the potential to reach resolu-
tion to the level of individual genes (alleles) underlying
quantitative traits. A Single Nucleotide Polymorphism
(SNP) is a unique nucleotide base difference between two
DNA sequences. In theory, SNP variations could involve
four different nucleotides at a particular site, but actually
only two of these four possibilities are mostly observed.
Thus, in practice, SNPs are biallelic markers, so the infor-
mation content on a single SNP is limited compared to
the polyallelic SSR markers [1-3]. This disadvantage is
overcome by the relatively larger abundance and stability
of SNP loci compared to SSR loci. For instance, the usual
frequency of SNPs reported for plant genomes is about 1
SNP every 100–300 bp [4]. The abundance, ubiquity and
interspersed nature of SNPs together with the potential of
automatic high-throughput analysis make them ideal can-
didates as molecular markers for construction of high-
density genetic maps, QTL fine mapping, marker-assisted
plant breeding and genetic association studies [5,6]. In
addition, SNPs located in known genes provide a fast
alternative to analyze the fate of agronomically important
alleles in breeding populations, thus providing functional
markers.
Several methodologies have been used to identify DNA
variants [7], but usually SNPs discovery is achieved by
electronic screening of comprehensive EST collections
and re-sequencing of selected candidate regions from
multiple or representative individuals of a target popula-
tion [8-16]. Massive methods like high-density oligonu-
cleotide probe arrays have recently emerged to identify
single feature polymorphisms (SFPs) as attractive alterna-
tives to SNPs [17]. In the last years, a number of large-scale
SNP discovery projects have been carried out in crop
plants to apply association analysis to crop genetic
improvement [18-22]. Association analysis includes the
estimation of nucleotide diversity, the assessment of link-
age disequilibrium structure (LD) and/or the correlation
between polymorphisms and the evaluation of selection
processes. Association studies based on LD come from
well-studied model species such as Arabidopsis thaliana,
maize, rice and barley [20,21,23-27] as well as woody
plants [28,29], ryegrass [30-33] and economically impor-
tant crops such as wheat, soybean, sorghum and potato
[34-37]. The rationale behind this approach is that nucle-
otide diversity not only reflects the history of selection,
migration, recombination and mating systems of a given
organism, but also provides information on the source of
most of the phenotypic variation [38]. Systematic searches
of associations between individual SNPs, or SNP haplo-
types and phenotypes of interest within a suitable popula-
tion would render the identification of causative variants
(quantitative trait nucleotides, QTNs), leading to "gene-
assisted-selection", where advantageous genotypes could
be selected based on their DNA sequence reducing the
costs of phenotypic testing.
Analyses of genetic diversity in sunflower (Helianthus
annuus) were based, until very recently, solely on tradi-
tional techniques such as allozymes [39] and SSRs [40-
42]. Trait mapping by allele association requires a high-
density map, which could be obtained by the addition of
SNPs to the SSR genetic maps already generated [43-45].
To date, the only data available on sunflower nucleotide
diversity comes from the study of 9 genomic loci in 32
wild populations and exotic germplasm accessions [46]
and of 81 RFLP loci in 10 inbred lines [47]. However, fur-
ther investigation of the nature, frequency and distribu-
tion of sequence variation is still needed to better
understand the range of diversity and the origin of the
genetic changes associated with domestication and agro-
nomic improvement. Indeed, the choice of germplasm is
crucial for the discovery of useful alleles, and a genotypi-
cally diverse set of germplasm must be chosen to achieve
this goal. Furthermore, the inclusion of candidate regions
putatively related to biotic or abiotic stresses might help
zeroing in on candidate tagged SNPs to evaluate allele
association in sunflower germplasm.
Here, we present a survey of nucleotide diversity at 28 loci
related to biotic and abiotic stresses from 19 sunflower
public elite inbred lines that are well recognized breeding
materials representing the species diversity [42,48-50].
The aims of this study were to: (1) determine the fre-
quency and the nature of the SNPs and indels in current
breeding populations, (2) examine the effects of popula-
tion structure on LD assessment, (3) compare the result-
ing nucleotide diversity and LD estimates to those
previously reported for wild and cultivated sunflower.
Results
SNPs frequency and nucleotide diversity
A total of 64 candidate regions related to biotic and abi-
otic stresses were selected for SNP identification and
nucleotide diversity analyses (Additional file 1). Single
PCR products of the expected sizes were detected for 40
regions (62.50%) and 28 of them (43.75%) yielded high-
quality sequence data. The features and polymorphism
indices of the 28 candidate genes used for subsequent
analyses are shown in Table 1 [GeneBank Acc. Nos.
EU112474
–EU112815, EU112835–EU113005,
EU113025
–EU113043]. The 28 genomic loci were ampli-
fied in 19 genotypes representative of cultivated sunflower
germplasm, comprising 14,348 bp of aligned sequence
per individual. Each gene alignment ranged from 100 to
1,114 bp including indels. Further inspection of Table 1
reveals the occurrence of at least 1 SNP in 24 out of 28
genes evaluated, with a total of 207 nucleotide changes
BMC Plant Biology 2008, 8:7 />Page 3 of 14
(page number not for citation purposes)
Table 1: Genes ID, analyzed length and total polymorphisms found in 19 sunflower inbred lines
Strategy of
selection
Gene Similarity (BLASTx
searches)
a
Description S
T
b
N° Indels
c
Total
length (bp)
d
Coding
region (bp)
d
Noncoding
region (bp)
d
Sunflower SSH-
EST library
survey
GO Glycolate oxidase
(Spinacia oleracea)
Electron carrier ROS machinery [69] 2 1 (36) 608 300 308
PGIP3 Poligalacturonase
inhibitor protein
precursor (Actidinia
deliciosa)
Plant defense against diverse
pathogens that use
polygalacturonase to breach the
plant cell wall [70]
3 0 (0) 676 561 115
LZP Leucine zipper protein
putative (Triticum
aestivum)
Transcriptional factors involved in
plant development,
photomorphogenesis and responses
to stress [71]
0 1 (8) 425 84 341
GLP Germin-like protein
(Oryza sativa)
Apoplastic and glycosilated protein
shown to be involved in plant
defense [72]
0 3 (3) 876 648 228
Literature
search
MADSB-TF3 MADS-box
transcription factor
(Helianthus annuus)
Transcription factors acting as
regulators of various aspects of plant
development [73]
13 11 (20) 1082 291 791
AALP Arabidopsis Aleurain-like
protease (Arabidopsis
thaliana)
Enzyme involved in macromolecular
degradation and recycling, its
expression is up-regulated during
aging-related and harvesting-induced
senescence [74]
10 2 (11) 269 189 80
LIM LIM domain protein
PLIM1b (H. annuus)
Transcription factors that play
important roles in construction of
cytoskeleton and signal transduction
[75]
6 2 (5) 319 150 169
in silico analysis
with SNP
Discovery
RL41 60S ribosomal protein
L41 (A. thaliana)
Protein component of the Ribosomal
60S subunit, important for the
translational apparatus and involved
in apoptosis and cell cycle [76, 77]
3 0 (0) 100 66 34
ANT Adenine nucleotide
translocator,
mitochondrial
precursor (Gossypium
hirsutum)
Inner-membrane mitochondria
carrier that plays roles in integrating
celullar stress and regulating
programmed cell death [78]
9 0 (0) 216 213 3
RS16 40S ribosomal protein
S16 (Euphorbia esula)
Ribosomal S16 component retained
during desiccation process in water
stress tolerant plants [79]
7 0 (0) 448 405 43
NsLTP Nonspecific lipid-
transfer protein
precursor (H. annuus)
Participates in cutin formation,
embryogenesis, defense reactions
against phytopathogens, symbiosis
and adaptation to various
environmental conditions [80]
7 2 (13) 294 96 198
SEM Probable 26S
proteasome complex
subunit sem1–2 (H.
annuus)
Complex involved in protein
turnover pathway, helps to remove
proteins that arise from synthetic
errors, spontaneous denaturation,
free-radical and enviromental stress
induced damage [81]
3 0 (0) 226 87 139
SAMC S-adenosylmethionine
decarboxylase (Daucus
carota)
Key enzyme in PolyAmines (PAs)
biosynthesis. PA synthesis is induced
by high osmotic pressure, low
temperature, low pH and oxidative
stress. PAs are proposed to have
resistance roles in plant-microbe
interactions [82]
12 1 (3) 369 189 180
GCvT Glycine cleavage
symstem T protein
(Flaveria trinervia)
The glycine cleavage system catalyzes
the oxidative decarboxylation of
glycine in bacteria and in
mitochondria of animals and plants
[83]
3 0 (0) 183 180 3
SBP Sedoheptulose-1,7-
bisphosphatase,
chloroplast (A. thaliana)
Calvin Cycle's enzyme: branch point
between regeneration of ribulose 1,5
biphosphate and export to starch
biosynthesis. The overexpression of
SBP increases photosynthetic carbon
fixation and biomass in plants [84]
11 0 (0) 243 240 3
LHCP Light-harvesting
chlorophyll a/b-binding
protein precursor (L.
sativa)
8 0 (0) 362 348 14
CPSI Photosystem I reaction
center subunit V,
chloroplast precursor
(Camellia sinensis)
Genes encoding components
involved in photosynthesis which
showed differential expression
patterns under both chilling and salt
stresses in sunflower [69]
4 0 (0) 168 144 24
PSI-III-CAB
Pothosystem I type III
chlorophyll a/b-binding
protein (A. thaliana)
1 1 (1) 710 387 323
CAB Chlorophyll a/b-binding
protein (Beta vulgaris)
7 2 (10) 537 393 144
BMC Plant Biology 2008, 8:7 />Page 4 of 14
(page number not for citation purposes)
identified among all genes and individuals analyzed.
Thus, an average of 1 SNP every 69 bp (excluding indels)
and a mean number of 7.39 SNPs per region were
detected. As expected, occurrence of synonymous substi-
tutions (85) was fourfold larger than non-synonymous
SNPs (20) and 70.53% of transitions were found. The
number of SNPs varied also between coding and non-cod-
ing regions: 105 SNPs were found in 9,506 bp of coding
regions whereas 102 SNPs were detected in 4,842 bp of
intergenic or intragenic non-coding sequences: hence, the
SNP frequency was 1 SNP/90 bp in coding regions and 1
SNP/48 bp in non-coding regions. These results suggest
that coding regions are more conserved (less SNP fre-
quency) than non-coding regions, most probably due to
purifying selection. On the other hand, the number of
indels varied across genes from 0 to 11, counting 38 indel
polymorphisms in the complete data set. The frequency
found for indels was 1/377.6 bp reaching an average of
1.36 indels per region analyzed. Indel sizes were highly
variable, ranging from a single nucleotide to 52 bp in
CAM (Table 1). In some instances, the precise number of
insertion and/or deletion events giving rise to each indel
block was difficult to establish, especially in those regions
where variable numbers of base pairs were added or
deleted in different individuals in the same block. Inter-
estingly, 3 indels were found in coding regions: 2 in the
MADSB-TF3 (3 bp) and 1 in GADPH (1 bp). All indels
were excluded from subsequent analyses except for both
haplotype and haplotype diversity analyses in GO, LZP,
GLP and GPX candidate regions (see also Table 2).
Summarizing, moderate levels of DNA polymorphism
were found (Table 2). Genetic variation at the nucleotide
level was estimated from mean nucleotide diversity (πT =
0.0061) and from the number of segregating sites (θW =
0.0056). Average silent-site diversity (πsil = 0.0140) and
synonymous-site diversity (πsyn = 0.0174) were higher
than non-synonymous changes (πnonsyn = 0.0013). In
26/28 loci examined, πnonsyn was either 0 or lower than
πsyn, suggesting that the diversity of these regions is gov-
erned by purifying selection. However, the GO and the
RL41 regions showed πnonsyn higher than πsyn. In GO
πnonsyn was 0.00047, while πsyn was 0; a single nucle-
otide substitution in the RHA293 inbred line, is responsi-
Comparison
purposes
CAM Calmodulin (Morus
nigra)
Plays a central role in calcium-
mediated signaling [46]
29 6 (93) 538 117 421
CHS Chalcone synthase
(Saussurea medusa)
Plays an essential role in the
biosynthesis of plant
phenylpropanoids [46] and abiotic
stress defense responses [85, 86]
0 0 (0) 1051 978 73
GAPDH Glyceraldehyde-3-
phosphate
dehydrogenase (Glycine
max)
Tetrameric NAD1 binding protein
that is involved in glycolysis and
gluconeogenesis [46]
2 2 (3) 782 617 165
GIA Gibbelleric acid
insennsitive-like protein
(Lactuca. sativa)
Putative gibberellin response
modulator [46]
2 1 (1) 749 504 245
GPX Putative gluthathione
peroxidase (Medicago
truncatula)
Antioxidant enzymes suggested as
important factors in protection
mechanisms against oxidative
damage [46]
0 1 (6) 744 513 231
GST Glutathione S-
transferase (Pisum
sativum)
40 0 (0) 561 351 210
PGIC Cytosolic
phosphoglucose
isomerase
(Stephanomeria
tenuifolia)
Catalyzes the reversible
isomerization of 6-phosphoglucose
and 6-phosphofructose, an essential
reaction that precedes sucrose
biosynthesis [46]
15 2 (4) 569 219 350
SCR1 Scarecrow
transcription factor
type 1(Castanea sativa)
SCARECROW-like gene regulators
are known to be involved in
asymmetric cell division in plants
[46]
3 0 (0) 739 732 7
SCR2 Scarecrow
transcription factor
type 2 (O. sativa)
7 0 (0) 504 504 0
Total 20
7
38 (217) 14,348 9,506 4,842
Average/locus 7.3
9
1.36
Frequency 1/
69
1/377.6
a
Gene coding regions and functions were determined by BLASTx searches.
b
Total single nucleotide polymorphisms (S
T
).
c
Number of indels counted according to blocks of insertions and deletions. The total bp length of indels is displayed in brackets.
d
Total length, coding and non-coding region are displayed excluding indels.
Table 1: Genes ID, analyzed length and total polymorphisms found in 19 sunflower inbred lines (Continued)
BMC Plant Biology 2008, 8:7 />Page 5 of 14
(page number not for citation purposes)
ble for this difference. In RL41 the non-synonymous
substitutions are caused by 2 singletons present in HA292
and by a parsimony informative site which separates
HA61, HA89, HA303, KLM280, PAC2, RHA266 and
RHA274 from the remaining inbred lines. This substitu-
tion is a C/A transversion in the 2nd codon position and
causes the change from a Proline to a Glutamine (i.e. a
change from a non-polar to a polar aminoacid). Whether
this site is essential for the protein to be functional still
remains to be determined. Despite the fact that SNP fre-
quency was higher in non-coding than in coding regions,
the average nucleotide polymorphism and nucleotide
diversity of non-coding regions (θW = 0.0052, πT =
0.0053) was only slightly higher, although non-signifi-
cant, than diversity estimates in coding regions (θW =
0.0047, πT = 0.0053).
The number of haplotypes per locus ranged from 1 to 9
among the 19 inbred lines and average haplotype diver-
sity was 0.497. Although LZP, GLP and GPX sequences
did not display any SNP polymorphism, the indels exhib-
ited in these candidate genes were enough to determine
distinct haplotypes, with haplotype diversity values of
0.281 (LZP), 0.433 (GLP) and 0.256 (GPX).
In terms of allele frequency distribution, even though
Tajima's D was not significantly different from 0 in 27/28
regions (Table 2), it was significantly positive in ANT (D
= 2.93, p < 0.001). Positive Tajima's D value indicates a
deficit of low frequency alleles relative to neutral expecta-
tions in a randomly mating population of constant size.
In this context, positive D values could be the conse-
quence of population bottlenecks, population subdivi-
sion or balancing selection as would be expected in
breeding populations.
To avoid the distortions introduced by gene sampling, the
estimates of diversity were recalculated for the 19 inbred
lines included in this work and for the Primitive and
Improved accessions (P&I) chosen by Liu and Burke [46]
using only the subset of genes in common for both studies
(Table 3). The θ
W
average values were 0.0056 for the 19
Table 2: Measures of nucleotide diversity and Tajima's D
Gene S
I
a
θ
w
π
T
π
sil
π
syn
π
nonosyn
π
nonsyn
/π
syn
N°
haplotypes
Haplotype
diversity
Tajima's D
GO 0 0.0009 0.0004 0.0003 0 0.0005 - 3 0.205 -1.51
PGIP3 3 0.0013 0.0018 0.0050 0.0062 0 0 4 0.725 1.10
LZP 0 0 0 0 0 0 - 2 0.281
b
-
GLP 0 0 0 0 0 0 - 3 0.433
b
-
MADSB-TF3 5 0.0034 0.0025 0.0027 0.0159 0.0018 0.1141 9 0.801 -1.02
AALP 6 0.0119 0.0117 0.0203 0.0143 0 0 4 0.661 -0.08
LIM 5 0.0056 0.0076 0.0117 0.0092 0 0 4 0.579 1.13
RL41 1 0.0087 0.0071 0 0 0.0145 - 3 0.556 -0.50
ANT 9 0.0122 0.0225 0.0841 0.0888 0 0 2 0.526 2.93
***c
RS16 5 0.0047 0.0066 0.0206 0.0294 0 0 3 0.573 1.36
NsLTP 5 0.0068 0.0077 0.0084 0.0380 0.0057 0.1504 3 0.433 0.42
SEM 1 0.0038 0.0018 0.0027 0 0 - 3 0.205 -1.42
SAMC 7 0.0093 0.0084 0.0134 0.0357 0.0007 0.0204 5 0.684 -0.34
GCvT 2 0.0047 0.0064 0.0253 0.0270 0 0 3 0.579 0.95
SBP 6 0.0142 0.0137 0.0523 0.0550 0 0 5 0.760 -0.14
LHCP 8 0.0063 0.0079 0.0268 0.0313 0.0011 0.0341 3 0.602 0.8266
CPSI 2 0.0068 0.0041 0.0101 0.0059 0.0010 0.1616 2 0.298 -1.17
PSI-III-CAB 1 0.0004 0.0006 0.0010 0 0 - 2 0.409 0.79
CAB 7 0.0038 0.0059 0.0136 0.0203 0 0 3 0.485 1.91
CAM 18 0.0155 0.0137 0.0166 0.0217 0 0 6 0.801 -0.44
CHS 0 0 0 0 0 0 - 1 0.000 -
GAPDH 1 0.0008 0.0007 0.0017 0 0 - 3 0.485 -0.24
GIA 2 0.0008 0.0005 0.0011 0.0016 0 0 2 0.199 -0.73
GPX 0 0 0 0 0 0 - 2 0.256
b
-
GST 31 0.0204 0.0277 0.0464 0.0636 0.0080 0.1254 9 0.772 1.44
PGIC 13 0.0081 0.0055 0.0074 0.0021 0.0012 0.5673 4 0.298 -1.19
SCR1 3 0.0012 0.0018 0.0076 0.0079 0 0 3 0.649 1.39
SCR2 7 0.0040 0.0037 0.0126 0.0126 0.0009 0.0721 3 0.374 -0.26
Average 5.29 0.0056 0.0061 0.0140 0.0174 0.0013 0.0655 3.54 0.497
a
Parsimony informative sites (S
I
) used to measure nucleotide diversity.
b
The number of haplotypes and haplotype diversity values was obtained by using indel polymorphisms.
c
Tajima's D significant p < 0.001.
BMC Plant Biology 2008, 8:7 />Page 6 of 14
(page number not for citation purposes)
inbred lines, 0.0078 for the P&I cultivated group and
0.0079 for the pooled accessions. In addition, the π
T
val-
ues were 0.0060, 0.0057, and 0.0069, respectively. There-
fore, the nucleotide diversity estimates (θ
W
and π
T
) for the
19 inbred lines analyzed in this work remained the same
regardless of the loci being surveyed.
Linkage disequilibrium (LD)
The presence of population structure can lead to spurious
results and must be considered in the statistical analysis
[51]. Therefore, as a preliminary step to the assessment of
LD, population structure was analyzed using the model-
based approach reported by Pritchard et al. [52], employ-
ing 136 non-linked SNP loci derived from the 9 genes
shared between the 19 inbred lines studied in this work
and the 32 wild and cultivated individuals previously
reported by Liu and Burke [46]. This test was useful to pre-
vent spurious associations that arise for reasons other
than physical proximity and to assess the real extent of
LD. The highest log likelihood scores were obtained when
the number of populations was set to five. Each individ-
ual's inferred ancestry to the five model-based popula-
tions is presented in Figure 1. The 19 elite accessions
examined here are mainly composed by the contribution
of two gene pools (yellow and light-blue, Figure 1), with
most of their inferred ancestries being higher than 80%.
These two gene pools are also the main constituents, but
in a different proportion, of the cultivated accessions ana-
lyzed by Liu and Burke [46]. As expected, the wild acces-
sions have a more diverse ancestry, with contributions
from all five model-based populations identified. On the
basis of population structure analysis, two groups can be
defined within the 19 inbred lines studied in this work.
The first group (G1) is composed by HA52, HA61, HA89,
HA370, HAR3, HAR5, KLM280, PAC2, RHA266, HA274,
RHA293 and RHA374 (yellow gene pool); the second
group (G2) includes HA292, HA303, HA369, HA821,
HAR2, RHA801 and V94 inbred lines (light-blue gene
pool). According to the method's assumptions, these two
groups are characterized by different sets of allele frequen-
cies. For this reason, pairwise estimates of LD (i.e. r
2
) were
calculated for: (i) the entire set of inbred lines (Figure 2A),
and (ii) the subset of inbred lines from G1 (Figure 2B).
The G2 subset was not included in this analysis because of
its small number of individuals. Figure 2 displays the scat-
ter plots of r
2
versus the physical distance between all pairs
of SNP alleles within a gene, pooled for the 24 polymor-
phic regions included in this work. Since all regions are <1
kbp long this analysis reveals disequilibrium patterns at
short distance. For the entire set of genotypes, the loga-
rithmic trend line declines very slowly, reaching a value of
0.64 at 643 bp (Figure 2A). Conversely, when the LD plot
includes only the genotypes belonging to G1 group, the
logarithmic trend decays more rapidly and the value is
0.48 for the same distance (Figure 2B). As expected, there
is clearly a bias towards higher levels of LD when the pop-
ulation structure in the sample is not factored into the
analysis. Interlocus analyses revealed no LD between loci
(data not shown).
Discussion
SNPs frequency and nucleotide diversity
Candidate genes were selected from SSH-EST collection,
literature and in silico analysis attending to their putative
role in biotic and/or abiotic stresses, while other ran-
domly selected regions were included as controls. They
were properly sequenced in 19 very well known inbred
lines used in breeding programs and different patterns of
Table 3: Evaluation of gene sampling effects on diversity estimates.
Genes analyzed MEAN from
9 genes
MEAN from
all regions
Parameters Group of
germplasm
CAM CHS GAPDH GIA GPX GST PGIC SCR1 SCR2
θ
W
19 inbred lines 0.0155 0 0.0008 0.0008 0 0.0204 0.0081 0.0012 0.0040 0.0056 0.0056
a
Improved and
Primitive
0.0176 0.0005 0.0006 0.0013 0.0047 0.0190 0.0157 0.0051 0.0054 0.0078 0.0072
b
All accessions
pooled
0.0175 0.0004 0.0006 0.0015 0.0043 0.0222 0.0145 0.0046 0.0053 0.0079 -
π
T
19 inbred lines 0.0137 0 0.0007 0.0005 0 0.0277 0.0055 0.0018 0.0037 0.0060 0.0061
a
Improved and
Primitive
0.0138 0.0003 0.0011 0.0008 0.0021 0.0124 0.0109 0.0060 0.0042 0.0057 0.0056
b
All accessions
pooled
0.0144 0.0002 0.0010 0.0007 0.0014 0.0262 0.0090 0.0051 0.0040 0.0069 -
The 9 regions (CAM, CHS, GAPDH, GIA, GPX, GST, PGIC, SCR1 and SCR2) in common with Liu and Burke report were re-analyzed in the inbred lines
(19 alleles/19 accessions), the improved and primitive cultivated accessions surveyed by Liu and Burke (32 alleles/16 accessions) [46] and the complete
set of accessions pooled together (51 alleles). The diversity estimates (π
T
and θ
W
) displayed the same pattern independently the loci surveyed.
a
Nucleotide polymorphism and nucleotide diversity obtained with the complete set of 28 genes studied in Table 2.
b
Nucleotide polymorphism and nucleotide diversity obtained by Liu and Burke [46]
BMC Plant Biology 2008, 8:7 />Page 7 of 14
(page number not for citation purposes)
polymorphisms were obtained. The SNP frequency
detected in our set of elite accessions was 1 SNP/69 bp:
whereas it is quite comparable to the frequency obtained
by Ching et al. for maize inbred lines (1 SNP/60.8 bp)
[24], it is higher than the frequency reported by Tenaillon
et al. (1 SNP/104 bp) also for maize [53]. Nevertheless,
the discrepancy between maize studies could be caused by
differences in gene sampling. Moreover, the abundance of
SNPs that we found in sunflower is comparable to the one
described in a Pinus taeda report, which exhibited 1 SNP/
63 bp [28]. On the other hand, other agronomically
important crops like sorghum (1 SNP/123 bp) [34], soy-
bean (1 SNP/328 and 1 SNP/536) [16,37] and rice (1
SNP/113 bp and 1 SNP/100 bp) [20,25] presented a lower
SNP frequency than the sunflower inbred lines surveyed
in this work.
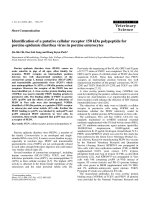
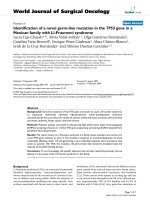
Linkage disequilibriumFigure 2
Linkage disequilibrium. A: LD plot from 24 genes pooled together for the 19 inbred lines. The logarithmic trend line
reaches a value of 0.64 at 643 bp. B: LD plot from the whole gene data calculated for the G1 subset of individuals identified in
the STRUCTURE analysis (HA52, HA61, HA89, HA370, HAR3, HAR5, KLM280, PAC2, RHA266, RHA274, RHA293 and
RHA374).
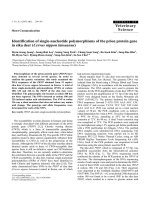
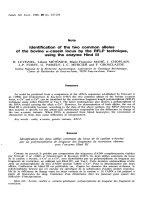
Population structure in sunflower inbred linesFigure 1
Population structure in sunflower inbred lines. Dash lines separate each individual, which is partitioned in K coloured
segments that represent the individual's estimated membership fractions in K clusters. Black lines separate individuals from dif-
ferent groups. First group is composed by the 19 sunflower inbred lines (in order from left to right: HA52, HA61, HA89,
HA292, HA303, HA369, HA370, HA821, HAR2, HAR3, HAR5, KLM280, PAC2, RHA266, RHA274, RHA293, RHA374,
RHA801 and V94); the second and the third group are the individuals studied by Liu and Burke [46]. The inbred-lines group has
mostly contributions of two clusters (yellow and light-blue).
BMC Plant Biology 2008, 8:7 />Page 8 of 14
(page number not for citation purposes)
SNP occurrence in sunflower as well as nucleotide diver-
sity values were reported recently by Liu and Burke for 16
primitive and improved accessions (1 SNP/39 bp, θ
W
=
0.0072, π
T
= 0.0056) and by Kolkman et al. for 10 inbred
lines (1 SNP/46 bp, θ
W
= 0.0094, π
T
= 0.0107) [46,47].
The differences among these values and the estimates
described in this work might be explained by: (i) the
expected differences in the genetic divergence of the mate-
rials analyzed (primitive and early improved germplasm
accessions versus elite breeding lines), (ii) the different
sources of variation being considered (e.g. indel defini-
tion) and (iii) the differences in quantity and/or selection
criteria of the genomic regions sequenced. Concerning the
last statement, 19 out of 28 candidate genes selected in
this work were uncharacterized novel regions including
putative stress related proteins as well as randomly
selected loci, which represent a good collection of the
genome-wide expected pattern of SNPs. To determine
whether the effect of interlocus variance (gene sampling)
may distort the nucleotide diversity estimates (θ
W
& π
T
),
we re-analyzed the sequence data of the 9 shared genes
between the 19 inbred lines surveyed in this report and
the P&I accessions analyzed by Liu and Burke [46]. The
mean θ
W
in the inbred lines (0.0056) still remained lower
and the mean π
T
(0.0060) remained higher than the re-
calculated estimates for the P&I individuals (θ
W
= 0.0078
and π
T
= 0.0057) (Table 3). These results confirm the pat-
tern previously observed for the entire set of genes for-
merly analyzed in the 19 inbred lines. In addition, the θ
W
and π
T
from the 9 genes for the pooled accessions were
higher than both, the 19 inbred lines and P&I individual
estimates. Consequently, these discrepancies are not
caused by gene sampling and therefore, they might reflect
genuine differences in the levels of polymorphism for dif-
ferent groups of individuals. While the θ
W
is based on the
number of segregating sites and is influenced by the pres-
ence of rare alleles, the π
T
is a measure of the pairwise dif-
ferences between two sequences. A deficiency of rare
alleles is expected under the pronounced bottlenecks that
lead to the origin of inbred lines and the increased in pair-
wise differences can result from the divergent nature of the
elite materials selected for this study. The analyses of the
pooled data confirmed those differences between the
sources employed in both works, thus, weighting not only
the presence of rare alleles in P&I accessions, but also the
divergent nature of elite inbred lines. Wild sunflowers
showed SNP occurrence (1 SNP/19 bp) and nucleotide
diversity values (θ
W
= 0.0144; π
T
= 0.0128) [46] higher
than the estimates obtained for the 19 elite inbred lines,
which is in agreement with our expectations because of
the history of artificial selection, recombination and
improvement of the last ones.
Regarding synonymous and non-synonymous changes, in
the 19 inbred lines average silent-site diversity (π
sil
=
0.0140) and synonymous-site diversity (π
syn
= 0.0174)
were higher than mean non-synonymous changes (π
nonsyn
= 0.0013), however, 2 loci showed higher π
nonsyn
than π
syn
(GO: π
nonsyn
= 0.00047 and π
syn
= 0; RL41: π
nonsyn
= 0.0145
and π
syn
= 0). Particularly in RL41, one non-synonymous
substitution is a parsimony informative site that changes
the protein sequence at that codon position. Nevertheless,
this kind of changes are frequently seen on inbred lines
that were subjected to artificial selection, for instance,
missense changes were observed in invariant sites of HD
proteins of rice cultivars as a probable consequence of
artificial selection during the domestication process [54].
Concerning the evaluation of selection, most of the genes
(27/28) showed Tajima's D values which were not signif-
icantly different from 0, while one region showed a signif-
icantly positive Tajima's D (ANT, D = 2.93; p < 0.001). As
mentioned before, positive D values could be the conse-
quence of population bottlenecks, population subdivi-
sion or balancing selection. These factors are likely to be
operational in sunflower elite lines. The population bot-
tleneck caused by inbreeding may change the rate of
allelic frequency and the conditions for a stable polymor-
phism in the entire data set. Hence, the data presented
above do no adjust to this hypothesis. In contrast, selec-
tion is the factor that might probably affect D values in
only one gene. Anyway, neither population bottlenecks
nor selection can be proved without a more comprehen-
sive and genome-wide study in sunflower.
Linkage Disequilibrium assessment
Linkage equilibrium and LD are population genetics
terms used to describe the likelihood of co-occurrence of
alleles at different loci in a population. Generally, linkage
refers to the correlated inheritance of loci through physi-
cal connection on a chromosome [1]. Population subdivi-
sion and admixture increase LD, but their effects depend
on the number of populations, the rate of exchange
between populations and the recombination rate [55].
Association analysis based on LD has been employed
recently in plants, with initial resistance due in large part
to the confounding effects of population structure and the
general lack of knowledge regarding the structure of LD in
many plant species [56]. The complex breeding history of
sunflower inbred lines and the consequent stratification
of the germplasm may lead to an overestimation of the
extent of LD, therefore extending non-random correla-
tions to physically un-linked loci and thus making associ-
ation mapping to fail. Inclusion of population structure in
association models is critical for meaningful analysis [56].
The model-based clustering method of Pritchard [52]
showed that inbred lines examined in this work were fur-
ther sub-structured into two groups: G1 and G2 (Figure
1). LD decay was slightly slower for the entire genotype set
than for the G1 group (Figure 2). Therefore, the line
BMC Plant Biology 2008, 8:7 />Page 9 of 14
(page number not for citation purposes)
through the G1 data (Figure 2B) is in concordance with
the LD analysis showed by Kolkman et al. [47]. Despite
the short-range LD that we were able to asses, the trend
line for the G1 reaches a value of 0.32 at 5500 bp, in agree-
ment with the values obtained by Kolkman et al. [47]. The
patterns of pairwise LD differed greatly between the wild
sunflowers and cultivated samples analyzed here: in the
former group, the strong linkage disequilibrium was evi-
denced within distances <200 bp [46], whereas in the sec-
ond group it was noticeable at least up to 700 bp (Figure
2). The same pattern was observed in both the P&I culti-
vated samples analyzed by Liu and Burke [46] and in the
set of inbred lines analyzed by Kolkman et al. [47]. Pat-
terns of LD in other organisms are quite variable. For
maize inbred lines [24] non-significant decay was
observed in LD (r
2
) within the 600 bp analyzed, as it was
found in sunflower inbred lines. However, assessments in
chromosome 1 of maize landraces and inbred lines
showed LD decay within 200–300 bp [53]. In addition,
SNPs-LD in other maize loci and individuals evidenced a
negligible level of LD (i.e.: r
2
< 0.1) at 1500 bp of distance
[27] reflecting the rapid decay of LD in out-crossing spe-
cies. Solanum tuberosum, despite being an out-crossing spe-
cies, showed intermediate LD values (r
2
= 0.21 at 1 kbp; r
2
= 0.14 at ~70 kbp) [35] probably as a consequence of its
vegetative propagation system. On the other hand, selfing
species showed a larger extent of LD: >50 kbp in soybean
[37], >150 kbp in Arabidopsis [26] and ~100 kbp in rice
[25]. Similarly, LD in sorghum (high self-pollination
rate), apparently dissipates within 10 kbp [34]. These last
organisms seem to have LD patterns more comparable to
the results presented in this work for cultivated sunflower.
Conclusion
This study contributes to previously reported analyses of
nucleotide diversity and linkage disequilibrium in sun-
flower [46,47]. Knowledge about genetic relationships
between breeding materials could be an invaluable aid in
crop improvement strategies. Analysis of genetic diversity
in germplasm collections can facilitate reliable classifica-
tion of accessions and identification of core accessions
subsets with possible utility for specific breeding pur-
poses. Sunflower inbred lines showed a frequency of 1
SNP per 69 bp, with nucleotide diversity estimates of θ
W
=
0.0056 and π
T
= 0.0061. As expected, these moderate lev-
els of diversity were lower than diversity estimates found
in wild accessions of sunflower [46,47]. The population
structure analysis identified the subset of inbred lines that
belong to a unique gene pool (G1), and helped us to
assess the extent of LD without spurious associations. The
extent of LD from the G1 group adjusted more accurately
with previously reports of LD in cultivated sunflower
[46,47] and the trend line predicted a decay of LD (i.e.
r
2
~0.1) within the 100 kbp. The data presented in this
work could facilitate association mapping in sunflower
with lower marker densities than those usually reported in
the literature for other plant species, at least at a rough
scale.
Methods
Plant material and genomic DNA extraction
The set of 19 elite sunflower inbred lines (Helianthus
annuus L.) selected for SNP discovery are described in
Table 4. These public inbred lines represent a wide range
of genetic diversity from the sunflower breeding materials
as it is shown by the pedigree details. They include contri-
butions from Russian, Canadian, Romanian and North
American H. annuus accessions and from interspecific
crossings with H. argophyllus and H. petiolaris made in
Argentinean breeding programs. Particularly, they were
chosen according to their morphological and agronomi-
cal characteristics regarding phenotypic behaviour against
fungal pathogens, abiotic stress, seed number per capitu-
lum and high oil yield. Among these genotypes, 15 inbred
lines were previously used in the development of 550
novel microsatellites [42]. The remaining lines (HA89,
RHA801, RHA266 and PAC2) are well known interna-
tional reference genotypes and parental lines of well char-
acterized mapping populations [57]. The DNA was
extracted from lyophilized leaves (3-week old plants
grown in greenhouse) with Nucleon™ Phytopure™
genomic DNA extraction Kit (GE, Healthcare Life Sci-
ences, Buenos Aires, Argentina) and using previously
described protocols [42].
Selection of candidate regions
Additional file 1 displays the 64 candidate regions
selected for SNP identification, the accession numbers of
the sequences used for primer design and the putative
functions associated by BLASTx searches, together with
the protein accession best hit. The 62.50% (40 regions)
were amplified in 2 genotypes in a preliminary test, while
43.75% (28) yielded high-quality sequence data for the
entire set of genotypes. The IDs of the 28 candidate genes
used for subsequent analyses are outlined in Table 1.
Briefly, four candidate genes, Glicolate Oxidase (GO, EC
1.1.3.15), Poligalacturonase Inhibitor Protein Precursor
(PGIP3), Leucine Zipper Protein (LZP) and the Germin-
Like Protein (GLP, which is a putative Oxalate Oxidase,
EC 1.2.3.4) were chosen from a SSH-EST collection [58]
since they are putatively involved in sunflower biotic and
abiotic stress resistance mechanisms. The MADS-Box
Transcription Factor (MADSB-TF3) and the two senes-
cence associated genes: LIM Domain Protein (LIM) and
Arabidopsis Aleurian-Like Proteinase (AALP, EC 3.4.22 )
were chosen from the literature [59,60] considering their
role in drought-stress resistance and senescence, respec-
tively. Finally, in silico survey of the H. annuus NCBI EST
collection was performed using the stand alone version of
SNP Discovery software [61] in order to identify putative
BMC Plant Biology 2008, 8:7 />Page 10 of 14
(page number not for citation purposes)
polymorphisms. The software was able to assemble 6,972
contigs. Only alignments with the constraints of more
than five members representing different germplasm
sources, one or more SNPs detected and an associated
function determined by BLASTx searches were considered
(35 contigs). They were also analyzed to find ESTs mem-
bers that correspond to the SSH-EST collection described
by Fernández et al. [58] (31/35). Finally, 12 out of 31 can-
didate contigs from in silico survey were amplified for
experimental validation. These sequences included:
Ribosomal proteins L41 and S16 (RL41, RS16); enzymes
such as S-Adenosylmethionine Decarboxilase (SAMC, EC
4.1.1.50), Sedoheptulose-1,7 Bisphosphatase Precursor
(SBP, EC 3.1.3.37) and one Aminomethyltransferase
(Glycine Cleavage System T Protein: GCvT, EC 2.1.2.10);
a proteasome subunit (SEM); 3 chlorophyll binding pro-
teins (Light Harvesting Chlorophyll A/B Binding Protein:
LHCP; Chlorophyll A/B Binding Protein type III from the
Photosystem I: PSI-III-CAB and Chlorophyll A/B Binding
Protein: CAB); a Chloroplast Precursor from the Photosys-
tem I (CPSI), a putative pathogenesis-related protein
(Non-specific Lipid Transfer Protein: NsLTP) and one
nucleotide transporter (Adenine Nucleotide Translocator:
ANT). These regions are known to be involved in defense
mechanisms against pathogens (NsLTP, SAMC), adapta-
tion to various environmental stresses (RS16, CPSI,
LHCP, CAB, PSI-III-CAB), regulation of Programmed Cell
Death (RL41, ANT) and protein turnover pathways (SEM,
GCvT) (Table 1).
Since patterns of polymorphism may differ greatly from
locus to locus and thus, gene sampling may have a large
impact on the levels of genetic diversity detected, Calmod-
ulin (CAM), Chalcone Synthase (CHS; EC 2.3.1.74), Glyc-
eraldehyde-3-Phosphate Dehydrogenase (GAPDH; EC
1.2.1.12), Cytosolic Phosphoglucose Isomerase (PGIC;
EC 5.3.1.9), Gibberellic Acid Insensitive-Like Protein
(GAI), Glutathione Peroxidase (GPX; EC 1.11.1.9), Glu-
tathione S-Transferase (GST; EC 2.5.1.18) and Scarecrow-
Like (SCR1 and SCR2) gene modulators previously used
for the analyses of genetic diversity in sunflower [46] were
also included for comparison purposes.
Designing and testing of PCR primers
The tentative consensus (TC) from the DFCI Helianthus
annuus Gene Index [62], with a given function associated
by Blastx searches (probability threshold <1e-20), was
used as template for primer design of the regions selected
Table 4: Description of the sunflower inbred lines used for SNPs and indels screening
Inbred line Pedigree Location of breeding reselection Features
H52 Putatively Romanian germplasm
a
South Africa Oilseed maintainer
HA61 "953-88-3"/"Armavirski 3497" U.S.A. Oilseed maintainer
HA89 "Vniimk 8931" U.S.A. Oilseed maintainer
HA292 "Commander"*3/"Mennonite RR"
b
U.S.A. Non-oilseed maintainer
HA303 "Voshod" U.S.A. Oilseed maintainer
HA369 "Teguá INTA" (Arg. 8018) Argentine Oilseed maintainer
HA370 "RK-74-198" South Africa Oilseed maintainer
HA821 "HA 300" (derived from "Peredovik 301") U.S.A. Oilseed maintainer
HAR2 "Impira INTA" Selection 5 Argentine Oilseed maintainer
HAR3 "Charata INTA"
c
selection Argentine Oilseed maintainer
HAR5 "Guayacán INTA"
d
selection Argentine Oilseed maintainer
KLM280 "KLM"
e
selection Argentine Oilseed maintainer
PAC2 H. petiolaris × HA61 France Stem-head rot resistance
RHA266 Wild H. annuus × Peredovik U.S.A Downy mildew resistance
RHA274 ("cmsPI343765"/"Ha119"/"Ha64-4-5")/T66006-2
f
U.S.A. Oilseed restorer
RHA293 "HA155"/"HIR34"/2/"RHA282" U.S.A. Non-oilseed restorer
RHA374 "Arg-R43" U.S.A. Oilseed restorer
RHA801 Multiple source R-line population U.S.A Fertility restorer line
V94
g
"Mp543"* h./H. Argophyllus Argentine Oilseed maintainer
a
"HA52" is an accession putatively originating from Romanian germplasm bred in Potchestfrom, Transvaal, South Africa.
b
Third generation backcross of "Mennonite RR" to "Commander".
c
"Charata INTA" was obtained by interspecific crossings with wild germplasm belonging to species H. annuus subsp. annuus and H. petiolaris.
d
"Guayacán INTA" derived from a cross between the Argentine variety Klein and "CM953-102" and backcrossed once again with "Klein".
e
"KLM" is a multiple cross between cultivars Klein × Local (a pool of local varieties of INTA Pergamino breeding program including "Guayacán
INTA", "Charata INTA") × "Manfredi" (a pool of varieties from INTA Manfredi breeding program including "Impira INTA", "Cordobés INTA",
"Manfredi INTA").
f
T66006-2 comes from Peredovik*2/953-102-1-1-41.
g
"V94" is another Argentine selection of a cross between cultivated sunflower ("MP543") and wild species (H. argophyllus), "MP543" derives from
"MPRR" (mezcla precoz resistente a roya: pool of early material resistant to sunflower rust), which also derives from wide crossings with Helianthus
wild species.
BMC Plant Biology 2008, 8:7 />Page 11 of 14
(page number not for citation purposes)
from literature and/or SSH-ESTs. Primer3 [63] was used
for primers design. For the 9 genes: CAM, CHS, GAPDH,
GPX, GST, PGIC, SCR1 and SCR2, the primers were syn-
thesized either according to Liu and Burke [46] specifica-
tion or re-designed with Primer3 software. The contigs
from in silico analysis were amplified with primers
designed over the longest EST within a contig, insuring the
best probability to find most of the SNPs detected by the
software.
Each PCR primer pair was used to amplify genomic DNA
of HA89 and RHA266 for testing primer functionality.
PCRs were performed in a 12 μl volume with 30 ng
genomic DNA, 2 mM MgCl
2
, 0.2 mM dNTP, 1 U Taq Plat-
inum Polymerase (Invitrogen, Buenos Aires, Argentina)
and 0.25 mM primer set. The cycling conditions were: 2
min at 94° for initial denaturing, 35 cycles of 40 sec at
94°, 40 sec at 65–58°, 2 min 72°, and a final extension
for 10 min at 72°. Amplified products were visualized
under UV light after electrophoresis on an ethidium bro-
mide-stained 1.0% agarose gel. Those primer sets that pro-
duced a single PCR product with both DNA genotypes
were selected and amplified in the remaining 17 sun-
flower inbred lines using the conditions described above.
Purification and sequence analysis of PCR products
The PCR fragments were prepared for sequence analysis
by treating 10 μl of PCR reaction with 4 μl of EXOSAP-IT
(Exonuclease I & Shrimp Alkaline Phosphatase, USB,
Ohio, USA) or by QIAquick PCR Purification Kit (QIA-
GEN, Hilden, Germany). Those PCR products that could
not be sequenced directly were cloned into pGEMT-easy
(Promega, Madison, USA) and at least two clones were
sequenced with forward and reverse primers to discard
PCR errors.
The nucleotide sequences from both strands were
obtained with an ABI 3130xl sequencer (Applied Biosys-
tems, California, USA). When the credibility between the
two reads was less than 98% a third sequencing assay was
performed.
SNP survey and analysis
ABI trace files were aligned using ABI Prism SeqScape Soft-
ware version 2.5 (Applied Biosystems, California, USA).
SeqScape quality values of base-calls were set ≥ 20, and
default settings for the remaining parameters were used
for SNPs and indel discovery. Polymorphisms which
appeared only in one genotype were re-checked in chro-
matogram files. The coding and non-coding regions of
each candidate gene were then identified by BLASTx
searches.
The levels of genetic variation were estimated as nucle-
otide polymorphism (θ
W
[64]) and nucleotide diversity (π
[65]). Watterson's θ is based on the number of segregating
sites, while Tajima's π is based on the pairwise difference
between sequences in the sample. To test the neutrality of
mutations, we employed Tajima's D test [66] which is
based on differences between π and θ. These parameters
were obtained using the software package DnaSP 4.10.9
[67].
Population structure and LD assessment
The analysis of population structure was performed with
STRUCTURE 2.1 [52]. In this method, a number of clus-
ters, groups or populations (K) are assumed to be present
and to contribute to the genotypes of sampled individu-
als. Loci are assumed to be independent, and each K pop-
ulation is assumed to follow HWE. The number of groups
evaluated ranged from 1 to 10. The analysis was per-
formed using five replicate runs per K value, a burn-in
period length of 200,000 and a run length of 10
5
. No prior
information on the origin of individuals was used to
define the groups. The allele frequencies were kept inde-
pendent among clusters in order to avoid an overestima-
tion of the number of clusters [68]. The run showing the
highest posterior probability of data was considered for
each K value.
Standardized disequilibrium coefficients (D') and
squared allele-frequency correlations (r
2
) for pairs of loci
are the preferred measures of LD. However, D' was not
considered for the present analysis since it is strongly
affected by small sample sizes, resulting in highly erratic
behaviour when comparing loci with low allele frequen-
cies [51]. Therefore, LD was measured using the r
2
statistic
obtained with DNAsp 4.10.9 [67]. The pairwise compari-
sons were pooled and plot together for the entire inbred
lines set and also for one of the groups identified with
STRUCTURE. Microcal™ Origin
®
Version: 7.5 (Microcal
Software, Inc.) was used to fit the decay of r
2
(pooled
across loci).
Abbreviations
SNP single nucleotide polymorphism, indels short inser-
tions and/or deletions, SSRs simple sequence repeats, bp
base pairs, kbp kilo base pairs, LD linkage disequilibrium,
EST expressed sequence tags, SSH suppressed subtracted
hybridization, HWE Hardy Weinberg equilibrium, IDs
identification, P&I primitive and improved cultivated
sunflowers, HD Homeo-Domain Proteins, ROS reactive
oxygen species, PAs PolyAmines.
Authors' contributions
CMF selected the candidate genes along with NBP. CMF
amplified the regions and carried out SNPs and indel
identification from the allele sequence data. CMF along
with VVL performed the data analysis. RAH provided EST
sequence information. NBP contributed to selection of
BMC Plant Biology 2008, 8:7 />Page 12 of 14
(page number not for citation purposes)
germplasm. VVL highly assisted in the interpretation of
the results. CMF, VVL and NBP wrote the manuscript.
RAH and HEH helped to draft the manuscript. NBP and
RAH conceived and coordinated the study. HEH initiated
the project and contributed to the work by the interpreta-
tion and discussion of the data. All authors read and
approved the manuscript.
Additional material
Acknowledgements
This work was supported by the Agencia Nacional de Promoción Científica
y Técnica (ANPCyT, BID 1728 OC-AR PID267; PAV137). The authors
thank Dr. Andrea Puebla and and Pablo Vera for gene sequencing and Nata-
lia Almasia and Florencia del Viso for critical reading of the manuscript. This
study is conducted within the frame of the Sunflower Genomic Project with
financial support from the Agencia Nacional de Promoción Científica y Tec-
nológica (ANPCyT) and the Instituto Nacional de Tecnología Agropecuaria
(INTA). CMF is a PhD student supported by a fellowship from INTA. Dr.
VVL, Dr. RAH and Dr. NBP are career members of the Consejo Nacional
de Investigaciones Científicas y Técnicas (CONICET, Argentina) and Dr.
HEH is a career member of the Comisión de Investigaciones Científicas de
la Provincia de Buenos Aires (CIC) and Professor at the Facultad de Cien-
cias Exactas y Naturales, University of Buenos Aires (UBA).
References
1. Oraguzie NC, Rikkerink EHA, Gardiner SE, De Silva HN: Associa-
tion Mapping in Plants. 2007 [ />plant+sciences/book/978-0-387-35844-4]. New York, USA , Springer
Science+Business Media
2. Griffin TJ, Smith LM: Single-nucleotide polymorphism analysis
by MALDI-TOF mass spectrometry. Trends Biotechnol 2000,
18(2):77-84.
3. Schlotterer C: The evolution of molecular markers just a
matter of fashion? Nat Rev Genet 2004, 5(1):63-69.
4. Gupta PK, Roy JK, Prasad M: Single nucleotide polymorphisms:
A new paradigm for molecular marker technology and DNA
polymorphism detection with emphasis on their use in
plants. Curr Sci 2001, 80(4524-535 [ />feb252001/524.pdf].
5. Kwok PY: Methods for genotyping single nucleotide polymor-
phisms. Annu Rev Genomics Hum Genet 2001, 2:235-258.
6. Rafalski A: Applications of single nucleotide polymorphisms in
crop genetics. Curr Opin Plant Biol 2002, 5(2):94-100.
7. Fredman D, White SJ, Potter S, Eichler EE, Den Dunnen JT, Brookes
AJ: Complex SNP-related sequence variation in segmental
genome duplications. Nat Genet 2004, 36(8):861-866.
8. Cho RJ, Mindrinos M, Richards DR, Sapolsky RJ, Anderson M, Drenk-
ard E, Dewdney J, Reuber TL, Stammers M, Federspiel N, Theologis
A, Yang WH, Hubbell E, Au M, Chung EY, Lashkari D, Lemieux B,
Dean C, Lipshutz RJ, Ausubel FM, Davis RW, Oefner PJ: Genome-
wide mapping with biallelic markers in Arabidopsis thaliana.
Nat Genet 1999, 23(2):203-207.
9. Cordeiro GM, Eliott F, McIntyre CL, Casu RE, Henry RJ: Character-
isation of single nucleotide polymorphisms in sugarcane
ESTs. Theor Appl Genet 2006, 113(2):331-343.
10. Kota R, Rudd S, Facius A, Kolesov G, Thiel T, Zhang H, Stein N, Mayer
K, Graner A: Snipping polymorphisms from large EST collec-
tions in barley (Hordeum vulgare L.). Mol Genet Genomics 2003,
270(1):24-33.
11. Kota R, Varshney RK, Thiel T, Dehmer KJ, Graner A: Generation
and comparison of EST-derived SSRs and SNPs in barley
(Hordeum vulgare L.). Hereditas 2001, 135(2-3):145-151.
12. Lai Z, Livingstone K, Zou Y, Church SA, Knapp SJ, Andrews J, Riese-
berg LH: Identification and mapping of SNPs from ESTs in
sunflower. Theor Appl Genet 2005, 111(8):1532-1544.
13. Morales M, Roig E, Monforte AJ, Arus P, Garcia-Mas J: Single-nucle-
otide polymorphisms detected in expressed sequence tags of
melon (Cucumis melo L.). Genome 2004, 47(2):352-360.
14. Somers DJ, Kirkpatrick R, Moniwa M, Walsh A: Mining single-
nucleotide polymorphisms from hexaploid wheat ESTs.
Genome 2003, 46(3):431-437.
15. Van K, Hwang EY, Kim MY, Kim IH, Cho YI, Cregan PB, Lee SH: Dis-
covery of single nucleotide polymorphisms in soybean using
primers designed from ESTs.
Euphytica 2004, 139:147-157.
16. Van K, Hwang EY, Kim MY, Park HJ, Lee SH, Cregan PB: Discovery
of SNPs in soybean genotypes frequently used as the parents
of mapping populations in the United States and Korea. J
Hered 2005, 96(5):529-535.
17. Zhu T, Salmeron J: High-definition genome profiling for genetic
marker discovery. Trends Plant Sci 2007, 12(5):196-202.
18. Feltus FA, Singh HP, Lohithaswa HC, Schulze SR, Silva TD, Paterson
AH: A comparative genomics strategy for targeted discovery
of single-nucleotide polymorphisms and conserved-noncod-
ing sequences in orphan crops. Plant Physiol 2006,
140(4):1183-1191.
19. Giancola S, McKhann HI, Berard A, Camilleri C, Durand S, Libeau P,
Roux F, Reboud X, Gut IG, Brunel D: Utilization of the three
high-throughput SNP genotyping methods, the GOOD
assay, Amplifluor and TaqMan, in diploid and polyploid
plants. Theor Appl Genet 2006, 112(6):1115-1124.
20. Monna L, Ohta R, Masuda H, Koike A, Minobe Y: Genome-wide
searching of single-nucleotide polymorphisms among eight
distantly and closely related rice cultivars (Oryza sativa L.)
and a wild accession (Oryza rufipogon Griff.). DNA Res 2006,
13(2):43-51.
21. Rostoks N, Mudie S, Cardle L, Russell J, Ramsay L, Booth A, Svensson
JT, Wanamaker SI, Walia H, Rodriguez EM, Hedley PE, Liu H, Morris
J, Close TJ, Marshall DF, Waugh R: Genome-wide SNP discovery
and linkage analysis in barley based on genes responsive to
abiotic stress. Mol Genet Genomics 2005, 274(5):515-527.
22. Schmid KJ, Sorensen TR, Stracke R, Torjek O, Altmann T, Mitchell-
Olds T, Weisshaar B: Large-scale identification and analysis of
genome-wide single-nucleotide polymorphisms for mapping
in Arabidopsis thaliana. Genome Res 2003, 13(6A):1250-1257.
23. Caldwell KS, Russell J, Langridge P, Powell W: Extreme popula-
tion-dependent linkage disequilibrium detected in an
inbreeding plant species, Hordeum vulgare. Genetics 2006,
172(1):557-567.
24. Ching A, Caldwell KS, Jung M, Dolan M, Smith OS, Tingey S, Morgante
M, Rafalski AJ: SNP frequency, haplotype structure and linkage
disequilibrium in elite maize inbred lines. BMC Genetics 2002,
3:
19.
25. Garris AJ, McCouch SR, Kresovich S: Population structure and its
effect on haplotype diversity and linkage disequilibrium sur-
rounding the xa5 locus of rice (Oryza sativa L.). Genetics 2003,
165(2):759-769.
26. Nordborg M, Borevitz JO, Bergelson J, Berry CC, Chory J, Hagenblad
J, Kreitman M, Maloof JN, Noyes T, Oefner PJ, Stahl EA, Weigel D:
The extent of linkage disequilibrium in Arabidopsis thaliana.
Nat Genet 2002, 30(2):190-193.
27. Remington DL, Thornsberry JM, Matsuoka Y, Wilson LM, Whitt SR,
Doebley J, Kresovich S, Goodman MM, Buckler ES: Structure of
linkage disequilibrium and phenotypic associations in the
maize genome. Proc Natl Acad Sci USA 2001, 98(20):11479-11484.
28. Brown GR, Gill GP, Kuntz RJ, Langley CH, Neale DB: Nucleotide
diversity and linkage disequilibrium in loblolly pine. Proc Natl
Acad Sci USA 2004, 101(42):15255-15260.
Additional file 1
Candidate genes selected for SNP development and nucleotide diver-
sity analysis. The data displays the 64 candidate regions selected for SNP
identification, the accession numbers of the sequences used for primer
design and the putative functions associated by BLASTx searches, together
with the protein accession best hit.
Click here for file
[ />2229-8-7-S1.xls]
BMC Plant Biology 2008, 8:7 />Page 13 of 14
(page number not for citation purposes)
29. Ingvarsson PK: Nucleotide polymorphism and linkage disequi-
librium within and among natural populations of European
aspen (Populus tremula L., Salicaceae). Genetics 2005,
169(2):945-953.
30. Auzanneau J, Huyghe C, Julier B, Barre P: Linkage disequilibrium
in synthetic varieties of perennial ryegrass. Theor Appl Genet
2007, 115(6):837-847.
31. Ponting RC, Drayton MC, Cogan NO, Dobrowolski MP, Spangenberg
GC, Smith KF, Forster JW: SNP discovery, validation, haplotype
structure and linkage disequilibrium in full-length herbage
nutritive quality genes of perennial ryegrass (Lolium per-
enne L.). Mol Genet Genomics 2007, 278(5):585-597.
32. Skot L, Humphreys J, Humphreys MO, Thorogood D, Gallagher J,
Sanderson R, Armstead IP, Thomas ID: Association of candidate
genes with flowering time and water soluble carbohydrate
content in Lolium perenne (L.). Genetics 2007, 177(1):535-547.
33. Xing Y, Frei U, Schejbel B, Asp T, Lubberstedt T: Nucleotide diver-
sity and linkage disequilibrium in 11 expressed resistance
candidate genes in Lolium perenne. BMC Plant Biol 2007,
7(1):43.
34. Hamblin MT, Mitchell SE, White GM, Gallego J, Kukatla R, Wing RA,
Paterson AH, Kresovich S: Comparative population genetics of
the panicoid grasses: sequence polymorphism, linkage dise-
quilibrium and selection in a diverse sample of sorghum
bicolor. Genetics 2004, 167(1):471-483.
35. Simko I, Haynes KG, Jones RW: Assessment of linkage disequi-
librium in potato genome with single nucleotide polymor-
phism markers. Genetics 2006, 173(4):2237-2245.
36. Somers DJ, Banks T, Depauw R, Fox S, Clarke J, Pozniak C, McCart-
ney C: Genome-wide linkage disequilibrium analysis in bread
wheat and durum wheat. Genome 2007, 50(6):557-567.
37. Zhu YL, Song QJ, Hyten DL, Van Tassell CP, Matukumalli LK, Grimm
DR, Hyatt SM, Fickus EW, Young ND, Cregan PB: Single-nucle-
otide polymorphisms in soybean. Genetics 2003,
163(3):1123-1134.
38. Buckler EST, Thornsberry JM: Plant molecular diversity and
applications to genomics. Curr Opin Plant Biol 2002, 5(2):107-111.
39. Rieseberg LH, Seiler GJ: Molecular evidence and the origin and
development of the domesticated sunflower (Helianthus
annuus, Asteraceae). Economical Botany 1990, 44(Suppl.
3):79-91.
40. Al-Chaarani GR, Gentzbittel L, Huang XQ, Sarrafi A: Genotypic
variation and identification of QTLs for agronomic traits,
using AFLP and SSR markers in RILs of sunflower (Helian-
thus annuus L.). Theor Appl Genet 2004, 109(7):1353-1360.
41. Tang S, Knapp SJ: Microsatellites uncover extraordinary diver-
sity in native American land races and wild populations of
cultivated sunflower. Theor Appl Genet 2003, 106(6):990-1003.
42. Paniego N, Echaide M, Munoz M, Fernandez L, Torales S, Faccio P,
Fuxan I, Carrera M, Zandomeni R, Suarez EY, Hopp HE: Microsatel-
lite isolation and characterization in sunflower (Helianthus
annuus L.). Genome 2002, 45(1):34-43.
43. Al-Chaarani GR, Roustaee A, Gentzbittel L, Mokrani L, Barrault G,
champ-Guillaume G, Sarrafi A: A QTL analysis of sunflower par-
tial resistance to downy mildew ( Plasmopara halstedii) and
black stem ( Phoma macdonaldii) by the use of recombinant
inbred lines (RILs). Theor Appl Genet 2002, 104(2-3):490-496.
44. Poormohammad Kiani S, Talia P, Grieu P, Maury P, Hewezi T, Gentz-
bittel L, Sarrafi A: Genetic analysis of plant water status and
osmotic adjustment in recombinant inbred lines of sun-
flower under two water treatments. Plant Sci 2007,
178(4):773-787.
45. Tang S, Yu JK, Slabaugh B, Shintani K, Knapp J: Simple sequence
repeat map of the sunflower genome. Theor Appl Genet 2002,
105(8):1124-1136.
46. Liu A, Burke JM: Patterns of nucleotide diversity in wild and
cultivated sunflower. Genetics 2006, 173(1):321-330.
47. Kolkman JM, Berry ST, Leon A, Slabaugh MB, Tang S, Gao W, Shintani
DK, Burke JM, Knapp SJ: Single nucleotide polymorphisms and
linkage disequilibrium in sunflower. Genetics 2007,
177(1):457-468.
48. Cheres MT, Knapp SJ:
Ancestral Origins and Genetic Diversity
of Cultivated Sunflower: Coancestry Analysis of Public
Germplasm. Crop Sci 1998, 38:1476-1482.
49. Roath WW, Miller JF, Gulya TJ: Registration of RHA 801 sun-
flower germplasm. Crop Sci 1981, 21:479.
50. Zhang LS, Le Clerc V, Li S, Zhang D: Establishment of an effective
set of simple sequence repeat markers for sunflower variety
identification and diversity assessment. Can J Bot 2005,
83:66-72.
51. Flint-Garcia SA, Thornsberry JM, Buckler ES: Structure of linkage
disequilibrium in plants. Annu Rev Plant Biol 2003, 54:357-374.
52. Pritchard JK, Stephens M, Donnelly P: Inference of population
structure using multilocus genotype data. Genetics 2000,
155(2945-959 [ />].
53. Tenaillon MI, Sawkins MC, Long AD, Gaut RL, Doebley JF, Gaut BS:
Patterns of DNA sequence polymorphism along chromo-
some 1 of maize (Zea mays ssp. mays L.). Proc Natl Acad Sci USA
2001, 98(16):9161-9166.
54. Sato Y, Fukuda Y, Hirano HY: Mutations that cause amino acid
substitutions at the invariant positions in homeodomain of
OSH3 KNOX protein suggest artificial selection during rice
domestication. Genes Genet Syst 2001, 76(6):381-392.
55. Gaut BS, Long AD: The lowdown on linkage disequilibrium.
Plant Cell 2003, 15(7):1502-1506.
56. Flint-Garcia SA, Thuillet AC, Yu J, Pressoir G, Romero SM, Mitchell
SE, Doebley J, Kresovich S, Goodman MM, Buckler ES: Maize asso-
ciation population: a high-resolution platform for quantita-
tive trait locus dissection. Plant J 2005, 44(6):1054-1064.
57. Gentzbittel LV F. Zhang, Y X., Bervillé A, Nicolas P: Development
of a consensus linkage RFLP map of cultivated sunflower
(Helianthus annuus L.). Theor Appl Genet 1995, 90:1079-1086.
58. Fernandez P, Paniego N, Lew S, Hopp HE, Heinz RA: Differential
representation of sunflower ESTs in enriched organ-specific
cDNA libraries in a small scale sequencing project. BMC
Genomics 2003, 4(1):40.
59. Dezar CA, Gago GM, Gonzalez DH, Chan RL: Hahb-4, a sunflower
homeobox-leucine zipper gene, is a developmental regula-
tor and confers drought tolerance to Arabidopsis thaliana
plants. Transgenic Res 2005, 14(4):429-440.
60. Gepstein S, Sabehi G, Carp MJ, Hajouj T, Nesher MF, Yariv I, Dor C,
Bassani M: Large-scale identification of leaf senescence-associ-
ated genes. Plant J 2003, 36(5):629-642.
61. Barker G, Batley J, O' SH, Edwards KJ, Edwards D: Redundancy
based detection of sequence polymorphisms in expressed
sequence tag data using autoSNP. Bioinformatics 2003,
19(3421-422 [ />index_autosnip.pl].
62. Dana Farber Cancer Institute TGIP: The Helianthus annuus Gene
Index (HaGI). [ />port.pl?gudb=Sunflower].
63. Rozen S, Skaletsky H: Primer3 on the WWW for general users
and for biologist programmers. Bioinformatics Methods and Proto-
cols: Methods in Molecular Biology 2000:365-386 [http://
frodo.wi.mit.edu/]. Totowa, NJ , Humana Press
64. Watterson GA: On the number of segregating sites in geneti-
cal models without recombination. Theor Popul Biol 1975,
7(2):256-276.
65. Tajima F: Evolutionary relationship of DNA sequences in finite
populations. Genetics 1983, 105(2):437-460.
66. Tajima F: Statistical method for testing the neutral mutation
hypothesis by DNA polymorphism. Genetics 1989,
123(3):585-595.
67. Rozas J, Rozas R: DnaSP version 3: an integrated program for
molecular population genetics and molecular evolution anal-
ysis. Bioinformatics 1999, 15(2):174-175.
68. Falush D, Stephens M, Pritchard JK: Inference of population struc-
ture using multilocus genotype data: linked loci and corre-
lated allele frequencies. Genetics 2003, 164(4):1567-1587.
69. Fernandez P, Di Rienzo J, Fernandez L, Hopp HE, Paniego N, Heinz
RA: Transcriptomic identification of candidate genes
involved in sunflower responses to chilling and salt stresses
based on cDNA microarray analysis. BMC Plant Biol 8(1):11.
70. Bishop JG: Directed mutagenesis confirms the functional
importance of positively selected sites in polygalacturonase
inhibitor protein. Mol Biol Evol 2005, 22(7):1531-1534.
71. Mallappa C, Yadav V, Negi P, Chattopadhyay S: A basic leucine zip-
per transcription factor, G-box-binding factor 1, regulates
blue light-mediated photomorphogenic growth in Arabidop-
sis. J Biol Chem 2006, 281(31):22190-22199.
72. Zimmermann G, Baumlein H, Mock HP, Himmelbach A, Schweizer P:
The multigene family encoding germin-like proteins of bar-
Publish with BioMed Central and every
scientist can read your work free of charge
"BioMed Central will be the most significant development for
disseminating the results of biomedical research in our lifetime."
Sir Paul Nurse, Cancer Research UK
Your research papers will be:
available free of charge to the entire biomedical community
peer reviewed and published immediately upon acceptance
cited in PubMed and archived on PubMed Central
yours — you keep the copyright
Submit your manuscript here:
/>BioMedcentral
BMC Plant Biology 2008, 8:7 />Page 14 of 14
(page number not for citation purposes)
ley. Regulation and function in Basal host resistance. Plant
Physiol 2006, 142(1):181-192.
73. Dezar CA, Tioni MF, Gonzalez DH, Chan RL: Identification of
three MADS-box genes expressed in sunflower capitulum. J
Exp Bot 2003, 54(387):1637-1639.
74. Eason JR, Ryan DJ, Watson LM, Hedderley D, Christey MC, Braun
RH, Coupe SA: Suppression of the cysteine protease, aleurain,
delays floret senescence in Brassica oleracea. Plant Mol Biol
2005, 57(5):645-657.
75. Arnaud D, Dejardin A, Leple JC, Lesage-Descauses MC, Pilate G:
Genome-wide analysis of LIM gene family in Populus tri-
chocarpa, Arabidopsis thaliana, and Oryza sativa. DNA Res
2007, 14(3):103-116.
76. Kim MJ, Yoo YA, Kim HJ, Kang S, Kim YG, Kim JS, Yoo YD: Mito-
chondrial ribosomal protein L41 mediates serum starvation-
induced cell-cycle arrest through an increase of p21(WAF1/
CIP1). Biochem Biophys Res Commun 2005, 338(2):1179-1184.
77. Woo HH, Hawes MC: Cloning of genes whose expression is
correlated with mitosis and localized in dividing cells in root
caps of Pisum sativum L. Plant Mol Biol 1997, 35(6):1045-1051.
78. Lam E, Kato N, Lawton M: Programmed cell death, mitochon-
dria and the plant hypersensitive response. Nature 2001,
411(6839):848-853.
79. Wood AJ, Joel Duff R, Oliver MJ: The translational apparatus of
Tortula ruralis: polysomal retention of transcripts encoding
the ribosomal proteins RPS14, RPS16 and RPL23 in desic-
cated and rehydrated gametophytes. J Exp Bot 2000,
51(351):1655-1662.
80. Kader JC: Lipid-Transfer Proteins in Plants. Annu Rev Plant Phys-
iol Plant Mol Biol 1996, 47:627-654.
81. Smalle J, Vierstra RD: The ubiquitin 26S proteasome proteo-
lytic pathway. Annu Rev Plant Biol 2004, 55:555-590.
82. Wi SJ, Kim WT, Park KY: Overexpression of carnation S-adeno-
sylmethionine decarboxylase gene generates a broad-spec-
trum tolerance to abiotic stresses in transgenic tobacco
plants. Plant Cell Rep
2006, 25(10):1111-1121.
83. Lee HH, Kim DJ, Ahn HJ, Ha JY, Suh SW: Crystal structure of T-
protein of the glycine cleavage system. Cofactor binding,
insights into H-protein recognition, and molecular basis for
understanding nonketotic hyperglycinemia. J Biol Chem 2004,
279(48):50514-50523.
84. Lefebvre S, Lawson T, Zakhleniuk OV, Lloyd JC, Raines CA, Fryer M:
Increased sedoheptulose-1,7-bisphosphatase activity in
transgenic tobacco plants stimulates photosynthesis and
growth from an early stage in development. Plant Physiol 2005,
138(1):451-460.
85. Coberly LC, Rausher MD: Analysis of a chalcone synthase
mutant in Ipomoea purpurea reveals a novel function for fla-
vonoids: amelioration of heat stress. Mol Ecol 2003,
12(5):1113-1124.
86. Savenstrand H, Brosche M, Strid A: Ultraviolet-B signalling: Ara-
bidopsis brassinosteroid mutants are defective in UV-B reg-
ulated defence gene expression. Plant Physiol Biochem 2004,
42(9):687-694.