Access: Acid-Base, Fluids, and Electrolytes - part 4 docx
Bạn đang xem bản rút gọn của tài liệu. Xem và tải ngay bản đầy đủ của tài liệu tại đây (364.4 KB, 50 trang )
DISORDERS OF K
+
BALANCE 135
TABLE 5–2: Basics of K
+
Homeostasis
K
+
is the predominant intracellular cation in the body
Regulation of K
+
homeostasis is achieved through cellular
K
+
shifts and renal K
+
excretion
• Disturbances in these homeostatic mechanisms result in
either hypokalemia or hyperkalemia
Hypo- and hyperkalemia disrupt action potential formation
and promote various clinical symptoms and physical
findings based on the following:
• Neuromuscular dysfunction
• Inhibition of normal cell enzymatics
Rapid recognition and treatment of these K
+
disorders is
required to avoid serious morbidity and mortality
136 DISORDERS OF K
+
BALANCE
K
+
HOMEOSTASIS
TABLE 5–3: Total Body K
+
Stores
K
+
homeostasis involves maintenance of total body K
+
stores within the normal range
Total body K
+
stores in an adult are between 3000 and
4000 mEq
• 50–60 mEq/kg body weight
Total body K
+
content is also influenced by age and sex
• Compared with the young, the elderly have 20% less total
body K
+
content
• Females have 25% less total body K
+
than males
K
+
is readily absorbed from the GI tract and subsequently
distributed in cells of muscle, liver, bone, and red blood cells
Maintenance of total body K
+
stores within narrow limits is
achieved by:
• Regulation of K
+
distribution between ECF and ICF
• Zero net balance between input and output
K
+
is an intracellular cation (98% of body K
+
located in ICF)
• Intracellular K
+
concentration (145 mEq/L)
• Extracellular K
+
concentration (4–5 mEq/L)
Dietary K
+
is excreted mainly in urine (90%) and in
feces (10%)
DISORDERS OF K
+
BALANCE 137
ROLE OF K
+
IN THE RESTING
MEMBRANE POTENTIAL
TABLE 5–3 (Continued)
The serum K
+
concentration is an index of K
+
balance
• It reasonably reflects total body K
+
content
• In disease states, serum [K
+
] may not always reflect total
body K
+
stores
Abbreviations: GI, gastrointestinal; ECF, extracellular fluid; ICF,
intracellular fluid
TABLE 5–4: Role of K
+
in Resting Membrane
Potential (E
m
)
The location of K
+
and Na
+
in their respective compartments
is maintained by Na
+
-K
+
ATPase action in the cell
membrane
The Na
+
-K
+
ATPase hydrolyzes ATP to create the energy
required to pump Na
+
out and K
+
into the cell in 3:2 ratio
K
+
moves out of cells at a rate dependent on the
electrochemical gradient, creating the E
m
The Goldman-Hodgkin-Katz equation calculates the
membrane potential on the inside of the membrane using
Na
+
and K
+
138 DISORDERS OF K
+
BALANCE
TABLE 5–5: Three Factors Determine
Resting Membrane Potential (E
m
)
Electrical charge of each ion
Membrane permeability to each ion
Concentration of the ion on each side of the membrane
TABLE 5–6: The Resting Membrane Potential (E
m
)
Inserting intracellular K
+
(145) and Na
+
(12) concentrations
and extracellular K
+
(4.0) and Na
+
(140) concentrations
into the Goldman-Hodgkin-Katz equation results in
E
m
= – 90 mV
The cell interior is –90 mV, largely due to the movement of
K
+
out of the cell via the Na
+
-K
+
ATPase pump
The E
m
sets the stage for membrane depolarization and
generation of the action potential; any change in plasma
[K
+
] alters action potential and cell excitability
Physiologic and pathologic factors affect K
+
distribution
between ICF and ECF
Abbreviations: ICF, intracellular fluid; ECF, extracellular fluid
E
m
=−
+
+
61
3 2 140 0 01 12
3240 001 145
log
/( ) . ( )
/( . ) . (
))
=−90mv
DISORDERS OF K
+
BALANCE 139
CELLULAR K
+
DISTRIBUTION
TABLE 5–7: Cellular K
+
Distribution
Maintenance of plasma K
+
homeostasis following a K
+
rich
meal requires K
+
shift into cells
Cellular K
+
movement is the first response of the body
This is critical to prevent a lethal acute rise in plasma K
+
concentration as renal K
+
excretion requires several hours
Multiple physiologic and pathologic factors affect cellular
K
+
distribution
140 DISORDERS OF K
+
BALANCE
TABLE 5–8: Factors Affecting Cellular K
+
Distribution
Insulin (secreted following a meal)
•
K
+
concentration is maintained in the normal range by
physiologic effects of insulin
■
Insulin moves K
+
into cells following a meal
■
Insulin stimulates K
+
uptake by increasing the activity
and number of Na
+
-K
+
ATPase pumps in the cell
membrane
■
Intracellular K
+
shift is independent of glucose transport
■
Insulin deficiency (type 1 diabetic patients) is
associated with hyperkalemia from impaired
cellular K
+
uptake
Endogenous catecholamines (
β
2
adrenergic)
•
Promotes K
+
movement into cells (stimulation of Na
+
-K
+
ATPase)
•
Activation of
β
2
receptors generates cyclic AMP and
stimulates Na
+
-K
+
ATPase to shift K
+
into cells
•
Albuterol, a
β
2
adrenergic agonist used for asthma lowers
plasma [K
+
] through increased cell uptake
•
Propranolol, an antihypertensive medication, blocks
β
2
adrenergic receptors and raises plasma [K
+
]
•
Digoxin intoxication raises plasma [K
+
] by disrupting the
Na
+
-K
+
ATPase, thereby blocking cellular K
+
uptake
Exercise
•
Exercise has a dual effect on cellular K
+
movement
■
A transient rise in plasma K
+
concentration occurs to
increase blood flow to ischemic muscle
DISORDERS OF K
+
BALANCE 141
TABLE 5–8 (Continued)
■
Endogenous catecholamine secretion develops with
exercise, moving K
+
back into the ICF (
β
2
adrenergic
receptors) and restores plasma K
+
concentration to
normal
■
Level of exercise influences cellular K
+
release
■
Slow walking (0.3–0.4 mEq/L rise)
■
Moderate exercise (0.7–1.2 mEq/L rise
■
Point of exhaustion (2.0 mEq/L rise)
Change in pH (acidemia/alkalemia)
•
Changes in pH are associated with cellular K
+
movement
■
Metabolic acidosis promotes K
+
exit from cells in
exchange for protons (H
+
) as the cells attempt to buffer
the ECF pH
■
K
+
exchange for H
+
maintains electroneutrality across
membranes
■
This effect occurs in nonanion gap metabolic acidoses
rather than organic anion acidoses
■
In mineral metabolic acidosis, the anion Cl
−
is unable to
cross the membrane (K
+
must exit the cell to maintain
electroneutrality)
■
In organic anion acidosis, the anion (lactate) crosses
the membrane and K
+
is not required to exit the cell
to maintain electroneutrality
■
Metabolic alkalosis causes an opposite effect
(continued)
142 DISORDERS OF K
+
BALANCE
TABLE 5–8 (Continued)
•
Plasma [K
+
] increases/decreases by 0.4 mEq/L for every
0.1 unit decrease/increase in pH
■
There is wide variability (0.2–1.7 mEq/L for every 0.1
unit fall in pH) with pH change
Plasma osmolality
•
Increased plasma osmolality (hyperglycemia) raises
plasma [K
+
] as a result of a shift of K
+
out of cells
■
K
+
diffuses with water from the ICF into the ECF via
solvent drag
■
Intracellular K
+
concentration rises as water exits the
cell, increasing K
+
diffusion out of the cell
■
K
+
concentration rises by 0.4–0.8 mEq/L per 10
mosm/kg increase in effective osmolality
Aldosterone
•
Aldosterone may increase cellular K
+
uptake, but its major
effect is to enhance renal K
+
excretion
Abbreviations: AMP, adenosine monophosphate; ICF, intracellular
fluid, ECF, extracellular fluid
DISORDERS OF K
+
BALANCE 143
K
+
HANDLING BY THE KIDNEY
TABLE 5–9: K
+
Handling by the Kidney
Renal K
+
handling occurs through glomerular filtration and
both tubular reabsorption and secretion
Proximal tubule
100% of plasma K
+
reaches the proximal tubule
(freely filtered)
Proximal tubule reabsorbs 60–80% of filtered K
+
K
+
uptake occurs via passive mechanisms
•
K
+
is reabsorbed by a K
+
transporter and through
paracellular pathways coupled with Na
+
and water
•
Volume depletion increases Na
+
and water reabsorption
increasing K
+
uptake
•
Volume expansion inhibits passive diffusion of K
+
Loop of Henle
K
+
is both secreted and reabsorbed
Twenty-five percent of filtered K
+
net is reabsorbed in this
nephron segment
K
+
enters the thin descending limb and at the tip of the loop
of Henle reaches amounts that equal the original filtered
load
In medullary thick ascending limb, K
+
is actively and
passively reabsorbed
•
Active K
+
transport occurs by the Na
+
-K
+
-2Cl
−
cotransporter, which is powered by Na
+
-K
+
ATPase
(continued)
144 DISORDERS OF K
+
BALANCE
TABLE 5–9 (Continued)
Secondary active cotransport is driven by the steep Na
+
gradient across the apical membrane created by the ATPase
Medications such as loop diuretics and genetic disorders
impair the activity of this cotransporter and result in Na
+
and K
+
wasting
Distal nephron
Approximately 10% of filtered K
+
reaches the distal tubule
K
+
secretion or reabsorption occurs in distal tubule, primarily
in CCD
•
High luminal Na
+
concentration and low luminal Cl
−
concentration stimulate K
+
-Cl
−
cotransporter to secrete K
+
Abbreviation: CCD, cortical collecting duct
DISORDERS OF K
+
BALANCE 145
TABLE 5–10: Cell Types Involved in K
+
Transport
in the Distal Nephron
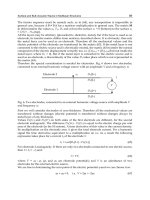
Principal cell (see Figure 5–1)
Promotes K
+
secretion in the CCD
The apical membrane of this cell contains ENaC and K
+
channels, which act in concert with basolateral Na
+
-K
+
ATPase to reabsorb Na
+
and secrete K
+
•
Na
+
reabsorption through ENaC increases K
+
secretion by
creating an electrochemical gradient for K
+
movement
•
An electrical gradient develops because Na
+
leaves the
lumen without an accompanying anion, creating a lumen
negative charge that stimulates K
+
secretion
•
Entry of Na
+
into cells increases basolateral Na
+
-K
+
ATPase activity to lower intracellular Na
+
•
Transporting three Na
+
ions out of the cell and two K
+
ions
into the cell increases intracellular K
+
concentration and
creates a gradient favoring K
+
exit through apical K
+
channels
Blockade of ENaC reduces renal K
+
excretion by blocking
generation of the electrochemical gradient
Aldosterone receptor antagonists reduce apical ENaC function
and Na
+
-K
+
ATPase activity, limiting K
+
secretion
Alpha intercalated cell (see Figure 5–2)
This cell promotes K
+
reabsorption
•
H
+
-K
+
ATPase on the apical surface of this cell reabsorbs
K
+
in exchange for H
+
Abbreviations: CCD, cortical collecting duct; ENaC, epithelial
Na
+
channel
146 DISORDERS OF K
+
BALANCE
FIGURE 5–1: Principal cell in the CCD secretes K
؉
into
urine via the passive K
؉
(ROMK) channel stimulated by the
electrochemical gradient generated by Na
؉
reabsorption via
the passive Na
؉
(ENaC) channel and action of the
Na
؉
-K
؉
ATPase enzyme on the basolateral membrane
FIGURE 5–2: Alpha intercalated cell in the CCD reabsorbs
K
؉
via the H
؉
-K
؉
ATPase enzyme on the apical membrane
and the action of the Na
؉
-K
؉
ATPase enzyme on the
basolateral membrane
DISORDERS OF K
+
BALANCE 147
FACTORS CONTROLLING RENAL K
+
EXCRETION
TABLE 5–11: Factors That Influence Renal K
+
Excretion
Aldosterone
Plasma K
+
concentration
Tubular flow rate
Tubular Na
+
concentration
Antidiuretic hormone
Glucocorticoids
Metabolic alkalosis
Metabolic acidosis
Impermeant anions in urine (sulfate, bicarbonate,
carbenicillin)
148 DISORDERS OF K
+
BALANCE
TABLE 5–12: Four Major Factors that Control
Renal K
+
Excretion
Aldosterone
•
Binds the mineralocorticoid receptor
•
Stimulates Na
+
entry (ENaC) and enhances basolateral
Na
+
-K
+
ATPase activity
•
This creates an electrical potential for K
+
secretion (lumen
negative charge for K
+
movement), and diffusional
gradient for K
+
secretion (raising intracellular K
+
concentration)
Plasma K
ϩ
concentration
•
Plasma K
+
concentration > 5.0 mEq/L produces effects on
the principal cell that are similar to aldosterone
•
This represents a protective mechanism to maintain renal
K
+
excretion even when aldosterone is deficient or absent
Urine flow rate and Na
+
delivery
•
These factors act on the luminal side (urinary space) to
modify K
+
excretion
•
High urine flow rates enhance K
+
secretion by maintaining
low urine [K
+
] and a favorable diffusional gradient
•
Urinary Na
+
delivery to the principal cell promotes K
+
secretion by enhancing Na
+
entry (ENaC), creating a
favorable electrochemical gradient
Abbreviation: ENaC, epithelial Na
+
channel
DISORDERS OF K
+
BALANCE 149
HYPOKALEMIA
Hypokalemia is defined as plasma K
+
concentration
< 3.5 mEq/L
ETIOLOGY
TABLE 5–13: General Categories of Causes
of Hypokalemia
Dietary K
+
•
Inadequate oral intake (in combination with other factors)
Cellular K
+
uptake
•
Insulin
•
Catecholamines (B
2
adrenergic)
•
Metabolic alkalosis
•
Hypokalemic periodic paralysis
•
Cell growth from B12 therapy
•
Cesium chloride, barium intoxication, risperidone,
quetiapine, and chloroquine
Renal K
+
excretion
•
Aldosteronism (primary or secondary)
•
Corticosteroid excess
•
High urine flow rate from diuretics
•
High distal Na
+
delivery
•
Renal tubular acidosis
(continued)
150 DISORDERS OF K
+
BALANCE
TABLE 5–13 (Continued)
•
Drugs
■
Amphotericin B
■
Diuretics
■
Aminoglycosides
■
Lithium
■
Cisplatinum
■
Some penicillins
•
Genetic renal diseases
■
Bartter syndrome
■
Gitelman’s syndrome
■
Liddle’s syndrome
■
Apparent mineralocorticoid excess
Gastrointestinal K
+
loss
•
Vomiting
•
Diarrhea, ostomy losses
Skin K
+
loss
•
Strenuous exercise
•
Severe heat stress
DISORDERS OF K
+
BALANCE 151
TABLE 5–14: Increased Cellular K
+
Uptake
Exogenous insulin administration shifts K
+
into cells
•
Diabetic patients given insulin develop hypokalemia due
to cellular K
+
uptake
β
2
adrenergic agonists mediate cell uptake by
β
2
receptors
•
β
2
adrenergic agonist therapy in the patient with severe
asthma (albuterol) or in labor (ritodrine) causes
hypokalemia through cell shift
Metabolic alkalosis promotes cell K
+
shift
•
This acid-base disorder is precipitated by vomiting and
diuretic use, which contributes to renal K
+
losses
Hypokalemic periodic paralysis causes hypokalemia from
cellular K
+
uptake precipitated by a carbohydrate meal
Rapid synthesis of red blood cells induced by B
12
or iron
therapy may cause hypokalemia as new cells utilize K
+
152 DISORDERS OF K
+
BALANCE
TABLE 5–15: Increased Renal K
+
Excretion
Medications increase renal K
+
excretion in various
nephron segments
In PCT
•
Acetazolamide blocks carbonic anhydrase and induces
bicarbonaturia and K
+
wasting
•
Osmotic diuretics increase flow through PCT, reducing
Na
+
, water and K
+
reabsorption
•
Aminoglycosides and cisplatin injure PCT cells and cause
K
+
wasting
In TALH
•
Na
+
-K
+
-2Cl
−
transporter reabsorbs K
+
in TALH
•
Loop diuretics inhibit function of this transporter and
reduce K
+
reabsorption via paracellular and transcellular
pathways
In DCT
•
Thiazide diuretics block the NCC in DCT, increasing Na
+
delivery and urine to principal cells in CCD
•
Fludrocortisone binds the aldosterone receptor and
stimulates renal K
+
secretion in principal cells
•
Amphotericin B disrupts principal cell membranes,
allowing K
+
to leak out of the cell
Clinical disease states increase renal K
+
excretion
Primary or secondary aldosteronism and corticosteroid
excess induce hypokalemia by stimulation of
mineralocorticoid receptors and K
+
secretion in CCD
DISORDERS OF K
+
BALANCE 153
TABLE 5–15 (Continued)
Primary or acquired forms of RTA cause hypokalemia
through tubular dysfunction proximally (type 2 RTA) or
distally (type 1 RTA)
Inherited renal disorders cause K
+
wasting and hypokalemia
•
In TALH, various mutations cause cellular dysfunction,
resulting in Bartter syndrome (see Table 7–16)
•
Mutation of the gene encoding the thiazide sensitive NCC
causes Gitelman’s syndrome (see Table 7–16)
•
Activating mutations in subunits of the ENaC (
β
,
γ
) cause
Liddle’s syndrome (see Table 7–15)
Abbreviations: PCT, proximal convoluted tubule; TALH, thick
ascending limb of Henle; DCT, distal tubule; NCC, Na
+
-Cl
−
cotransporter; CCD, cortical collecting duct; RTA, renal tubular
acidosis; ENaC, epithelial Na
+
channel
TABLE 5–16: Other Sources of K
+
Loss from the Body
GI K
+
losses
•
Vomiting, diarrhea, and excessive ostomy output may
cause excessive K
+
losses from the GI tract
Skin K
+
losses
•
Extreme heat (hyperthermia) or severe exercise causes
hypokalemia
Abbreviation: GI, gastrointestinal
154 DISORDERS OF K
+
BALANCE
APPROACH TO THE PATIENT
TABLE 5–17: Approach to the Patient with Hypokalemia
A stepwise approach to hypokalemia assures accurate
diagnosis
The initial evaluation of hypokalemia divides
pseudohypokalemia from true hypokalemia, followed by
separating cell shift of potassium from excessive renal or
GI losses of K
+
(see Figure 5–3)
Step 1 Exclude pseudohypokalemia and cell shift
Step 2 Measure the patient’s blood pressure
•
Hypertension associated with hypokalemia is then
classified based on concentrations of renin and
aldosterone
High versus low renin
High versus low aldosterone
•
Hypotension or normotension associated with
hypokalemia requires measurement of urinary
K
+
concentration
■
Renal versus extrarenal causes
Step 3 Measure acid-base status to determine further
classification of hypokalemia with normal or low
blood pressure
•
Metabolic acidosis
•
Metabolic alkalosis
Abbreviation: GI, gastrointestinal
155
FIGURE 5–3: Diagram of Approach to Hypokalemia Emphasizing Utility of Blood Pressure, Plasma Renin
Activity and Aldosterone Concentration, and Acid-Base Status (Metabolic Acidosis vs. Metabolic Alkalosis)
in Establishing the Cause of Hypokalemia
156 DISORDERS OF K
+
BALANCE
CLINICAL MANIFESTATIONS
TABLE 5–18: Clinical Manifestations of Hypokalemia
Clinical manifestations are effects of serum K
+
deficits on
action potential generation in excitable tissues
Impaired neuromuscular function precipitates a spectrum of
findings ranging from muscle weakness to frank paralysis
Cardiac disturbances
•
Various atrial and ventricular arrhythmias
•
Hypokalemic arrhythmias may be fatal in patients on
digoxin or in those with underlying cardiac disease
•
Abnormal myocardial contractile function
Renal manifestations
•
Impaired urinary concentration (polyuria)
•
Increased renal ammonia production and bicarbonate
reabsorption (perpetuating metabolic alkalosis)
•
Renal dysfunction from either tubular vacuolization
(hypokalemic nephropathy) or myoglobinuria
Metabolic perturbations
•
Hyperglycemia from decreased insulin release
•
Impaired hepatic glycogen and protein synthesis
Other organ systems
•
Respiratory failure from diaphragmatic muscle weakness
•
Ileus from reduced smooth muscle contractility
DISORDERS OF K
+
BALANCE 157
TREATMENT
TABLE 5–19: Treatment of Hypokalemia
Treatment of hypokalemia is guided by two major factors
Determine physiologic effects
Physiologic effects of hypokalemia are best judged by:
•
Physical examination of neuromuscular function
■
Muscle weakness is present with hypokalemia, while
paralysis signals severe hypokalemia
•
ECG interrogation of the cardiac conduction system
■
Prominent U waves (see Figure 5–4) suggest a serum
K
+
concentration in the 1.5–2.0 mEq/L range
Approximate the K
+
deficit
K
+
deficit is approximated by the following:
•
Underlying mechanism of hypokalemia
■
Less with cell shift, more with renal/GI losses
•
The prevailing serum K
+
concentration
■
3.0–3.5 mEq/L range, total body K
+
deficits reach
200–400 mEq
■
2.0–3.0 mEq/L range, total body K
+
deficits reach
400–800 mEq
Abbreviations: ECG, electrocardiography; GI, gastrointestinal
158 DISORDERS OF K
+
BALANCE
HYPERKALEMIA
Hyperkalemia is defined as plasma K
+
concentration > 5.5 mEq/L.
FIGURE 5–4: Electrocardiogram of Hypokalemia
Demonstrating the U Wave (Arrow) Indicative of Severe
Hypokalemia
TABLE 5–20: Correction of Hypokalemia
Oral KCl (40–80 mEq/day) is preferred with mild to
moderate deficits (2.5–3.5 mEq/L)
IV KCl (20–40 mEq/L in 1 L of 0.45 normal saline at a rate
≤ 20 mEq/h) plus oral KCl are required for severe K
+
deficits
(< 2.5 mEq/L)
•
Faster rates are avoided as they injure veins (sclerosis) and
cause cardiac dysrrhythmias
Correction of the cause of hypokalemia is part of therapy
Abbreviation: IV, intravenous
DISORDERS OF K
+
BALANCE 159
ETIOLOGY
TABLE 5–21: Basics of Hyperkalemia
Hyperkalemia is broken down into the following:
•
Pseudohyperkalemia
•
True hyperkalemia
■
Impaired cell K
+
uptake
■
Decreased renal K
+
excretion
TABLE 5–22: Causes of Pseudohyperkalemia
Pseudohyperkalemia rarely falsely elevates the serum K
+
concentration
•
K
+
release from cells within the test tube
•
Cell lysis following prolonged tourniquet application
•
K
+
release from large cell numbers (white blood cells
>100,000/mm
3
; platelets >1,000,000/mm
3
)