Financial Toolbox For Use with MATLAB Computation Visualization Programming phần 8 ppt
Bạn đang xem bản rút gọn của tài liệu. Xem và tải ngay bản đầy đủ của tài liệu tại đây (162.28 KB, 40 trang )
portcons
2-182
2portcons
Purpose Portfolio constraints.
Syntax ConSet = portcons(varargin)
Description Using linear inequalities, portcons generates a matrix of constraints for a
portfolio of asset investments. The matrix
ConSet is defined as
ConSet = [A b]. A is a matrix and b a vector such that A*PortWts' <= b sets
the value, where
PortWts is a 1-by-number of assets (NASSETS)vectorofasset
allocations.
ConSet = portcons('ConstType', Data1, , DataN) creates a matrix
ConSet, based on the constraint type ConstType, and the constraint
parameters
Data1, , DataN.
ConSet = portcons('ConstType1', Data11, , Data1N,'ConstType2',
Data21, , Data2N, )
creates a matrix ConSet,basedonthe
constraint types
ConstTypeN, and the corresponding constraint parameters
DataN1, , DataNN.
Constraint Type Description Values
Default All allocations are >= 0; no
short selling allowed.
Combined value of portfolio
allocations normalized to 1.
NumAssets (req ui red).
Scalar representing
number of assets in
portfolio.
PortValue
Fix total value of p ortfolio to
PVal.
PVal (require d). Scalar
represent ing total
value of portfolio.
NumAssets (required).
Scalar representing
number of assets in
portfolio. See
pcpval.
portcons
2-183
AssetLims
Minimum and maximum
allocation per asset.
AssetMin (required).
Scalarorvectorof
length
NASSETS,
specifying minimum
allocation per asset.
AssetMax (required).
Scalarorvectorof
length
NASSETS,
specifying maximum
allocation per asset.
NumAssets (optional).
See
pcalims.
GroupLims
Minimum and maximum
allocations to asset group.
Groups (required).
NGROUPS-by-NASSETS
matrix specifying
which assets belong
to each group.
GroupMin (required).
Scalaroravectorof
length
NGROUPS,
specifying minimum
combined allocations
in each group.
GroupMax (required).
Scalaroravectorof
length
NGROUPS,
specifying maximum
combined allocations
in each group. See
pcglims.
Constraint Type Description Values
portcons
2-184
GroupComparison
Group-to-group comparison
constraints.
GroupA (required).
GroupB (required).
NGROUPS-by-NASSETS
matrices specifying
groups to compare.
AtoBmin (required).
Scalar or vector of
length
NGROUPS
specifying minimum
ratios of allocations in
GroupA to allocations
in
GroupB.
AtoBmax (required).
Scalar or vector of
length
NGROUPS
specifying maximum
ratios of allocations in
GroupA to allocations
in
GroupB.
See
pcgcomp .
Custom
Custom linear inequality
constraints
A*PortWts' <= b.
A (required).
NCONSTRAINTS by
NASSETS matrix,
specifying weights for
each asset in each
inequality equation.
b (required). Vector of
length
NCONSTRAINTS
specifying the right
hand sides of the
inequalities.
Constraint Type Description Values
portcons
2-185
Example Constrain a portfolio of three assets:
NumAssets = 3
PVal = 1 % Scale portfolio value to 1.
AssetMin = 0
AssetMax = [0.5 0.9 0.8]
GroupA = [1 1 0]
GroupB = [0 0 1]
AtoBmax = 1.5 % Value of assets in Group A at most 1.5 times value
% in group B.
ConSet = portcons('PortValue', PVal, NumAssets,'AssetLims',
AssetMin, AssetMax, NumAssets, 'GroupComparison',GroupA, NaN,
AtoBmax, GroupB)
ConSet =
1.0000 1.0000 1.0000 1.0000
–1.0000 –1.0000 –1.0000 –1.0000
1.0000 0 0 0.5000
0 1.0000 0 0.9000
0 0 1.0000 0.8000
–1.0000 0 0 0
0 –1.0000 0 0
0 0 –1.0000 0
1.0000 1.0000 –1.5000 0
Portfolio weights of 30% in IBM, 30% in CPQ, and 40% in XON satisfy the
constraints.
See Also pcalims, pcgcomp, pcglims, pcpval, portopt
Asset IBM CPQ XON
Group A A B
Min. Wt. 0 0 0
Max. Wt. 0.5 0.9 0.8
portopt
2-186
2portopt
Purpose Portfolios on constrained efficient frontier.
Syntax [PortRisk, PortReturn, PortWts] = portopt(ExpReturn, ExpCovariance,
NumPorts, PortReturn, ConSet)
Arguments
Description
[PortRisk, PortReturn, PortWts] = portopt(ExpReturn, ExpCovariance,
NumPorts, PortReturn, ConSet)
returns the me an- variance efficient
frontier with user-specified covariance, returns, and asset constraints
(
ConSet). Given a collection of NASSETS risky assets, computes a portfolio of
asset investment weights that minimize the risk for given values of the
expected return. The portfolio risk is minimized s ubject to constraints on the
total portfolio value, the individual asset minimum and maximum allocation,
the asset group minimum and maximum allocation, or the asset
group-to-group comparison.
PortRisk is a number of portfolios (NPORTS)-by-1 vectorofthevarianceofeach
portfolio.
PortReturn is an NPORTS-by-1 vectoroftheexpectedreturnofeachportfolio.
ExpReturn
1
-by-number of assets (NASSETS) vector specifying the
expected (mean) return of each asset.
ExpCovariance
NASSETS
-by-NASSETS matrix specifying the covariance
of the asset returns.
NumPorts
Number of portfolios generated along the efficient
frontier. Returns are equally spaced between the
maximum possible return and the minimum risk
point. If
NumPorts is empty (entered as []), computes
10 equally spaced points.
PortReturn
Expected return of each portfolio. A number of
portfolios (
NPORTS)-by-1 vector. If not entered or empty,
NumPorts equally spaced returns between the
minimum and maximum possible values are used.
ConSet
Constraint matrix for a portfolio of asset investments,
created using
portcons. If not specified, a default is
created.
portopt
2-187
PortWts is an NPORTS-by-NASSETS matrix of weights allocated to each asset.
Each row represents a portfolio. The total of all weights in a portfolio is 1.
If
portopt is invoked without output arguments, it returns a plot of the
efficient frontier.
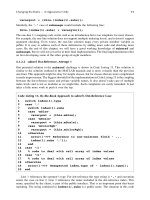
Examples Plot the risk-return efficient frontier of portfolios allocated among three assets.
Connect 20 portfolios along the frontier having evenly spaced returns. By
default, choose among portfolios without short-selling and scale the value of
the portfolio to 1.
ExpReturn = [0.1 0.2 0.15];
ExpCovariance = [
0.005 -0.010 0.004
-0.010 0.040 -0.002
0.004 -0.002 0.023 ];
NumPorts = 20;
portopt(ExpReturn, ExpCovariance, NumPorts)
0.02 0.04 0.06 0.08 0.1 0.12 0.14 0.16 0.18 0.2 0.22
0.12
0.13
0.14
0.15
0.16
0.17
0.18
0.19
0.2
0.21
Mean−Variance−Efficient Frontier
Risk(Standard Deviation)
Expected Return
portopt
2-188
Return the two efficient portfolios that have returns of 16% and 17%. Limit to
portfolios that have at least 20% of the allocation in the first asset, and cap the
total value in the first and third assets at 50% of the portfolio.
ExpReturn = [0.1 0.2 0.15];
ExpCovariance = [
0.005 -0.010 0.004
-0.010 0.040 -0.002
0.004 -0.002 0.023 ];
PortReturn = [0.16
0.17];
NumAssets = 3;
AssetMin = [0.20 NaN NaN];
Group = [ 1 0 1 ];
GroupMax = 0.50;
ConSet = portcons('Default', NumAssets, 'AssetLims', AssetMin,
NaN,'GroupLims', Group, NaN, GroupMax);
[PortRisk, PortReturn, PortWts] = portopt(ExpReturn,
ExpCovariance, [], PortReturn, ConSet)
PortRisk =
0.0919
0.1138
PortReturn =
0.1600
0.1700
PortWts =
0.3000 0.5000 0.2000
0.2000 0.6000 0.2000
See Also ewstats, frontcon, portcons, portstats
portrand
2-189
2portrand
Purpose Randomized portfolio risks, returns, and weights.
Syntax [risk, ror, weights] = portrand(asset, ret, pts)
[risk, ror, weights] = portrand(asset, ret)
[risk, ror, weights] = portrand(asset)
portrand(asset, ret, pts)
Arguments asset M-by-N matrix of time series data. Rows (M) are observations, and
each column (N) represents a single security.
ret 1-by-N vector where each column represents the rate of return for the
corresponding security in
asset.Bydefault,ret is computed by taking
theaveragevalueofeachcolumnof
asset.
pts Scalar that specifies how many random points should be generated.
Default =
1000.
Description [risk, ror, weights] = portrand(asset, ret, pts) returns the risks,
rates of return, and weights of random portfolio configurations.
risk A pts-by-1 vector of standard deviations.
ror A pts-by-1 vector of expected rates of return.
weights A pts-by-N matrix of asset weights. Each row of weights is a
different portfolio configuration.
portrand(asset, ret, pts) plots the points representing each portfolio
configuration. It does not return any data to the MATLAB workspace.
This function is used in the MATLAB Financial Expo and illustrates how
multiple weighting combinations of the same portfolio will generate the same
expected rate of return.
See Also frontier
Reference Bodie, Kane, and Marcus, Investments,Chapter7.
portsim
2-190
2portsim
Purpose Random simulation of correlated asset returns.
Syntax RetSeries = portsim(ExpReturn, ExpCovariance, NumObs, RetIntervals,
NumSim)
Arguments
Description
portsim simulates returns of NASSETS assets over consecutive observation
intervals. Returns are simulated as the increments of constant drift and
volatility Brownian processes.
RetSeries is a NUMOBS-by-NASSETS-by-NUMSIM array of incremental return
observations. The return over an interval of length
DT is given by
ExpReturn*DT + ExpSigma*sqrt(DT)*randn,whererandn provides a ra ndom
scalar whose va lue changes each time
randn is re fere nced.
The returns realized from portfolios listed in
PortWts are given by:
PortReturn = PortWts * RetSeries(:,:,1)',wherePortWts is a matrix in
which each row contains the asset allocations of a portfolio. Each row of
PortReturn corresponds to one of the portfolios identified in PortWts,andeach
column corresponds to one of the observations in
RetSeries.Seeportopt and
portstats for portfolio specification and optimization.
ExpReturn
1
-by-number of assets (NASSETS) vector specifying the
expected (mean) return of each asset.
ExpCovariance
NASSETS
-by-NASSETS matrix of asset-asset
covariances. The standard deviations of the returns
are:
ExpSigma = sqrt(diag(ExpCovariance)).
NumObs
Number of consecutive observations in the return time
series. If
NumObs is entered as the empty matrix [],the
length of
RetIntervals is used.
RetIntervals
Scalar or number of observations (NUMOBS)-by-1 vector
of interval times between observations. If
RetIntervals is not specified, all i ntervals are
assumedtohavelength1.
NumSim
Number of separate simulations of the NUMOBS
observations to perform. Default = 1.
portsim
2-191
Example Create sample returns for three stocks over 10 periods.
ExpReturn = [0.1 0.2 0.15];
ExpCovariance = [
0.005 –0.010 0.004
–0.010 0.040 –0.002
0.004 –0.002 0.023 ];
NumObs = 10;
RetSeries = portsim(ExpReturn, ExpCovariance, NumObs)
RetSeries =
0.1429 0.2626 0.2365
0.0821 0.1599 –0.1796
0.0054 0.6126 0.1072
0.1719 –0.0669 0.1913
0.1518 –0.0843 0.0442
0.0112 0.2709 0.1501
0.0409 0.1683 0.1932
0.1485 0.2522 0.2774
0.0463 0.3222 0.0954
0.1990 0.1024 0.3843
See Also ewstats, portopt, portstats, randn, ret2tick
portstats
2-192
2portstats
Purpose Portfolioexpectedreturnandrisk.
Syntax [PortRisk, PortReturn] = portstats(ExpReturn, ExpCovariance,
PortWts)
Arguments
Description
[PortRisk, PortReturn] = portstats(ExpReturn, ExpCovariance,
PortWts)
computes the expected rate of return and risk for a portfolio of
assets.
PortRisk is an NPORTS-by-1 vector of the standard deviation of each portfolio.
PortReturn is an NPORTS-by-1 vectoroftheexpectedreturnofeachportfolio.
ExpReturn
1
-by-number of assets (NASSETS) vector specifying the
expected (mean) return of each asset.
ExpCovariance
NASSETS
-by-NASSETS matrix specifying the covariance
of the asset returns.
PortWts
Number of portfolios (NPORTS)-by-NASSETS matrix of
weights allocated to each asset. Each row represents a
different weighting combination. Default =
1/NASSETS.
portstats
2-193
Examples ExpReturn = [0.1 0.2 0.15];
ExpCovariance = [
0.0100 –0.0061 0.0042
–0.0061 0.0400 –0.0252
0.0042 –0.0252 0.0225 ];
PortWts=[0.4 0.2 0.4; 0.2 0.4 0.2];
[PortRisk, PortReturn] = portstats(ExpReturn, ExpCovariance,
PortWts)
PortRisk =
0.0560
0.0550
PortReturn =
0.1400
0.1300
See Also frontcon
portvrisk
2-194
2portvrisk
Purpose Portfolio value at risk
Syntax ValueAtRisk = portvrisk(PortReturn, PortRisk, RiskThreshold,
PortValue)
Arguments
Description
ValueAtRisk = portvrisk(PortReturn, PortRisk, RiskThreshold,
PortValue)
returns the maximum potential loss in the value of a portfolio over
one period of time, given the loss probability level
RiskThreshold.
ValueAtRisk is an NPORTS-by-1 vector of the estimated maximum loss in the
portfolio, predicted with a confidence probability of
1– RiskThreshold.
If
PortValue is not given, ValueAtRisk is presented on a per-unit basis. A value
of
0 indicates no losses.
Examples This example computes ValueAtRisk on a per-unit basis.
PortReturn = 0.29/100;
PortRisk = 3.08/100;
RiskThreshold = [0.01;0.05;0.10];
PortValue = 1;
ValueAtRisk = portvrisk(PortReturn,PortRisk,
RiskThreshold,PortValue)
ValueAtRisk =
0.0688
0.0478
0.0366
PortReturn
Number of portfolios (NPORTS)-by-1 vector or scalar of
the expected return of each portfolio over the period.
PortRisk
NPORTS
-by-1 vector or scalar of the standard deviation
of each portfolio over the period.
RiskThreshold
NPORTS-by-1 vector or scalar specifying the loss
probability. Default =
0.05 (5%).
PortValue
NPORTS-by-1 vector or scalar specifying the total value
of asset portfolio. Default =
1.
portvrisk
2-195
This example computes ValueAtRisk with actual values.
PortReturn = [0.29/100;0.30/100];
PortRisk = [3.08/100;3.15/100];
RiskThreshold = 0.10;
PortValue = [1000000000;500000000];
ValueAtRisk = portvrisk(PortReturn,PortRisk,
RiskThreshold,PortValue)
ValueAtRisk =
1.0e+007 *
3.6572
1.8684
See Also frontcon, portopt
prbond
2-196
2prbond
Purpose Price of security with regular periodic interest payments.
Syntax [p, ai] = prbond(sd, md, rv, cpn, yld, per, basis)
[p, ai] = prbond(sd, md, rv, cpn, yld, per)
[p, ai] = prbond(sd, md, rv, cpn, yld)
Arguments sd Settlement date. Enter as serial date number or date string. sd must
be earlier than or equal to
md.
md Maturity date. Enter as serial date number or date string.
rv Redemption (par, face) value.
cpn Coupon rate. Enter as decimal fraction.
yld Yield. Enter as decimal fraction.
per Coupons per year. An integer. Default = 2.
basis Day-count basis: 0 = actual/actual (default), 1 = 30/360,
2 = actual/360, 3 = actual/365.
Description [p, ai] = prbond(sd, md, rv, cpn, yld, per, basis) returns the price
p and accrued interest ai of a security with regular periodic interest payments.
This function also applies to zero-coupon bonds or pure discount securities by
setting
cpn = 0.
Example Using this data:
sd = '02/01/1960';
md = '01/01/1990';
rv = 1000;
cpn = 0.08;
yld = 0.06;
per = 2;
basis = 0;
[p, ai] = prbond(sd, md, rv, cpn, yld, per, basis)
prbond
2-197
returns
p =
1276.64e+003
ai =
6.8132
See Also acrubond, prdisc, prmat, proddf, proddfl, proddl, yldbond
Reference Mayle, Standard Securities Calculation Methods, Volumes I-II, 3rd edition.
Formulas 6, 7.
prdisc
2-198
2prdisc
Purpose Price of discounted security.
Syntax p = prdisc(sd, md, rv, disc, basis)
p = prdisc(sd, md, rv, disc)
Arguments sd Settlement date. Enter as serial date number or date string. sd must
be earlier than or equal to
md.
md Maturity date. Enter as serial date number or date string.
rv Redemption (par, face) value.
disc Discount rate of the security. Enter as decimal fraction.
basis Day-count basis: 0 = actual/actual (default), 1 = 30/360,
2 = actual/360, 3 = actual/365.
Description p = prdisc(sd, md, rv, disc, basis) returns the price of a discounted
security.
Example Using this data:
sd = '10/14/1988';
md = '03/17/1989';
rv = 100;
disc = 0.087;
basis = 2;
p = prdisc(sd, md, rv, disc, basis)
returns
p =
96.2783
See Also acrudisc, prbond, prmat, ylddisc
Reference Mayle, Standard Securities Calculation Methods, Volumes I-II, 3rd edition.
Formula 2.
prmat
2-199
2prmat
Purpose Pricewithinterestatmaturity.
Syntax [p, ai] = prmat(sd, md, id, rv, cpn, yld, basis)
[p, ai] = prmat(sd, md, id, rv, cpn, yld)
Arguments sd Settlement date. Enter as serial date number or date string. sd must
be earlier than or equal to
md.
md Maturity date. Enter as serial date number or date string.
id Issue date. Enter as serial date number or date string.
rv Redemption (par, face) value.
cpn Coupon rate. Enter as decimal fraction.
yld Yield. Enter as decimal fraction.
basis Day-count basis: 0 = actual/actual (default), 1 = 30/360,
2 = actual/360, 3 = actual/365.
Description [p, ai] = prmat(sd, md, id, rv, cpn, yld, basis) returns the price p
and accrued interest ai of a security that pays interest at maturity. This
function also applies to z ero-coupon bonds or pure discount securities by
setting
cpn = 0.
Example Using this data:
sd = '02/07/1992';
md = '04/13/1992';
id = '10/11/1991';
rv = 100;
cpn = 0.0608;
yld = 0.0608;
basis = 1;
[p, ai] = prmat(sd, md, id, rv, cpn, yld, basis)
prmat
2-200
returns
p =
99.9784
ai =
1.9591
See Also acrubond, acrudisc, prbond, prdisc, yldmat
Reference Mayle, Standard Securities Calculation Methods, Volumes I-II, 3rd edition.
Formula 4.
proddf
2-201
2proddf
Purpose Price with odd first period.
Syntax [p, ai] = proddf(sd, md, id, fd, rv, cpn, yld, per, basis)
[p, ai] = proddf(sd, md, id, fd, rv, cpn, yld, per)
[p, ai] = proddf(sd, md, id, fd, rv, cpn, yld)
Arguments sd Settlement date. Enter as serial date number or date string. sd must
be earlier than or equal to
md.
md Maturity date. Enter as serial date number or date string.
id Issue date. Enter as serial date number or date string.
fd First coupon date. Enter as serial date number or date string.
rv Redemption (par, face) value.
cpn Coupon rate. Enter as decimal fraction.
yld Yield. Enter as decimal fraction.
per Coupons per year. An integer. Default = 2.
basis Day-count basis: 0 = actual/actual (default), 1 = 30/360,
2 = actual/360, 3 = actual/365.
Description [p, ai] = proddf(sd, md, id, fd, rv, cpn, yld, per, basis) returns
the price
p and accrued interest ai of a security with an odd first period and the
settlement date in the first period.
Example Using this data:
sd = '11/11/1992';
md = '03/01/2005';
id = '10/15/1992';
fd = '03/01/1993';
rv = 100;
cpn = 0.0785;
yld = 0.0625;
per = 2;
basis = 0;
[p, ai] = proddf(sd, md, id, fd, rv, cpn, yld, per, basis)
proddf
2-202
returns
p =
113.5977
ai =
0.5855
See Also acrubond, cfdates, prbond, proddfl, proddl, yldoddf
Reference Mayle, Standard Securities Calculation Methods, Volumes I-II, 3rd edition.
Formulas 8, 9.
proddfl
2-203
2proddfl
Purpose Price with odd first and last periods and settlement in first period.
Syntax [p, ai] = proddfl(sd, md, id, fd, lcd, rv, cpn, yld, per, basis)
[p, ai] = proddfl(sd, md, id, fd, lcd, rv, cpn, yld, per)
[p, ai] = proddfl(sd, md, id, fd, lcd, rv, cpn, yld)
Arguments sd Settlement date. Enter as serial date number or date string. sd must
be earlier than or equal to
md.
md Maturity date. Enter as serial date number or date string.
id Issue date. Enter as serial date number or date string.
fd First coupon date. Enter as serial date number or date string.
lcd Last coupon date. Enter as serial date number or date string.
rv Redemption (par, face) value.
cpn Coupon rate. Enter as decimal fraction.
yld Yield. Enter as decimal fraction.
per Coupons per year. An integer. Default = 2.
basis Day-count basis: 0 = actual/actual (default), 1 = 30/360,
2 = actual/360, 3 = actual/365.
Description [p, ai] = proddfl(sd, md, id, fd, lcd, rv, cpn, yld, per, basis)
returns the price p and accrued interest ai of a security with odd first and last
periods and the settlement date in the first period.
proddfl
2-204
Example Using this data:
sd = '03/15/1993';
md = '03/01/2020';
id = '03/01/1993';
fd = '07/01/1993';
lcd = '01/01/2020';
rv = 100;
cpn = 0.04;
yld = 0.0427;
per = 2;
basis = 1;
[p, ai] = proddfl(sd, md, id, fd, lcd, rv, cpn, yld, per, basis)
returns
p =
95.6939
ai =
0.1556
See Also acrubond, cfdates, prbond, proddf, proddl, yldbond, yldoddfl
Reference Mayle, Standard Securities Calculation Methods, Volumes I-II, 3rd edition.
Formulas 16, 17, 18, 19.
proddl
2-205
2proddl
Purpose Price with odd last period.
Syntax [p, ai] = proddl(sd, md, lcd, rv, cpn, yld, per, basis)
[p, ai] = proddl(sd, md, lcd, rv, cpn, yld, per)
[p, ai] = proddl(sd, md, lcd, rv, cpn, yld)
Arguments sd Settlement date. Enter as serial date number or date string. sd must
be earlier than or equal to
md.
md Maturity date. Enter as serial date number or date string.
lcd Last coupon date. Enter as serial date number or date string.
rv Redemption (par, face) value.
cpn Coupon rate. Enter as decimal fraction.
yld Yield. Enter as decimal fraction.
per Coupons per year. An integer. Default = 2.
basis Day-count basis: 0 = actual/actual (default), 1 = 30/360,
2 = actual/360, 3 = actual/365.
Description [p, ai] = proddl(sd, md, lcd, rv, cpn, yld, per, basis) returns the
price
p and accrued interest ai of a security with odd last period.
Example Using this data:
sd = '02/07/1993';
md = '08/01/1993';
lcd = '02/04/1993';
rv = 100;
cpn = 0.0650;
yld = 0.0535;
per = 2;
basis = 1;
[p, ai] = proddl(sd, md, lcd, rv, cpn, yld, per, basis)
proddl
2-206
returns
p =
100.5411
ai =
0.0542
See Also acrubond, cfdates, prbond, proddf, proddfl, yldoddl
Reference Mayle, Standard Securities Calculation Methods, Volumes I-II, 3rd edition.
Formulas 11, 13, 14, 15.