Báo cáo y học: "Inhaled nitric oxide in acute respiratory distress syndrome with and without septic shock requiring norepinephrine administration: a dose–response study" ppt
Bạn đang xem bản rút gọn của tài liệu. Xem và tải ngay bản đầy đủ của tài liệu tại đây (508.9 KB, 16 trang )
Available online />Page 1 of 16
(page number not for citation purposes)
/>Research
Inhaled nitric oxide in acute respiratory distress syndrome with
and without septic shock requiring norepinephrine
administration: a dose–response study
Eric Mourgeon
1
, Louis Puybasset
1
, Jean-Dominique Law-Koune
1
, Qin Lu
1
, Lamine Abdennour
1
,
Lluis Gallart
1
, Patrick Malassine
1
, GS Umamaheswara Rao
1
, Philippe Cluzel
3
, Abdelhai Bennani
2
,
Pierre Coriat
1
and Jean-Jacques Rouby
1
1
Unité de Réanimation Chirurgicale, Département d'Anesthésie, Hôpital de la Pitié-Salpétrière, 83 Boulevard de I'Hôpital, 75013 Paris, France.
2
Laboratoire de Biologie, Hôpital de la Pitié-Salpétrière, 83 Boulevard de I'Hôpital, 75013 Paris, France.
3
Département de Radiologie, Hôpital de la Pitié-Salpétrière, 83 Boulevard de I'Hôpital, 75013 Paris, France.
Abstract
Background: The aim of this prospective study was to assess whether the presence of septic shock
could influence the dose response to inhaled nitric oxide (NO) in NO-responding patients with adult
respiratory distress syndrome (ARDS).
Results: Eight patients with ARDS and without septic shock (PaO
2
= 95 ± 16 mmHg, PEEP = 0, FiO
2
= 1.0), and eight patients with ARDS and septic shock (PaO
2
= 88 ± 11 mmHg, PEEP = 0, FiO
2
=
1.0) receiving exclusively norepinephrine were studied. All responded to 15 ppm inhaled NO with an
increase in PaO
2
of at least 40 mmHg, at FiO
2
1.0 and PEEP 10 cmH
2
O. Inspiratory intratracheal NO
concentrations were recorded continuously using a fast response time chemiluminescence apparatus.
Seven inspiratory NO concentrations were randomly administered: 0.15, 0.45, 1.5, 4.5, 15, 45 and
150 ppm. In both groups, NO induced a dose-dependent decrease in mean pulmonary artery pressure
(MPAP), pulmonary vascular resistance index (PVRI), and venous admixture (Q
VA
/Q
T
), and a dose-
dependent increase in PaO
2
/FiO
2
(P ≤ 0.012). Dose-response of MPAP and PVRI were similar in both
groups with a plateau effect at 4.5 ppm. Dose-response of PaO
2
/FiO
2
was influenced by the presence
of septic shock. No plateau effect was observed in patients with septic shock and PaO
2
/FiO
2
increased by 173 ± 37% at 150 ppm. In patients without septic shock, an 82 ± 26% increase in PaO
2
/
FiO
2
was observed with a plateau effect obtained at 15 ppm. In both groups, dose-response curves
demonstrated a marked interindividual variability and in five patients pulmonary vascular effect and
improvement in arterial oxygenation were dissociated.
Conclusion: For similar NOinduced decreases in MPAP and PVRI in both groups, the increase in
arterial oxygenation was more marked in patients with septic shock.
Keywords: acute respiratory distress syndrome, inhaled nitric oxide, mechanical ventilation, pulmonary hypertension
Introduction
In patients with ARDS and acute pulmonary hypertension,
inhaled NO has been shown to selectively dilate pulmonary
vessels perfusing ventilated lung areas, and to improve
arterial oxygenation [1–9]. The `plateau' effect of NO on
pulmonary vascular resistance and gas exchange is
obtained at various concentrations ranging from 1-40 ppm
[2,4,6,7,9–11]. In the majority of patients, a major improve-
ment in arterial oxygenation can be obtained with NO con-
centrations < 5 ppm [4,9–11]. In addition, the degree of
response as well as the optimal NO dose varies both
between individuals and from day to day [11]. In sheep with
experimental acute lung injury receiving inhaled NO, a
dose-dependent increase in arterial oxygenations is found,
Received: 18 December 1996
Revisions requested: 26 February 1997
Revisions received: 19 April 1997
Accepted: 9 June 1997
Published: 13 August 1997
Crit Care 1997, 1:25
© 1997 Current Science Ltd
(Print ISSN 1364-8535; Online ISSN 1466-609X)
Critical Care Vol 1 No 1 Mourgeon et al.
with a plateau effect at NO concentrations of 30-60 ppm
[12,13]. Nitric oxide concentrations > 30 ppm may result in
elevated concentrations of nitrogen dioxide (NO
2
) and
methemoglobin particularly when 100% oxygen is adminis-
tered together with NO [9]. Because of the potential lung
toxicity of NO
2
, knowledge of the factors influencing the
optimal dose of inhaled NO in humans is of critical impor-
tance for intensivists. Recently, it has been suggested that
the presence of septic shock may decrease responsive-
ness to inhaled NO [14]: among 25 patients with ARDS
and septic shock, only 40% responded to inhaled NO with
an improvement in PaO
2
/FiO
2≥
20%. This proportion was
estimated as `abnormally low', although there are no pub-
lished data reporting the proportion of non-septic patients
with ARDS responding to inhaled NO by an increase in
PaO
2
/FiO
2
> 20%. In the present study, we hypothesized
that the presence of septic shock and the administration of
vasoconstrictors to patients with ARDS could modify the
dose-response to inhaled NO. We wanted to assess
whether in NO-responding patients with septic shock,
higher NO concentrations were required to obtain a pulmo-
nary effect similar to the one obtained in non-septic
patients. In addition, the effect of intravenous norepine-
phrine on an NO-induced decrease in pulmonary artery
pressure and increase in arterial oxygenation was investi-
gated. Therefore, dose–response studies were performed
on two groups of critically ill patients with and without sep-
tic shock whose lungs were mechanically ventilated for
ARDS. All patients enrolled were NO responders and
patients with septic shock were exclusively receiving intra-
venous norepinephrine for hemodynamic support.
Methods
Patients
During an 8 month period, 29 consecutive hypoxemic
patients with ARDS, diagnosed on or after admission to the
Surgical Intensive Care Unit (SICU) of La Pitié Hospital in
Paris (Department of Anesthesiology), were prospectively
screened at an early stage of their respiratory disease. Writ-
ten informed consent was obtained from the patient's next
of kin. The study was approved by the Comité Consultatif
de Protection des Personnes dans la Recherche Biomédi-
cale of La Pitié-Salpétrière Hospital.
Inclusion criteria were:
1. bilateral infiltrates on a bedside chest radiograph;
2. PaO
2
≤ 200 mmHg using an FiO
2
of 1.0 and zero end-
expiratory pressure (ZEEP);
3. bilateral and extensive hyperdensities on a high resolu-
tion spiral thoracic CT scan;
4. positive response to inhaled NO, defined as a decrease
in MPAP of at least 2 mmHg and an increase in PaO
2
(FiO
2
1.0, PEEP 10 cmH
2
O) of at least 40 mmHg after NO inha-
lation at an inspiratory concentration of 15 ppm.
These response criteria were fixed in order to select
patients responding to NO by a decrease in MPAP and an
increase in PaO
2
of sufficient magnitude to allow the deter-
mination of dose-response curves. It was considered that
when the variation of the parameter studied (either PaO
2
or
pulmonary artery pressure) was close or inferior to the pre-
cision of measurement, it was not possible to accurately
assess the dose-response.
Exclusion criteria were:
1. left ventricular failure, defined as a cardiac index ≤ 21/
min/m
2
associated with a pulmonary capillary wedge pres-
sure > 18 mmHg and/or a left ventricular ejection fraction
< 50% as estimated by bedside transesophageal
echocardiography;
2. circulatory shock requiring an exogenous catecholamine
other than norepinephrine, or characterized by spontane-
ous fluctuations of blood pressure despite a constant infu-
sion of norepinephrine;
3. cardiac dysrhythmias;
4. presence of a patent foramen ovale with a right-to-left
atrial shunt as assessed by pulsed-wave Doppler trans-
esophageal echocardiography.
These exclusion criteria were intended to eliminate patients
with cardiac failure, intracardiac shunt or cardiovascular
instability, in whom an accurate evaluation of dose-
response to inhaled NO would have been either difficult or
heavily biased [15]. Among the 29 patients initially
screened for inclusion, 13 had to be excluded (no response
to NO, n = 6; left ventricular failure, n = 4; circulatory shock
with an unstable arterial pressure, n = 2; atrial fibrillation, n
= 1). Finally, 16 patients fulfilling inclusion and exclusion
criteria were included. Eight patients were in septic shock
and eight patients had no septic shock. Diagnosis of septic
shock was made according to the criteria of the American
College of Chest Physicians/Society of Critical Care Med-
icine Consensus Conference [16], requiring: (1) a systemic
response to infection and (2) a systolic blood pressure <
90 mmHg despite adequate fluid resuscitation requiring
vasopressor agents. Adult respiratory distress syndrome
was diagnosed according to the recent American-Euro-
pean Consensus Conference [17] and its severity was
graded according to Murray et al[18].
Available online />Page 3 of 16
(page number not for citation purposes)
In each patient the trachea was orally intubated with a HiLo
Jet
TM
no 8 Mallinckrodt tube (Inc, Argyle, NY) which incor-
porates two side ports, one ending at the distal tip of the
endotracheal tube and a more proximal port ending 6 cm
from the tip. These additional channels were used for con-
tinuous monitoring of tracheal pressure and tracheal con-
centrations of inhaled NO. After inclusion in the study, all
patients were sedated and paralysed with a continuous
intravenous infusion of fentanyl 250 µg/h, flunitrazepam 1
mg/h and vecuronium 4 mg/h, and their lungs were venti-
lated using conventional mechanical ventilation (César
Ventilator, Taema, France). For each patient, tidal volume
and respiratory rate were adjusted to maintain constant
minute ventilation throughout the study. An inspiratory time
of 30%, a PEEP of 10 cmH
2
O and an FiO
2
of 0.85 were
maintained throughout the study period. FiO
2
was continu-
ously monitored, using an O
2
analyser (Sérès 4000 Aix-en-
Provence, France), in order to detect changes resulting
from the admixture of inspired gases with NO. All patients
were monitored using a fiberoptic thermodilution pulmo-
nary artery catheter (Oximetrix Opticath Catheter, Abbot
Critical Care System) and a radial or femoral arterial
catheter.
In order to accurately assess the extension of pulmonar
hyperdensities, and thereby the severity of ARDS patients
were transported to the Department of Radiology (Thoracic
Division) for a lung scan. The scan was performed from the
apex to the diaphragm using a Tomoscan SR 7000
(Philips, Eindhoven) and a semi-quantitative assessment of
parenchymal consolidation in ZEEP was performed
according to a technique previously described [4,5,8,9].
CT scans were obtained in all patients except patient 8
who could not be transported to the Department of Radiol-
ogy because of an unstable pelvic fracture.
Measurements
Systolic and diastolic arterial pressures (SAP and DAP),
and systolic and diastolic pulmonary arterial pressures
(SPAP and DPAP) were simultaneously measured using
the arterial cannula and the fiberoptic pulmonary artery
catheter connected to two calibrated pressure transducers
(91 DPT-308 Mallinckrodt) positioned at the midaxillary
line. Systemic and pulmonary arterial pressures, electrocar-
diogram (EKG), tracheal pressure (Paw) measured through
the distal port of the endotracheal tube, and gas flow and
tidal volume (V
T
) measured using a heated and calibrated
Hans Rudolph pneumotachograph, were simultaneously
and continuously recorded on a Gould ES 1000 recorder
(Gould Instruments, Cleveland, OH) throughout the entire
study period, at a paper speed of 1 mm/s.
In all patients, expired CO
2
was measured using a nonaspi-
rative calibrated 47210 A infrared capnometer (Hewlett
Packard) positioned between the proximal end of the
endotracheal tube and the Y piece of the ventilator. Expired
CO
2
curves were continuously recorded on the Gould ES
1000 recorder at a paper speed of 1 mm/s. After withdraw-
ing an arterial blood sample, the ratio of alveolar dead
space (VD
A
) to V
T
was calculated as:
VD
A
/V
T
= 1 – (P
ET
CO
2
/PaCO
2
)
where P
ET
CO
2
is end-tidal CO
2
measured at the plateau of
the expired CO
2
curve. Expired CO
2
curves were then
recorded at a paper speed of 50 mm/s, and only tracings
demonstrating a clear end-expiratory plateau, defined as a
constant CO
2
value for more than 0.5 s at end-expiration,
were used to determine P
ET
CO
2
. In patient 11, VD
A
/V
T
was
not calculated because no plateau could be identified on
the expired CO
2
curve. Because ARDS is associated with
abnormalities of the pulmonary vasculature (local thrombi
and pulmonary vasoconstriction at the early stage and vas-
cular remodeling at the late stage), VD
A
/V
T
can be consid-
ered as a better index of these vascular lesions than
physiologic dead space calculated by the Bohr equation
which takes into account the anatomic dead space [19].
In each phase (see experimental protocol), when a steady
state was obtained — defined as a leveling of the pulmonary
arterial pressure — SAP, DAP, SPAP, DPAP, pulmonary
capillary wedge pressure (PWP), right atrial pressure
(RAP), V
T
, Paw and gas flow were recorded at a paper
speed of 50 mm/s. Mean arterial pressure (MAP) was cal-
culated as 1/3 SAP + 2/3 DAP. Mean pulmonary artery
pressure was measured by planimetry as the mean of four
measurements performed at end-expiration. Systolic arte-
rial pressure, DAP, SPAP, DPAP, PWP and RAP were also
measured at end-expiration. Cardiac output was measured
using the thermodilution technique and a bedside compu-
ter allowing the recording of each thermodilution curve
(Oximetrix 3 SO
2
/CO Computer). Four serial 10 ml injec-
tions of 5% dextrose solution at room temperature were
performed at random during the respiratory cycle [20]. Sys-
temic and pulmonary arterial blood samples were simulta-
neously withdrawn within 1 min following cardiac output
measurements (after discarding an initial 10 ml heparin
contaminated aliquot). Arterial pH, PaO
2
, mixed venous
partial pressure of oxygen (PvO
2
) and PaCO
2
were meas-
ured using an IL BGE
TM
blood gas analyser. Hemoglobin
concentration, methemoglobin concentration, and arterial
and mixed venous oxygen saturations (SaO
2
and SvO
2
)
were measured using a calibrated OSM3 hemoximeter.
Arterial and mixed venous blood samples that showed
hemoglobin concentrations differing by more than 0.1 g/
100 ml were considered diluted, and the highest hemo-
globin concentration was used to calculate oxygen content.
Standard formulae were used to calculate cardiac index
(CI), PVRI, systemic vascular resistance index (SVRI), right
ventricular stroke work index (RVSWI), venous admixture
Critical Care Vol 1 No 1 Mourgeon et al.
(Q
VA
/Q
T
), arteriovenous oxygen difference [C(av)O
2
], oxy-
gen delivery (DO
2
), oxygen extraction ratio (EaO
2
) and oxy-
gen consumption (VO
2
).
In all patients, respiratory pressure-volume (P–V) curves
were measured using a 1 l syringe (Model Series 5540,
Hans Rudolph Inc, Kansas City, MO) according to a previ-
ously described technique [8]. Construction of inspiratory
and expiratory P–V curves allowed: determination of open-
ing pressure (Pop), static respiratory compliance (Crs) cal-
culated as the slope of the curve between 500-1000 ml,
and quasi-static respiratory compliance (Cqs), obtained by
dividing the V
T
by the corresponding airway pressure.
Opening pressure could be clearly identified in nine
patients and was always ≤ 10 cmH
2
O. A PEEP of 10
cmH
2
O was systematically applied to all patients.
Nitric oxide administration
Nitric oxide was released from three different tanks of nitro-
gen that had NO concentrations of 25, 900 and 2000 ppm,
measured using chemiluminescence (Air Liquide, France).
Nitric oxide was delivered into the inspiratory limb of the
ventilator just after the Fisher-Paykel humidifier, according
to a previously described technique [9]. With the aid of a
calibrated and heated pneumotachograph (Model Series
3500B, Hans Rudolph Inc, Kansas City, MO) attached to
the proximal end of the endotracheal tube, V
T
was reduced
to exactly compensate for the added volume of nitrogen
and NO coming from the tank. Thus, V
T
and minute ventila-
tion delivered to the patients were kept constant for all con-
centrations of inhaled NO.
Inspiratory, expiratory and mean concentrations of NO and
NO
2
were continuously measured using a fast response
time chemiluminescence apparatus (NOX 4000 Sérès, Aix-
en-Provence, France). Intratracheal gas was sampled by
continuous aspiration through the proximal side port of the
Mallinckrodt endotracheal tube, ie 162 cm from the site of
NO administration. The NOX 4000 is a chemiluminescence
apparatus specifically designed for medical use. When
using an aspiration flow rate of 150 ml/min, the response
time - defined as the time necessary to reach 95% of a ref-
erence NO concentration - is around 30 s and only mean
concentrations of NO can be accurately measured. When
an aspiration flow rate of 1000 ml/min is selected, the
response time is 0.765 ms and inspiratory and expiratory
NO concentrations can be accurately measured. In a previ-
ous study, we demonstrated that inspiratory and expiratory
concentrations of NO were adequately measured by the
NOX 4000 with a precision of 5% [9].
Table 1
Initial clinical characteristics of the 16 patients
Patients without septic shock
12345678
Age 2635676935255548
SAPS 17 9 171310101212
LISS 2.3 3 3 3 2.3 2.8 2.5 3
Outcome S S D D S S D S
Cause of ARDS BPN BPN BPN BPN Pulmonary
contusion
BPN Mesenteric
infarction
BPN
COPD NoNoYesNoNoNoYesNo
% of lung consolidation63517243556489nd
CT scan abnormalities BCLL BCLL BCLL BCLL BCLL + DPH BCLL + DPH DPH nd
Patients with septic shock
9 10111213141516
Age 1759614263476767
SAPS 6 8 10 16 5 7 10 14
LISS 22.83.531.822.82.5
Outcome SSDSSSSD
Cause of ARDS BPN BPN BPN Peritonitis Post CPB BPN BPN Septic shock
COPD NoYesNoNoNoNoNoYes
% of lung consolidation4972705057584948
CT scan abnormalities BCLL BCLL + DPH BCLL BCLL BCLL BCLL + DPH BCLL + DPH BCLL
S = survived; D = deceased; BPN = bronchopneumonia; LISS = lung injury severity score; SAPS = simplified acute physiologic score; ARDS =
acute respiratory distress syndrome; COPD = chronic obstructive pulmonary disease; nd = not determined (unstable spine fractures); BCLL =
bilateral consolidation of lower lobes; DPH = disseminated `patchy' hyperdensities; CPB = cardiopulmonary bypass.
Available online />Page 5 of 16
(page number not for citation purposes)
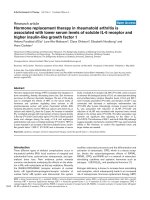
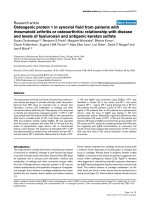
Figure 1
Comparative changes in (a) mean pulmonary artery pressure (∆MPAP)
and (b) pulmonary vascular resistance index (∆PVRI) induced by
increasing inspiratory intratracheal concentrations of inhaled NO (Insp
IT NO) in the presence (n = 8, ●) or absence (n = 8, ❍) of septic shock
in 16 patients with ARDS. Mean pulmonary artery pressure and PVRI
were measured: (1) before NO administration (C
1
); (2) following seven
randomized concentrations of NO between 0.15 and 150 ppm, and (3)
after the cessation of NO (C
2
). In both groups, NO induced a signifi-
cant and dose-dependent decrease in MPAP and PVRI (P< 0.01).
Change in MPAP and ∆ PVRI are expressed as percentage variation
from the control value. In both groups, a plateau effect was observed
for MPAP and PVRI from NO concentrations of 4.5 ppm. No interaction
between the factors `group' and `does of NO' was found using the two-
way analysis of variance, suggesting that the NO dose-response was
not affected by the presence of septic shock.
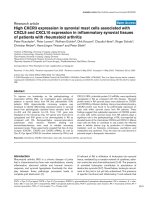
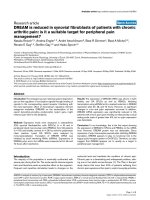
Figure 2
Changes in (a) PaO
2
/FiO
2
(∆ PaO
2
/FiO
2
and (b) venous admixture
(Q
VA
/Q
T
) induced by increasing inspiratory intratracheal concentrations
of inhaled NO (Insp IT NO) in the presence (n = 8, ●) or absence (n =
8, ❍) of septic shock in 16 patients with ARDS. PaO
2
/FiO
2
and Q
VA
/Q
T
were measured: (1) before NO administration (C
1
); (2) following seven
randomized concentrations of NO between 0.15 and 150 ppm, and (3)
after cessation of NO (C
2
). ∆ PaO
2
/FiO
2
and Q
VA
/Q
T
are expressed as
percentage variation from the control value. In both groups, NO
induced a significant and dose–dependent increase in PaO
2
/FiO
2
and
a decrease in Q
VA
/Q
T
(P< 0.01). In both groups, a plateau effect was
observed for the NO-induced decrease in Q
VA
/Q
T
from NO concentra-
tions of 1.5 ppm. In patients with septic shock, NO-induced increases
in PaO
2
did not show any plateau whereas in patients without septic
shock a plateau effect was observed from NO concentrations of 4.5
ppm. An interaction between the factors 'group' and 'dose of NO' was
found using the two-way analysis of variance (P = 0.035) suggesting
that the profile of the NO dose–response curve was affected by the
presence of septic shock.
Critical Care Vol 1 No 1 Mourgeon et al.
During the study, inspiratory and expiratory NO concentra-
tions were continuously measured and recorded after set-
ting the aspiration flow rate of the NOX 4000 at 1000 ml/
min. In addition, in steady state conditions, mean intratra-
cheal NO concentrations were measured by setting the
aspiration flow rate of the NOX 4000 at 150 ml/min. When
the aspiration flow rate was changed, the tidal volume set-
ting of the ventilator was modified accordingly in order to
achieve a constant minute ventilation and stable NO con-
centration. In order to increase precision, two different
operating ranges of measurement were used, depending
on the concentrations of NO administered to the patient: an
operating range of 0–5 ppm was selected for inspiratory
tracheal concentrations of 0.15, 0.45, 1.5 and 4.5 ppm,
and an operating range of 0–200 ppm for inspiratory tra-
cheal concentrations of 15, 45 and 150 ppm. When 0–5
ppm was selected, calibration was performed using a tank
of NO with a reference concentration of 0.945 ppm
(CFPO, Air Liquide, France); when 0–200 ppm was
selected, calibration was performed using a tank of NO
with a reference concentration of 22.8 ppm (CFPO, Air Liq-
uide, France). Nitrogen oxides (NOX) were calibrated using
the same reference tanks according to the manufacturer's
instructions. The oxygen analyser of the NOX 4000 was
used for continuous monitoring of oxygen concentration in
order to ensure that a constant FiO
2
was maintained during
NO inhalation, whatever the concentration administered.
Protocol
In each patient, the protocol consisted of three consecutive
phases. At each phase hemodynamic and respiratory
parameters were measured.
Phase 1: PEEP without NO (control 1)
Baseline measurements were made following a 1 h steady
state of conventional mechanical ventilation using the fol-
lowing ventilatory settings: FiO
2
0.85, PEEP 10 cmH
2
O,
inspiratory time 30%, respiratory frequency 16 ± 2 bpm, V
T
728 ± 32 ml.
Phase 2: PEEP 10 cm H
2
O with NO at increasing
inspiratory concentrations (dose–response curve)
Using the same ventilatory settings as in phase 1, seven
inspiratory tracheal concentrations of NO, chosen accord-
ing to a logarithmic scale, were randomly administered:
0.15, 0.45, 1.5, 4.5, 15, 45 and 150 ppm. Because con-
centrations of 45 and 150 ppm were associated with a
longlasting increase in blood methemoglobin concentra-
tion, which interfered with the calculation of venous and
arterial O
2
content and pulmonary shunt, they were not
included in the randomization, but were always adminis-
tered as the last concentrations. For each inspiratory
tracheal concentration of NO, expiratory and mean intratra-
cheal concentrations of NO were measured and recorded.
In addition, V
T
and FiO
2
were adjusted at the ventilator level
in order to maintain a constant minute ventilation and an
FiO
2
of 0.85 as assessed by the pneumotachograph and
the oxygen analyser. For each inspiratory NO
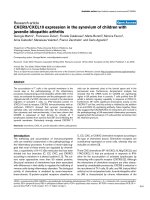
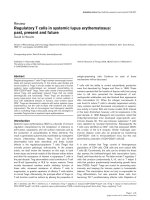
Figure 3
Comparative changes in (a) PaCO
2
(∆ PaCO
2
) and (b) alveolar dead
space (∆VD
A
/V
T
) induced by increasing inspiratory intratracheal con-
centrations of inhaled NO (Insp IT NO) in the presence (n = 7, filled cir-
cle) or absence (n = 8, ❍) of septic shock in 15 patients with ARDS.
PaCO
2
and VD
A
/V
T
were measured: (1) before NO administration (C
1
);
(2) following seven randomized concentrations of NO between 0.15
and 150 ppm, and (3) after the cessation of NO (C
2
). ∆ PaCO
2
and ∆
VD
A
/V
T
are expressed as percentage variation from the control value. In
each condition, minute ventilation was kept constant by adjusting the
tidal volume. In both groups, NO induced a decrease in PaCO
2
and VD
A
/V
T
which was statistically significant but dose-dependent in patients
who only had septic shock (P < 0.02).
Available online />Page 7 of 16
(page number not for citation purposes)
concentration, hemodynamic and respiratory measure-
ments were recorded after a 15 min steady state.
Phase 3: PEEP 10 cm H
2
O without NO (control 2)
At the end of a 1 h steady state following the discontinua-
tion of NO 150 ppm, hemodynamic and respiratory param-
aters were measured at the same ventilator settings as in
phase 1.
Statistical analysis
Cardiorespiratory parameters at control were compared
between groups using a Student's t-test for unpaired data.
The cardiorespiratory effects of NO were analysed in each
group using contrast analysis (control values were com-
pared with values obtained using graded concentrations of
NO). In both groups of patients, the existence of a dose-
related effect was investigated using a one-way analysis of
variance for repeated measures including only the different
concentrations of NO. Dose–response curves of NO on
hemodynamic and respiratory parameters in the presence
or absence of septic shock were analysed using a two-way
analysis of variance for one within and one grouping factor,
ie factor `group (absence or presence of septic shock)' and
factor `dose of NO'. Interaction between these two factors
allowed us to test the hypothesis that the effect of NO dif-
fered depending on the presence or absence of septic
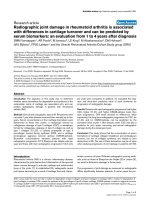
Figure 4
Individual changes in MPAP and PaO
2
/FiO
2
induced by increasing inspiratory intratracheal concentrations of inhaled NO (Insp IT NO) in eight
patients with ARDS and without septic shock. Mean pulmonary artery pressure was measured: (1) before NO administration (C
1
); (2) following
seven randomized concentrations of NO between 0.15 and 150 ppm, and (3) after the cessation of NO (C
2
). Changes are expressed as percentage
variation from C
1
(∆ MPAP and ∆ PaO
2
/FiO
2
) and each patient is represented by a different symbol with a number corresponding to the numbers
shown in Tables 1 and 2. In (a) and (b) patients without plateau effect on the dose–response curve are represented. In (c) and (d) patients with a
plateau effect on the MPAP dose–response curve and showing a deterioration of their PaO
2
/FiO
2
at the highest NO concentrations are
represented.
Critical Care Vol 1 No 1 Mourgeon et al.
shock. The significance level was fixed at 5%, but due to
the nature of the analysis of variance, we used the criterion
of Huynh and Feld rather than the classical F value [21].
Calculations were made using Super ANOVA statistical
software (Abanus Concepts, Inc). All values are expressed
as mean ± SEM.
Results
Patients
Among the 16 men enrolled in the study, eight were admit-
ted to the SICU following multiple trauma and eight follow-
ing postoperative complications after major surgical
procedures (vascular surgery, n = 1; cardiac surgery, n =
3; orthopedic surgery, n = 1; digestive surgery, n = 2; neu-
rosurgery, n = 1). Eight patients were in septic shock,
defined as the presence of an identified infectious foci
associated with arterial hypotension requiring the continu-
ous intravenous administration of norepinephrine [16].
Norepinephrine was administered in doses ranging
between 1 and 5 mg/h. All patients were studied at the
early phase of ARDS (first 5 days). As shown in Tables 1
and 2, all patients had ARDS characterized by arterial
hypoxemia, increased Q
VA
/Q
T
, pulmonary artery hyperten-
sion, reduced respiratory compliance, and consolidation of
lung parenchyma involving at least 45% of total lung vol-
ume. Initial clinical hemodynamic and respiratory parame-
ters were not statistically different between patients with
and without septic shock.
Figure 5
Individual changes in mean pulmonary artery pressure (MPAP) and PaO
2
/FiO
2
induced by increasing inspiratory intratracheal concentrations of
inhaled NO (Insp IT NO) in eight patients with ARDS and septic shock. MPAP was measured: (1) before NO administration (C
1
); (2) following seven
randomized concentrations of NO between 0.15 and 150 ppm, and (3) after the cessation of NO (C
2
). Changes are expressed as a percentage var-
iation from C
1
(∆ MPAP and ∆ PaO
2
/FiO
2
and each patient is represented by a different symbol with a number corresponding to the numbers shown
in Tables 1 and 2. In (a) and (b) patients without plateau effect on the dose-response curve are represented. In (c) and (d) patients with a plateau
effect on the MPAP dose-response curve and showing a deterioration of their PaO
2
/FiO
2
at the highest NO concentrations are represented.
Available online />Page 9 of 16
(page number not for citation purposes)
NO concentrations
Table 3 shows that inspiratory intratracheal NO concentra-
tions were 1.5–2 times greater than mean intratracheal NO
concentrations. Expiratory concentrations of NO progres-
sively increased with mean NO concentrations. For an
inspiratory NO concentration of 0.15 ppm, expired NO was
not detectable. For an inspiratory NO concentration of 0.45
ppm, expired NO could be measured in 15 patients. From
inspiratory NO concentrations of 1.5 ppm, expired NO
could be measured in all patients.
Table 2
Initial hemodynamic and respiratory characteristics of the 16 patients: intermittent positive pressure ventilation, ZEEP and FiO2= 1.0
Patients without septic shock
12345678Mean ± SEM
PaCO
2
(mmHg) 66 45 41 41 46 49 58 56 50 ± 3
VD
A
/V
T
(%) 392626351845463334 ± 4
PaO
2
(mmHg) 58 107 111 104 81 49 188 64 95 ± 16
Q
VA
/Q
T
(%) 534334294671365346 ± 5
Cqs (ml/cmH
2
O) 44 57 52 50 36 25 57 - 46 ± 4
Crs (ml/cmH
2
O) 50 56 55 82 29 19 84 58 54 ± 8
MPAP (mmHg) 21 31 20 43 27 28 19 36 28 ± 3
PVRI (dyn s/cm
5
m
2
) 168 265 443 1329 298 215 246 286 406 ± 135
PCWP (mmHg) 41163727106 ± 1
CI (l/min/m
2
) 8.3 6.1 2.6 2.4 5.3 9.7 3.9 7.2 5.7 ± 1
Patients with septic shock
9 10111213141516Mean ± SEM
PaCO
2
(mmHg) 55 56 56 57 39 44 33 50 48 ± 3
VD
A
/V
T
(%) 483833423323253935 ± 3
PaO
2
(mmHg) 130 68 59 57 145 106 88 77 88 ± 11
Q
VA
/Q
T
(%) 505350513643414047 ± 2
Cqs (ml/cmH
2
O) 43 58 30 26 83 52 39 59 49 ± 6
Crs (ml/cmH
2
O) 50 56 48 39 77 57 57 59 56 ± 4
MPAP (mmHg) 24 37 45 31 21 39 27 27 32 ± 3
PVRI (dyn s/cm
5
m
2
) 399 590 489 377 360 471 321 652 442 ± 40
PWP (mmHg) 4141351091449 ± 1
CI (l/min/m
2
) 3.9 3.1 5.3 5.4 2.4 5.1 3.3 2.9 4.3 ± 1
VD
A
/V
T
= alveolar dead space; Q
VA
/Q
T
= venous admixture; Cqs = quasi-static respiratory compliance; Crs = respiratory compliance (slope of the
P-V curve above the lower inflection point); MPAP = mean pulmonary arterial pressure; PVRI = pulmonary vascular resistance index; PCWP =
pulmonary capillary wedge pressure; CI = cardiac index.
Table 3
Mean (FNO), inspiratory (FINO) and expiratory (FENO) intratracheal NO concentrations, mean NO2 intratracheal concentrations and
methemoglobin (MetHb) blood levels measured in 16 patients with ARDS receiving increasing concentrations of inhaled NO at FiO2 0.85
NO (ppm)
0.15 0.45 1.5 4.5 15 45 150
FNO (ppm) 0.102 ± 0.004 0.32 ± 0.011 1.05 ± 0.02 2.98 ± 0.06 10.4 ± 0.2 26 ± 0.8 100 ± 4
FINO (ppm) 0.15 ± 0.006 0.45 ± 0.073 1.5 ± 0.2 4.5 ± 0.3 15.3 ± 1.2 45.2 ± 0.9 nd
FENO (ppm) 0.004 ± 0.0005 0.1 ± 0.02 0.6 ± 0.05 1.95 ± 0.1 6 ± 0.2 17 ± 0.9 nd
NO
2
(ppm) 0.02 ± 0.004 0.03 ± 0.01 0.03 ± 0.01 0.06 ± 0.02 0.3 ± 0.1 0.8 ± 0.3 4 ± 0.9
MetHb (%) 0.9 ± 0.1 1 ± 0.1 0.9 ± 0.1 0.9 ± 0.1 1 ± 0.1 1.4 ± 0.2 3.8 ± 0.5
Values are given as mean ± SEM. nd = not determined.
Critical Care Vol 1 No 1 Mourgeon et al.
Hemodynamic and respiratory effects of NO in patients
without septic shock
As shown in Tables 4 and 5, NO induced a significant
dose-dependent decrease in MPAP, SPAP, DPAP,
PVRI,RVSWI and Q
VA
/Q
T
with a significant and dose-
dependent increase in PaO
2
/FiO
2
. As shown in Figs 1,2,3,
a plateau effect was observed at inspiratory NO concentra-
tions of 4.5 ppm for MPAP, PVRI, Q
VA
/Q
T
and PaO
2
/FiO
2
.
All other hemodynamic and respiratory parameters did not
vary significantly. Hemodynamic and respiratory parame-
ters returned to control values after the cessation of inhaled
NO.
Hemodynamic and respiratory effects of NO in patients
with septic shock
Hemodynamic and respiratory effects of increasing inspira-
tory concentrations of NO in patients with septic shock are
summarized in Tables 6 and 7. A significant dose-depend-
ent decrease in SPAP, DPAP, MPAP, PVRI, RVSWI,
PaCO
2
, VD
A
/V
T
and Q
VA
/Q
T
and a significant dose-
dependent increase in PaO
2
/FiO
2
were observed. The
maximum decrease in mean PVRI, PaCO
2
and VD
A
/V
T
was
obtained for an inspiratory NO concentration of 4.5 ppm
(Fig 3). The maximum increase in PaO
2
/FiO
2
was obtained
for an inspiratory NO concentration of 150 ppm (Figs 1 and
2). All other hemodynamic and respiratory parameters did
not vary significantly. Hemodynamic and respiratory param-
eters returned to control values after the cessation of NO
inhalation.
Table 4
Hemodynamic effects of increasing inspiratory concentrations of inhaled NO in eight patients with ARDS and without septic shock
NO (ppm)
Control 1 0.15 0.45 1.5 4.5 15 45 150 Control 2 P value
*
SPAP (mmHg) 45 ± 5 38 ± 5 37 ± 5 35 ± 4 36 ± 5 34 ± 5 33 ± 4 33 ± 4 43 ± 5 0.0001
DPAP (mmHg) 19 ± 2 17 ± 3 16 ± 2 15 ± 2 16 ± 2 15 ± 2 16 ± 2 15 ± 2 19 ± 2 0.0001
MPAP (mmHg) 29 ± 3 25 ± 3 24 ± 3 24 ± 3 24 ± 3 23 ± 3 23 ± 3 23 ± 3 28 ± 4 0.0001
PVRI (dyn s/cm
5
m
2
) 431 ± 105 383 ± 94 345 ± 90 340 ± 82 338 ± 85 321 ± 74 311 ± 83 305 ± 77 438 ± 122 0.0001
HR (beats/min) 94 ± 6 89 ± 6 88 ± 6 88 ± 7 90 ± 6 91 ± 6 88 ± 6 90 ± 6 90 ± 7 0.3188
CI (l/min/m
2
) 4.3 ± 0.5 4 ± 0.4 4.2 ± 0.5 4.1 ± 0.5 4.1 ± 0.5 4.3 ± 0.5 4.2 ± 0.5 4.2 ± 0.5 4.1 ± 0.5 0.8806
RVSWI (g/m
2
) 13 ± 1 11 ± 1 11 ± 1 11 ± 1 10 ± 1 10 ± 1 10 ± 1 10 ± 1 13 ± 1 0.0001
RAP (mmHg) 7 ± 2 7 ± 1 8 ± 2 7 ± 1 7 ± 2 7 ± 1 7 ± 2 7 ± 2 7 ± 2 0.8382
PCWP (mmHg) 9 ± 2 8 ± 1 8 ± 2 8 ± 1 9 ± 1 8 ± 1 9 ± 1 9 ± 2 9 ± 1 0.1125
MAP (mmHg) 84 ± 4 76 ± 6 79 ± 3 81 ± 4 86 ± 3 82 ± 3 83 ± 4 83 ± 5 81 ± 5 0.1603
SVRI (dyn s/cm
5
m
2
) 1589 ±
215
1432 ±
198
1499 ±
201
1601 ±
224
1720 ±
229
1563 ±
195
1653 ±
247
1651 ±
240
1631 ±
239
0.1339
NO = nitric oxide; SPAP = systolic pulmonary arterial pressure; DPAP = diastolic pulmonary arterial pressure; MPAP = mean pulmonary arterial
pressure; PVRI = pulmonary vascular resistance index; HR = heart rate; CI = cardiac index; RVSWI = right ventricular stroke work index; RAP =
right atrial pressure; PCWP = pulmonary capillary wedge pressure; MAP = mean arterial pressure; SVRI = systemic vascular resistance index.
Values are given as mean ± SEM.
*
P value for the one-way analysis of variance (dose–response curve).
Available online />Page 11 of 16
(page number not for citation purposes)
Effects of septic shock on dose–response curves
At control, hemodynamic and respiratory parameters were
the same for both groups. Dose-response curves of inhaled
NO for MPAP, PVRI, RVSWI, PaCO
2
and Q
VA
/Q
T
were not
significantly different between patients with and without
septic shock (Figs 1,3,3). As shown in Fig 2, the effect of
inhaled NO on PaO
2
/FiO
2
was significantly increased by
the presence of septic shock. In patients with septic shock,
inhaled NO increased PaO
2
/FiO
2
by 190%, the maximum
effect being obtained at an inspiratory NO concentration of
150 ppm. In patients without septic shock, inhaled NO
increased PaO
2
/FiO
2
by 81%, the maximum effect being
obtained at an inspiratory NO concentration of 4.5 ppm.
Using a two-way analysis of variance, a significant interac-
tion was found for the factor group (P = 0.047).
Individual variability of dose–response curves
As shown in Figs 4 and 5, dose-response curves demon-
strated marked variability between individuals. In patients
without septic shock, the decrease in MPAP varied from 11
to 45% whereas the increase in PaO
2
/FiO
2
varied from 30
to 220% (Fig 4). In five patients a clear plateau could be
identified for the decrease in MPAP (Fig 4c), whereas
MPAP continued to decrease with higher NO concentra-
tions in three (Fig 4a). Different patterns were observed for
PaO
2
/FiO
2
: in four patients the PaO
2
/FiO
2
ratio deterio-
rated at the highest inspiratory NO concentrations (Fig 4d),
whereas in the other four PaO
2
/FiO
2
continued to increase
(Fig 4b). The patients whose PaO
2
/FiO
2
ratio continued to
increase with the highest NO concentrations demonstrated
a clear plateau effect in MPAP at NO concentrations of 4.5
ppm suggesting that the effects of NO on gas exchange
and pulmonary circulation can be dissociated. In patients
with septic shock (Fig 5), the decrease in MPAP varied
from 8 to 32% whereas the increase in PaO
2
varied from
60 to 380%. In five patients, a clear plateau could be iden-
tified on the dose-response curve of MPAP (Fig cc)
whereas it continued to decrease with higher NO concen-
trations in three (Fig 4a). In two patients, PaO
2
/FiO
2
dete-
riorated at the highest inspiratory NO concentrations (Fig
5d) whereas in the other six, PaO
2
/FiO
2
continued to
increase (Fig 5b). As observed in patients without septic
shock, the effects of NO on arterial oxygenation and pulmo-
nary artery pressure were dissociated. In two patients only
(patients 10 and 11), dose-response curves were charac-
terized by a concurrent dose-dependent decrease in MPAP
and an increase in PaO
2
/FiO
2
in the range of 0.15 to 150
ppm inhaled NO.
Toxic effects of increasing concentrations of inhaled NO
As shown in Table 3, methemoglobin and NO
2
significantly
increased at inspiratory NO concentrations of 15 ppm. A
Table 5
Respiratory effects of increasing inspiratory concentrations of inhaled NO in eight patients with ARDS and without septic shock
NO (ppm)
Control 1 0.15 0.45 1.5 4.5 15 45 150 Control 2 P value
*
PaO
2
/FiO
2
(mmHg) 162 ± 23 221 ± 27 220 ± 26 245 ± 27 261 ± 31 275 ± 28 278 ± 30 290 ± 48 177 ± 28 0.0001
Q
VA
/Q
T
(%) 33 ± 3 29 ± 1 30 ± 2 27 ± 2 27 ± 2 27 ± 2 27 ± 2 28 ± 4 33 ± 3 0.0122
SvO
2
(%) 65 ± 3 67 ± 3 68 ± 4 66 ± 3 68 ± 3 70 ± 3 70 ± 3 67 ± 3 65 ± 4 0.1753
DO
2
(ml/min/m
2
) 440 ± 45 427 ± 38 446 ± 43 441 ± 48 435 ± 44 452 ± 43 441 ± 44 433 ± 47 422 ± 49 0.9511
VO
2
(ml/min/m
2
) 146 ± 9 141 ± 11 142 ± 10 147 ± 11 138 ± 10 137 ± 6 134 ± 10 144 ± 12 140 ± 12 0.4556
PaCO
2
(mmHg) 43 ± 2 41 ± 2 41 ± 2 41 ± 2 41 ± 2 42 ± 2 42 ± 2 43 ± 2 43 ± 2 0.1204
P
ET
CO
2
(mmHg) 30 ± 1 29 ± 2 29 ± 2 30 ± 2 30 ± 2 29 ± 2 30 ± 2 30 ± 2 29 ± 2 0.6522
VD
A
/V
T
(%) 31 ± 3 29 ± 4 30 ± 4 27 ± 3 27 ± 4 30 ± 3 30 ± 4 29 ± 4 33 ± 3 0.2898
Q
VA
/Q
T
= venous admixture; SvO
2
= mixed venous oxygen saturation; VO
2
= oxygen consumption; DO
2
= oxygen delivery; P
ET
CO
2
= end tidal
CO
2
; VD
A
/V
T
= alveolar dead space. Values are given as mean ± SEM.
*
P value for the one-way analysis of variance (dose-response curve).
Critical Care Vol 1 No 1 Mourgeon et al.
mean intratracheal NO
2
concentration of 4 ± 0.9 ppm and
a mean methemoglobin concentration of 3.8 ± 0.5% were
observed at an inspiratory NO concentration of 150 ppm.
Discussion
The main results of this study can be summarised as
follows:
1. the dose-response relationship between inhaled NO and
pulmonary vascular effects is not influenced by the pres-
ence of septic shock in patients with ARDS;
2. pulmonary vascular and gas exchange effects are fre-
quently dissociated;
3. for the same pulmonary vascular effect, inhaled NO-
induced improvement in arterial oxygenation is of greater
magnitude in patients with ARDS and septic shock receiv-
ing norepinephrine;
4. dose–response curves are characterized by a wide vari-
ability between patients, although for most, 90% of the
maximum effect is obtained with NO concentrations ≤ 4.5
ppm. This latter result is in accordance with five recent
studies demonstrating a plateau effect at inspiratory NO
concentrations < 10 ppm [4,9–11,22].
Factors influencing individual dose–response curves
During mechanical ventilation, intratracheal NO concentra-
tions fluctuate according to the phase of respiration [9], the
Table 6
Hemodynamic effects of increasing inspiratory concentrations of inhaled NO in eight patients with ARDS and with septic shock
NO (ppm)
Control 1 0.15 0.45 1.5 4.5 15 45 150 Control 2 P value
*
SPAP (mmHg) 48± 5 43± 5 42± 4 40± 4 39± 3 38± 3 36± 3 36± 3 48± 4 0.0001
DPAP (mmHg) 23± 2 19± 2 20± 2 19± 2 18± 2 18± 2 17± 2 17± 2 22± 2 0.0001
MPAP (mmHg) 32± 3 28± 3 28± 3 27± 3 26± 3 26± 2 24± 2 24± 2 31± 3 0.0001
PVRI (dyn s/cm
5
m
2
) 513± 60 395± 39 399± 37 383± 45 352± 35 355± 27 351± 25 362± 33 484± 50 0.0001
HR (/min) 91± 8 89± 9 91± 8 95± 8 90± 9 89± 9 89± 7 89± 8 93± 7 0.5331
CI (I/min/m
2
) 3.3± 0.3 3.3± 0.3 3.2± 0.3 3.5± 0.3 3.3± 0.3 3.2± 0.3 3.2± 0.3 3.1± 0.3 3.2± 0.3 0.2356
RVSWI (g/m
2
11± 2 10± 2 10± 2 9± 2 9± 2 8± 1 8± 1 7± 1 10± 2 0.0003
RAP (mmHg) 10± 2 10± 2 10± 2 9± 2 10± 2 10± 2 9± 2 9± 1 10± 2 0.2142
PCWP (mmHg) 11± 2 11± 1 12± 2 11± 2 11± 2 12± 2 11± 2 10± 2 11± 2 0.4322
MAP (mmHg) 74± 5 75± 3 78± 5 77± 3 79± 4 74± 3 73± 4 73± 4 75± 4 0.3197
SVRI (dyn s/
cm
5
m
2
)
1709±
236
1685±
187
1767±
177
1695±
184
1827±
258
1705±
170
1731±
219
1788±
279
1698±
163
0.8766
NO = nitric oxide; SPAP = systolic pulmonary arterial pressure; DPAP = diastolic pulmonary arterial pressure; MPAP = mean pulmonary arterial
pressure; PVRI = pulmonary vascular resistance index; HR = heart rate; CI = cardiac index; RVSWI = right ventricular stroke work index; RAP =
right aterial pressure; PCWP = pulmonary capillary wedge pressure; MAP = mean arterial pressure; SVRI = systemic vascular resistance index.
Values are given as mean ± SEM.
*
P value for the one-way analysis of variance (dose-response curve).
Available online />Page 13 of 16
(page number not for citation purposes)
inspiratory concentration being greater than the expiratory
concentration because NO is absorbed at the alveolar
level. In the present study, NO concentrations delivered to
the patient were determined by sampling the endotracheal
gas using a fast response chemiluminescence apparatus in
order to accurately measure inspiratory NO concentration
[9]. If used, slow response chemiluminescence would have
underestimated the true inspiratory NO concentration by
averaging it together with the expiratory level, as probably
occurred in two of our previous studies [4,23]. Another rea-
son for determining the inspiratory NO concentration in this
way was the method of NO administration used. Continu-
ous administration of NO through the initial part of the
inspiratory limb during volume controlled ventilation
invariably results in fluctuation of the NO concentration
within the inspiratory limb due to a 'bolus' effect [24,25].
Although mixing of NO increases with distance from the
site of administration [24], a fast response analyser is
required to accurately measure the peak NO concentration
during the inspiratory phase. We previously demonstrated
in an in vitro experiment, that the NOX 4000 was able to
measure rapid fluctuations of NO concentrations with a
precision ≥ 95% [9].
In the present study, two different patterns of dose-
response curves were observed. In 10 patients (five in each
group) a plateau effect for MPAP could be identified at NO
concentrations ranging between 0.45 and 4.5 ppm. In six
patients (three in each group) MPAP continued to
decrease with the highest NO concentrations (Figs 4 and
5). These different variation profiles did not appear to be
related to the presence of septic shock.
Although the mean pulmonary vascular effect of inhaled
NO was not affected by the presence of septic shock, the
resulting improvement in arterial oxygenation was of a
greater magnitude in patients with septic shock (Fig 2). The
reasons for this difference are not clear. It can be hypothe-
sized that the same degree of inhaled NO-induced vasodi-
lation of the pulmonary vessels perfusing ventilated lung
areas resulted in a greater redistribution of pulmonary
blood flow in patients with septic shock. This implies that
for the same extent of lung consolidation, basal pulmonary
blood flow perfusing non-ventilated lung areas was greater
in patients with septic shock. As a matter of fact, although
the percentage of lung consolidation tended to be greater
in patients without septic shock (63 vs 57%), their mean
PaO
2
tended to be higher (95 ± 16 vs 88 ± 11 mmHg),
suggesting some degree of hypoxic pulmonary vasocon-
striction impairment in the non-ventilated lung areas of
patients with septic shock. It is well known that acute lung
infection and septic shock may impair hypoxic pulmonary
Table 7
Respiratory effects of increasing inspiratory concentrations of inhaled NO in eight patients with ARDS and with septic shock
NO (ppm)
Control 1 0.15 0.45 1.5 4.5 15 45 150 Control 2 P value
*
PaO
2
/FiO
2
(mmHg) 128± 18 199± 20 229± 25 232± 28 255± 23 270± 18 283± 24 313± 23 148± 21 0.0001
Q
VA
/Q
T
(%) 37± 2 32± 2 30± 1 29± 1 29± 1 27± 1 29± 1 29± 3 35± 1 0.0001
S
V
O
2
(%) 67± 4 72± 2 73± 2 73± 3 74± 3 74± 3 74± 2 73± 3 69± 3 0.0012
DO
2
(ml/min/m
2
) 416± 38 425± 31 437± 40 455± 41 430± 25 420± 29 417± 35 407± 35 413± 31 0.315
VO
2
(ml/min/m
2
) 126± 13 113± 10 114± 9 124± 16 110± 11 114± 12 109± 9 118± 18 121± 11 0.2372
PaCO
2
(mmHg) 44± 3 43± 3 42± 2 41± 3 41± 2 41± 3 41± 2 42± 3 43± 2 0.0114
P
ET
CO
2
(mmHg) 30± 2 31± 2 31± 2 30± 2 30± 2 31± 2 30± 2 32± 3 30± 2 0.0829
VD
A
/V
T
(%) 30± 4 25± 3 25± 3 24± 4 24± 4 24± 4 25± 4 23± 5 28± 4 0.0008
Q
VA
/Q
T
= venous admixture; S
V
O
2
= mixed venous oxygen saturation; VO
2
= oxygen consumption; DO
2
= oxygen delivery; P
ET
CO
2
= end tidal
CO
2
; VD
A
/V
T
= alveolar dead space Values are given as mean ± SEM.
*
P value for the one-way analysis of variance (dose-response curve).
Critical Care Vol 1 No 1 Mourgeon et al.
vasoconstriction through the massive release from acti-
vated endothelium of vasodilating mediators such as pros-
taglandins and endogenous NO, and hence result in
disproportionately high shunting and hypoxemia [26–32].
In addition, exogenous catecholamines, used to maintain
arterial pressure during septic shock, interfere with hypoxic
pulmonary vasoconstriction: vasodilators like isoproterenol
or dobutamine tend to inhibit hypoxic pulmonary vasocon-
striction whereas vasoconstrictors like dopamine, epine-
phrine or norepinephrine tend to reinforce hypoxic
pulmonary vasoconstriction. In the present study, patients
with circulatory shock receiving vasodilating inotrops were
excluded in order to eliminate the interferences between
these agents, inhaled NO and hypoxic pulmonary
vasoconstriction.
Confirming a previous study [11], an important interpatient
variability was found in both groups of patients (Figs 4 and
5). Several factors may account for this variability: at the
time of investigation, endogenous vasoconstricting media-
tors involved in pulmonary artery hypertension were
probably different between patients. In animal studies, NO
dose–response curves depend on the model of acute lung
injury and on the pathophysiology of pulmonary artery
hypertension [33–35]. In patients treated with extracorpor-
eal membrane oxygenation, dose–response curves of
inhaled NO on MPAP have been found to be in the range
of 1–100 ppm [2]. It has been suggested that pulmonary
vasoconstrictors are continuously activated by the extracor-
poreal circuit and released into the circulation, thus contrib-
uting to pulmonary hypertension [36–39]. Therefore, it is
conceivable that higher concentrations of NO are neces-
sary to obtain the maximum effect of NO on pulmonary
artery pressure. In the present study, dose-response curves
in the range of 0.15 to 150 ppm were observed in three
patients without septic shock and in three patients with
septic shock. By analogy with the dose-response curves
obtained in patients on extracorporeal membrane oxygena-
tion, it can be hypothesized that the presence of large
amounts of circulating pulmonary vasoconstrictors in these
patients led to the need for greater NO concentrations. The
variability of circulating vasoactive mediators from one day
to another has been recently advocated to explain the vari-
ability of the dose-response to NO on different days in the
same patient [11].
There are three factors that could have a potential influence
on the responsiveness of patients with ARDS to inhaled
NO: (1) the anatomical remodeling of the pulmonary
circulation; (2) the reduction of the lung volume accessible
to gas, and (3) the presence of septic shock.
External compression of the pulmonary vessels by PEEP,
thickening of pulmonary arterial walls observed in the late
stage of ARDS, and thrombosis [40] contribute to further
increase pulmonary artery pressure which becomes less
and less sensitive to inhaled NO. If the alveolar space avail-
able for distribution of NO is reduced, only a small number
of pulmonary vessels can be reached, thus limiting the
efficiency of NO. Because all patients were enrolled in the
study during the first 5 days of acute respiratory failure, it is
unlikely that wall thickening was an important limiting factor
of NO efficiency. However, a major reduction in lung vol-
ume was likely to account for the limited effect of NO
observed in some patients with lung consolidation > 70%
(patients 3, 7 and 10 in Figs 4 and 5). Recently, it has been
suggested that the presence of septic shock may impair
responsiveness to inhaled NO [14]. However, due to the
small number of patients included in this study and the
absence of a control group, further studies are required to
confirm this interesting hypothesis.
Finally, the maximum pulmonary vascular effect and the
dose–response of inhaled NO on pulmonary artery pres-
sure depends on many diverse factors that may be associ-
ated in a given patient: type and concentration of circulating
pulmonary vasoconstrictors and vasodilators (endogenous
and exogenous); relative importance of 'fixed' and 'nonfixed'
components of pulmonary artery hypertension; and loss of
lung volume. The results of the present study show that dur-
ing the early stage of ARDS, inspiratory NO concentrations
around 5 ppm provide the maximum decrease in pulmonary
artery pressure in the majority of patients whereas higher
concentrations are necessary in a minority of patients.
Dissociation between pulmonary vascular effects and
effects on gas exchange
Quantitatively, the effects of NO on pulmonary artery pres-
sure and arterial oxygenation were well correlated in 75%
of patients. In 11 subjects (patients 5 to 8 and 10 to 16)
quantitative variations in PaO
2
and pulmonary artery pres-
sure were in agreement: a decrease in MPAP > 20% of the
control value was associated with an increase in PaO
2
/
FiO
2
> 130% of the control value and vice versa. In five
subjects (patients 1 to 4 and patient 9) inhaled NO-induced
changes in MPAP and PaO
2
/FiO
2
were quantitatively dis-
sociated. Patient 9 illustrates this (Fig 5) — although among
patients with septic shock he had the greatest NO-induced
decrease in MPAP, his PaO
2
/FiO
2
ratio only increased by
70%. These results clearly suggest that, although linked,
NO-induced pulmonary vascular effects and effects on
arterial oxygenation can be dissociated in patients with
ARDS. In patients with septic shock, pulmonary arterial
pressure plateaued at 15 ppm whereas PaO
2
/FiO
2
contin-
ued to increase at higher NO concentrations. This is in
apparent contrast with two previous dose-response studies
showing that the increase in PaO
2
in patients with ARDS
generally occurs at an inspiratory NO concentration range
lower than the one necessary to decrease pulmonary artery
pressure [2,11]. Further, undetectable changes in
Available online />Page 15 of 16
(page number not for citation purposes)
pulmonary artery pressure may induce pulmonary blood
flow redistribution and changes in arterial oxygenation
[2,3,11]. Recently, however, Lowson et al[10] found, as did
this study, that PaO
2
continued to increase whereas pul-
monary artery pressure and pulmonary vascular resistance
plateaued at NO concentrations > 0.1 ppm. In fact, among
six dose-response studies already published [2,4,9–11,22]
only two [2,11] have suggested that NO concentrations
required to improve PaO
2
are less than those required to
decrease pulmonary artery pressure. At high concentra-
tions, it may be that NO reaches pulmonary vessels perfus-
ing non-ventilated lung areas and worsens arterial
oxygenation by inhibiting hypoxic pulmonary
vasoconstriction as observed in patients 1, 2, 6, 8 and 15.
This 'spillover' of NO into the pulmonary circulation could
occur either by diffusion through the lung structures or
directly by transportation in the blood stream [41].
In conclusion, in patients with ARDS the presence of septic
shock treated by norepinephrine administration does not
modify the inhaled NO-induced pulmonary artery vascular
effect but amplifies the resulting improvement in arterial
oxygenation. Although dose–response curves are
characterized by a wide inter-patient variability, 90% of the
pulmonary vascular effect is obtained for NO concentra-
tions ≤ 4.5 ppm in patients with or without septic shock.
The use of such low concentrations precludes any potential
toxicity due to the generation of high concentrations of NO
2
and methemoglobin. In many patients, the pulmonary vas-
cular effect and effect on gas exchange, although linked,
are dissociated suggesting that redistribution of pulmonary
blood flow does not exclusively depend on the intensity of
the pulmonary vasodilating effect. In a minority of patients,
inspiratory NO concentrations > 5 ppm may be necessary
to obtain the maximum improvement in arterial oxygenation.
Acknowledgements
The authors thank Dr Liliane Bodin, Dr Pierre Kalfon and Dr Pascale
Poète for their contribution to the study; the nurses of the Surgical Inten-
sive Care Unit and the technicians of the Department of Radiology for
their active participation; E Vicaut for his statistical advice; and Véro-
nique Connan for her secretarial assistance in preparing the manuscript.
This paper was presented in part at the 36th Congrès National
d'Anesthésie et de Réanimation, Paris, France, 30 September–2
October 1994 and at the third congress of the European Society of
Anaesthesiologists, Paris, France, 29 April–3 May 1995.
References
1. Rossaint R, Falke KJ, Lopez F, Slama K, Pison U, Zapol ZM:
Inhaled nitric oxide for the adult respiratory distress
syndrome. N Engl J Med 1993, 328:399-405.
2. Gerlach H, Rossaint R, Pappert D, Falke KJ: Time-course and
dose-response of nitric oxide inhalation for systemic oxygen-
ation and pulmonary hypertension in patients with adult respi-
ratory distress syndrome. Eur J Clin Invest 1993, 23:499-502.
3. Gerlach H, Pappert D, Lewandowski K, Rossaint R, Falke KJ:
Long-term inhalation with evaluated low doses of nitric oxide
for selective improvement in oxygenation in patients with
adult respiratory distress syndrome. Intensive Care Med 1993,
19:443-449.
4. Puybasset L, Rouby JJ, Mourgeon E: Inhaled nitric oxide in acute
respiratory failure: dose–response curves. Intensive Care Med
1994, 20:319-327.
5. Puybasset L, Stewart T, Rouby JJ: Inhaled nitric oxide reverses
the increase in pulmonary vascular resistance induced by per-
missive hypercapnia in patients with ARDS. Anesthesiology
1994, 80:1254-1267.
6. Bigatello LM, Huford WE, Kacmarek RM, Roberts JD, Zapol ZM:
Prolonged inhalation of low concentrations of nitric oxide in
patients with adult respiratory distress syndrome. Anesthesiol-
ogy 1994, 80:761-770.
7. Young JD, Brampton WJ, Knighton JD, Finfer SR: Inhaled nitric
oxide in acute respiratory failure in adults. Br J Anaesth 1994,
73:499-502.
8. Puybasset L, Rouby JJ, Mourgeon E: Factors influencing cardiop-
ulmonary effects of inhaled nitric oxide in acute respiratory
failure. Am J Respir Crit Care Med 1995, 152:318-328.
9. Lu Q, Mourgeon E, Law-Koune JD: Dose-response curves of
inhaled nitric oxide with and without almitrine in nitric oxide
responding patients with acute respiratory distress syndrome.
Anesthesiology 1995, 83:929-943.
10. Lowson S, Rich MGF, Mc Ardle PA, Jaidev J, Morris GN: The
response to varying concentrations of inhaled nitric oxide in
patients with acute respiratory distress syndrome. Anesth
Analg 1996, 82:574-581.
11. Lundin S, Westfelt UN, Stenqvist O: Response to nitric oxide
inhalation in early acute lung injury. Intensive Care Med 1996,
22:728-734.
12. Dyar O, Young JD, Xiong L, Howell S, Johns E: Dose–response
relationship for inhaled nitric oxide in experimental pulmonary
hypertension in sheep. Br J Anaesth 1993, 71:702-708.
13. Rovira I, Chen TY, Winkler M, Kawai N, Bloch ZD, Zapol WM:
Effects of inhaled nitric oxide on pulmonary hemodynamics
and gas exchange in an ovine model of ARDS. J Appl Physiol
1994, 76:345-355.
14. Krafft P, Fridrich P, Fitzgerald RD, Koc D, Steltzer H: Effective-
ness of nitric oxide inhalation in septic ARDS. Chest 1996,
109:486-493.
15. Fellahi JL, Mourgeon E, Goarin JP: Inhaled nitric oxide-induced
closure of a patent foramen ovale in a patient with acute res-
piratory distress syndrome and life-threatening hypoxemia.
Anesthesiology 1995, 83:635-638.
16. American COllege of Chest Physicians/Society of Critical Care
Medicine Consensus Conference : Definition for sepsis and
organ failure and guidelines for the use of innovative thera-
pies in sepsis. Crit Care Med 1992, 20:864-874.
17. Bernard GR, Artigas A, Brigham KL: Report of the American-
European Consensus Conference on acute respiratory dis-
tress syndrome: definitions, mechanisms, relevant outcomes
and clinical trial coordination. J Crit Care 1994, 9:72-81.
18. Murray JF, Matthay MA, Luce JM, Fick MR: An expanded defini-
tion of the adult respiratory distress syndrome. Am Rev Respir
Dis 1988, 138:720-723.
19. Fletcher R, Jonson B, Cumming G, Brew J: The concept of dead
space with special reference to the single breath test for car-
bon dioxide. Br J Anaesth 1981, 53:77-88.
20. Chioléro R, Mavrocordatos P, Bracco D, Schutz Y, Cayeux C, Rev-
elly JP: O
2
consumption by the Fick method. Methodologic
factors. Am J Respir Crit Care Med 1994, 149:1118-1122.
21. Winer BJ: . Statistical Principles in Experimental Design, 2nd edn.
New York: Mc Graw-Hill 1971.
22. Finer NN, Etches PC, Kamstra B, Tierney AJ, Peliowski A, Ryan
CA: Inhaled nitric oxide in infants referred for extracorporeal
membrane oxygenation: dose–response. J Pediatr 1994,
124:302-308.
23. Samama CM, Diaby M, Fellahi JL: Inhibition of platelet aggrega-
tion by inhaled nitric oxide in patients with acute respiratory
distress syndrome. Anesthesiology 1995, 83:56-65.
24. Mourgeon E, Rouby JJ: Distribution of inhaled nitric oxide dur-
ing sequential and continuous administration into the inspira-
tory limb of the ventilator. Intensive Care Med 1997.
25. Imanaka H, Hess D, Kirmse M: Inaccuracies of nitric oxide deliv-
ery systems during adult mechanical ventilation. Anesthesiol-
ogy 1997, 86:676-688.
26. Graham LM, Vasil A, Vasil ML, Voelkel NF, Stenmark KR:
Decreased pulmonary vasoreactivity in an animal model of
Critical Care Vol 1 No 1 Mourgeon et al.
chronic pseudomonas pneumonia. Am Rev Respir Dis 1990,
142:221-229.
27. Spapen H, Vincken W: Pulmonary arterial hypertension in sep-
sis and the adult respiratory distress syndrome. Acta Clin Belg
1992, 47:30-41.
28. Reeves JT, Grover RF: Blockade of acute hypoxic pulmonary
hypertension by endotoxin. J Appl Physiol 1974, 36:328-332.
29. Newman JH, Mc Murtry IF, Reeves JT: Blunted pulmonary pres-
sure response to hypoxia in perfused, ventilated lungs from
oxygen toxic rats: possible role of prostaglandins. Prostaglan-
dins 1980, 22:1-20.
30. Demling RH, Smith M, Gunther R: The effects of prostacyclin
infusion on endotoxin induced lung injury. Surgery 1981,
89:257-263.
31. Frostell C, Fratacci MD, Wain JC, Jones R, Zapol WM: Inhaled
nitric oxide. A selective pulmonary vasodilator reversing
hypoxic pulmonary vasoconstriction. Circulation 1991,
83:2038-2047.
32. Roberts JD Jr, Chen TY, Kawai N: Inhaled nitric oxide reverses
pulmonary vasoconstriction in the hypoxic and acidotic new-
born lamb. Circ Res 1993, 72:246-254.
33. Dyar O, Young JD, Xiong L, Howell S, Johns E: Dose-response
relationship for inhaled nitric oxide in experimental hyperten-
sion in sheep. Br J Anaesth 1993, 71:702-708.
34. Berger JI, Gibson RL, Redding GJ, Standaert TA, Clarke WR,
Truog WE: Effect of inhaled nitric oxide during group B strep-
tococcal sepsis in piglets. Am Rev Respir Dis 1993, 147:1080-
1086.
35. Fratacci MD, Frostell CG, Chen TY, Wain JC, Robinson DR, Zapol
WM: Inhaled nitric oxide. A selective pulmonary vasodilator of
heparin-protamine vasoconstriction in sheep. Anesthesiology
1991, 75:990-999.
36. Chenoweth DE, Cooper SW, Hugli TE: Complement activation
during cardiopulmonary bypass. N Engl J Med 1981, 304:497-
503.
37. Ylikorkala O, Saarela E, Viinikka L: Increased prostacyclin and
thromboxane production in man during cardiopulmonary
bypass. J Thorac Cardiovasc Surg 1981, 82:245-247.
38. Colman RW: Platelet and neutrophil activation in cardiopulmo-
nary bypass. Ann Thorac Surg 1990, 49:32-34.
39. Jahr J, Grände PO: Pulmonary and hemodynamic effects of
extracorporeal circulation in the cat and the beneficial effect of
prostacyclin. Intensive Care Med 1992, 18:118-122.
40. Jones R, Langleben D, Reid LM: Patterns and mechanisms of
remodeling of the pulmonary circulation in acute and subacute
lung injury. In The Pulmonary Circulation and Acute Lung Injury.
Edited by Said SI. Mount Kisko, NY: Futura Publishing Company
1991:179-242.
41. Jia L, Bonaventura C, Bonaventura J, Stanuler JS: S-nitrosohae-
moglobin: a dynamic activity of blood involved in vascular
control. Nature 1996, 380:221-226.