Báo cáo y học: "Close relationship of tissue plasminogen activator–plasminogen activator inhibitor-1 complex with multiple organ dysfunction syndrome investigated by means of the artificial pancreas" doc
Bạn đang xem bản rút gọn của tài liệu. Xem và tải ngay bản đầy đủ của tài liệu tại đây (4.27 MB, 12 trang )
Primary research
Close relationship of tissue plasminogen activator–plasminogen
activator inhibitor-1 complex with multiple organ dysfunction
syndrome investigated by means of the artificial pancreas
Masami Hoshino*, Yoshikura Haraguchi
†
, Hiroyuki Hirasawa
‡
, Motohiro Sakai*, Hiroshi Saegusa*,
Kazushiro Hayashi*, Naoki Horita* and Hiroyuki Ohsawa*
*Department of Intensive and Critical Care Medicine, Tokyo Police Hospital, Chiyoda-ku, Tokyo, Japan
†
National Hospital Tokyo Disaster Medical Center, Tachikawa-shi, Tokyo, Japan
‡
Department of Emergency and Critical Care Medicine, Chiba University School of Medicine, Chuo-ku, Chiba-shi, Chiba, Japan
Correspondence: Masami Hoshino, Department of Intensive and Critical Care Medicine, Tokyo Police Hospital, Fujimi 2-10-41, Chiyoda-ku,
Tokyo 102, Japan. Tel: +81 3 3263 1371; fax: +81 3 3239 7856; e-mail:
AP = artificial pancreas; AT-III = antithrombin III; BG = blood glucose level; DIC = disseminated intravascular coagulation; ECA = endothelial cell
activation; ECI = endothelial cell injury; GT = glucose tolerance; MODS = multiple organ dysfunction syndrome; mMOF = modified multiple organ
failure; NIDDM = noninsulin-dependent diabetes mellitus; PAI-1 = plasminogen activator inhibitor-1; PLT = platelet count; PT = prothrombin time;
SRH = stress related hormone; TAT = thrombin–antithrombin III complex; TM = thrombomodulin; tPA = tissue plasminogen activator; T
3
=
triiodothyronine; T
4
= thyroxine.
Available online />Abstract
Background: Glucose tolerance (GT) has not been taken into consideration in investigations
concerning relationships between coagulopathy and multiple organ dysfunction syndrome (MODS),
and endothelial cell activation/endothelial cell injury (ECA/ECI) in septic patients, although
coagulopathy is known to be influenced by blood glucose level. We investigated those relationships
under strict blood glucose control and evaluation of GT with the glucose clamp method by means of
the artificial pancreas in nine septic patients with glucose intolerance. The relationships between GT
and blood stress related hormone levels (SRH) were also investigated.
Methods: The amount of metabolized glucose (M value), as the parameter of GT, was measured by
the euglycemic hyperinsulinemic glucose clamp method, in which the blood glucose level was
clamped at 80 mg/dl under a continuous insulin infusion rate of 1.12 mU/kg per min, using the artificial
pancreas, STG-22. Multiple organ failure (MOF) score was calculated using the MOF criteria of
Japanese Association for Critical Care Medicine. Regarding coagulopathy, the following parameters
were used: disseminated intravascular coagulation (DIC) score (calculated from the DIC criteria of the
Ministry of Health and Welfare of Japan) and the parameters used for calculating DIC score, protein-C,
protein-S, plasminogen, antithrombin III (AT-III), plasminogen activator inhibitor-1 (PAI-1), and tissue
plasminogen activator–PAI-1 (tPA-PAI-1) complex. Thrombomodulin (TM) was measured as the
indicator of ECI.
Results: There were no significant correlations between M value and SRH, parameters indicating
coagulopathy and the MOF score. The MOF score and blood TM levels were positively correlated
with DIC score, thrombin–AT-III complex and tPA-PAI-1 complex, and negatively correlated with
blood platelet count.
Conclusions: GT was not significantly related to SRH, coagulopathy and MODS under strict blood
glucose control. Hypercoagulability was closely related to MODS and ECI. Among the parameters
indicating coagulopathy, tPA-PAI-1 complex, which is considered to originate from ECA, seemed to be
Received: 1 December 1998
Revisions requested: 17 April 2000
Revisions received: 1 June 2000
Accepted: 18 November 2000
Published: 26 February 2001
Critical Care 2001, 5:88–99
This article may contain supplementary data which can only be found
online at />© 2001 Hoshino et al, licensee BioMed Central Ltd
(Print ISSN 1364-8535; Online ISSN 1466-609X)
Available online />commentary review reports meeting abstracts
primary research
supplement
Introduction
Hypercoagulability and decreased fibrinolysis, including
increased PAI-1 level, are often found in the clinical field
and are considered to be the risk factors of cardiovascu-
lar diseases and glucose intolerance, especially in
patients with noninsulin-dependent diabetes mellitus
(NIDDM) [1–6]. Most of the acutely ill severe patients
also have coagulopathy, and they often have glucose
intolerance. The relationships between coagulopathy and
organ dysfunction/glucose intolerance in the acute ill
phase have not, however, been clearly analyzed.
Although there are reports investigating the relationship
between coagulopathy and organ dysfunction [7–13],
and the relationship between coagulopathy and endothe-
lial cell activation/injury [14–17] in septic patients, there
is no report investigating the relationship between coag-
ulopathy and GT in septic patients as far as we know.
Moreover, parameters related to coagulopathy are
known to be influenced directly by the metabolic factors.
For example, glucose, insulin, and fat influence the pro-
duction of PAI-1, which is the important parameter
related to coagulopathy [18–23]. In aforementioned
reports, however, metabolic factors, especially blood
glucose level (BG) that is usually unstable in the septic
state, are not taken into consideration.
We have been using the bedside type artificial pancreas
(AP) in septic patients with glucose intolerance since
1985 to control BG, to perform effective nutritional
support, and to evaluate metabolic disorders including
glucose and fat. By strictly stabilizing BG using AP, analy-
ses of the factors including PAI-1 that are influenced by
BG are considered to be correctly performed.
The purpose of this study is, first, to analyze the relation-
ships between coagulopathy, including abnormal blood
PAI-1-related parameters, and glucose tolerance, MODS,
and endothelial cell injury. Second was to investigate which
parameters related to coagulopathy were most closely
related to glucose tolerance, MODS, and endothelial cell
injury, in septic patients with glucose intolerance in whom
BG was strictly controlled and the glucose tolerance was
evaluated with the glucose clamp method by means of AP.
We consider that better understanding of the aforemen-
tioned relationships and confirming the useful parameters
will be helpful for the early diagnosis of the severity of
sepsis and for the treatment of the septic patients.
Materials and methods
The investigated patients were nine septic intensive care
unit patients with glucose intolerance in whom BG was
strictly controlled by means of AP. We selected the
patients with strict blood glucose control by AP in order to
exclude the direct influence of BG to the parameters
related with coagulopathy, including PAI-1-related para-
meters, as already mentioned. The patients were all in
septic condition, which was defined as the condition with
systemic inflammatory response syndrome caused by the
infection [24]. To analyze the septic patients with sepsis-
induced (or related) glucose intolerance, the diabetes
patients and those who had liver or pancreatic diseases
as primary diseases were excluded. Six patients had acute
respiratory distress syndrome (four caused by panperitoni-
tis, two after intracranial hemorrhage), two had gangrene
of a lower extremity, and one had a burn (Table 1). One
patient with panperitonitis died.
Regarding administered drugs that might influence
glucose tolerance on the day when the GT measurements
were performed (total number of measurements, 18 times
(days); 2 times (days) for each patient; see later),
dopamine was used for 5 patients (6 days out of 10 mea-
sured days), predonisolone for 1 patient (2 days out of 2
measured days), and dobutamine for 1 patient (2 days out
of 2 measured days). The amount of dopamine used was
less than 5 µg/kg per min (mean, 2.5 ± 1.6 µg/kg per min
[n = 6]; all were used for increasing renal blood flow), that
of predonisolone was 40 mg/day, and that of dobutamine
was 13 and 4 µg/kg per min.
Analyzed items were as follows. Regarding MODS, the
multiple organ failure (MOF) score was calculated using
the MOF criteria of the Japanese Association for Critical
Care Medicine [25] (Table 2). The maximum of the MOF
score is 14. The modified MOF score (mMOF score), in
which points of disseminated intravascular coagulation
(DIC) (coagulopathy) were excluded, was also calculated
when the correlation between coagulopathy and MODS
was investigated.
The parameter of glucose metabolism, the M value (the
amount of metabolized glucose), was measured by the
euglycemic hyperinsulinemic glucose clamp method, in
which the BG level was clamped (or maintained) at
80 mg/dl under a continuous insulin infusion rate of
a sensitive parameter of MODS and ECI, and might be a predictive marker of MODS. The treatment for
reducing hypercoagulability and ECA/ECI were thought to be justified as one of the therapies for
acutely ill septic patients.
Keywords: artificial pancreas, coagulopathy, diabetes mellitus, multiple organ dysfunction syndrome, tissue
plasminogen activator-plasminogen activator inhibitor-1 complex
Critical Care Vol 5 No 2 Hoshino et al
1.12 mU/kg per min (40 mU/m
2
per min), using AP. The M
value is the amount of glucose infusion required to clamp
BG, and is the indicator of peripheral glucose tolerance
(normal range, 6–8 mg/kg per min) [26,27]. The daily
mean blood glucose level was calculated from the BG
measured (sampled) every 1 h.
Table 1
Primary diseases of the nine septic patients with glucose intolerance
Patient Age (years) Sex Diseases Prognosis
1 54 F ARDS (after panperitonitis due to perforation of the ileum) Alive
2 67 M ARDS (after panperitonitis due to NOMI) Alive
3 74 M ARDS (after panperitonitis due to perforation of the duodenum) Died
4 49 M ARDS (after panperitonitis due to necrotic cholecystitis) Alive
5 47 M ARDS (after the operation of acute subdural hematoma) Alive
6 59 M ARDS (after the operation of subarachnoideal hemorrhage) Alive
7 66 M Gangrene of lower extremity Alive
8 74 M Gangrene of lower extremity Alive
9 21 M Burn Alive
ARDS, Acute respiratory distress syndrome; F, female; M, male; NOMI, nonocclusive mesenteric ischemia.
Table 2
Multiple organ failure score calculated using the criteria proposed by the Japanese Association for Critical Care Medicine [25]
Impaired organ Criteria Points Impaired organ Criteria Points
Kidney Urine output <600 ml/day; or 50 mg/dl < BUN; 1 Digestive tract Hematemesis, melena; or ulcer; 1
or 3–5 mg/dl creatinine or blood transfusion greater than 2 U/day
5 mg/dl < creatinine; or 0 ml/h < CH
2
O; 2 bleeding from digestive tract with hypotension, 2
or 3.0% < FENa or perforation, necrosis
Lung PaO
2
<60 mmHg (room air); or 250 mmHg 1 Brain 10–100 JCS, or 8–12 GCS 1
≤ PaO
2
/FiO
2
<350 mmHg; or 300–400 mmHg
A-aDO
2
(FiO
2
= 1.0); or 20–30% Qs/Qt; 100<JCS, or 8<GCS, or convulsion with 2
or with respirator for more than 5 days unconsciousness, or no auditory brain stem
response, or brain death
PaO
2
/FiO
2
<250 mmHg; or 400 mmHg 2
< A-aDO
2
(FiO
2
= 1.0); or 30%<Qs/Qt DIC 20 µg/ml ≤ FDP; or platelet ≤ 80,000/µl; 1
or fibrinogen ≤100 mg/dl; or exacerbation
Liver 3.0–5.0 mg/dl bilirubin; or 100 IU/l < s-GPT; 1 of FDP, platelet, fibrinogen within 2 days
or 0.4–0.7 AKBR 1 (more than three times greater than or
one-third of normal value), or with heparin
5.0 mg/dl < bilirubin; or AKBR < 0.4 2 (≥50 U/kg per day) or probable DIC
Cardiovascular 10 mmHg < CVP, or major arrhythmia, 1 Definite DIC 2
or Forrester classification: peripheral vascular
resistance < 1000 dyne s/cm
5
; or with inotropic
agents for more than 2 h
Forrester classification: with shock, or life 2
threatening arrythmia, or acute myocardial
infarction, or cardiac arrest, or major arrhythmia
with shock
Judgement of probable disseminated intravascular coagulation (DIC)* and definite DIC* from Criteria of DIC proposed by the Ministry of Health and
Welfare of Japan [28]. A-aDO
2
, alveolar–arterial oxygen difference; AKBR, arterial ketone body ratio; BUN, blood urea nitrogen; CVP, central
venous pressure; FDP, fibrin and fibrinogen degradation products; FENa, fractional excretion of sodium; GCS, Glasgow coma scale; JPS, Japan
coma scale.
The blood concentration of stress hormones (cate-
cholamines [adrenaline, noradrenaline, dopamine], growth
hormone, glucagon, cortisol), adrenocorticotrophic
hormone, and thyroid-related hormones (thyroid stimulat-
ing hormone, triiodothyronine [T
3
], free T
3
, thyroxine [T
4
],
free T
4
) were measured because they might influence the
GT. Dopamine, dobutamine, and predonisolone were
administered when the measurements of the M value were
performed in some patients as already mentioned.
Regarding coagulopathy, the following parameters were
used: DIC score, platelet count (PLT), fibrin and fibrinogen
degradation products, fibrinogen, prothrombin time (PT) ratio
(PT of the patient divided by control PT), D-dimer, α
2
plasmin
inhibitor–plasmin complex, thrombin–antithrombin III complex
(TAT), protein C antigen and activity, protein S antigen and
activity, plasminogen, antithrombin III (AT-III), PAI-1 antigen
and activity, and tissue plasminogen activator (tPA)–PAI-1
complex. The DIC score was calculated from the DIC criteria
of the Ministry of Health and Welfare of Japan [28] (Table 3).
As the indicator of the endothelial cell injury, the blood con-
centration of thrombomodulin (TM) was measured. Fibrino-
gen was measured by the thrombin time method, PT by
Quick’s method, and fibrin and fibrinogen degradation prod-
ucts by the latex agglutination method. TAT, tPA–PAI-1
complex, protein S antigen, protein S activity and TM were
measured by enzyme immunoassay, D-dimer and PAI-1
Available online />commentary review reports meeting abstracts
primary research
supplement
Table 3
Criteria of disseminated intravascular coagulation (DIC) (The Ministry of Health and Welfare of Japan [28])
Criteria Points
1. Underlined disease (+) 1
(–) 0
2. Symptom (1) Bleeding tendency (+) 1
(–) 0
(2) Symptom caused by organ dysfunction (+) 1
(–) 0
3. Laboratory data (1) Serum FDP (µg/ml) 40 ≤ 3
20 ≤ < 40 2
10 ≤ < 20 1
10 > 0
(2) Platelet (× 10
3
/µl) 50 ≥ 3
80 ≥ > 50 2
120 ≥ > 80 1
120 0
(3) Plasma fibrinogen (mg/dl) 100 ≥ 2
150 ≥ > 100 1
150 < 0
(4) Prothrombin time/control 1.67 ≤ 2
1.25 ≤ < 1.67 1
1.25 > 0
4. Supplemental data (1) Detection of soluble fibrin monomer
(2) Increase of D-dimer
(3) Increase of thrombin–antithrombin complex
(4) Increase of plasmin-a
2
–plasmin inhibitor complex
(5) Exacerbation of FDP, platelet, fibrinogen within several days
(6) Improvement of data with anticoagulant therapy
Judgment*
1. Definite DIC (1) Patients who do not have leukemia, pernicious anemia, liver cirrhosis, More than 7 or 6 points with
or who are not under cancer chemotherapy more than two of supplemental data
(2) Patients who have leukemia, pernicious anemia, or who are More than 4 or 3 points with
under cancer chemotherapy points for bleeding tendency and platelet more than two of supplemental data
are not included
(3) Patients who have liver cirrhosis More than 10 or 9 points with
more than two of supplemental data
2. Probable DIC (1) Patients who do not have leukemia, pernicious anemia, liver cirrhosis, 6 points
or who are not under cancer chemotherapy
(2) Patients who have leukemia, pernicious anemia, or who are under 3 points
cancer chemotherapy points for bleeding tendency and platelet are not included
(3) Patients who have liver cirrhosis 9 points
*Exclusion: this DIC criteria cannot be applied for neonates, pregnant woman, and patients with fulminant hepatitis. FDP, fibrin and fibrinogen
degradation products.
antigen by enzyme-linked immunosorbent assay, and α
2
plasmin inhibitor–plasmin complex and protein C antigen by
the Latex photometric immunoassay. AT-III, PAI-1 activity
and plasminogen were measured by the synthetic substrate
method, and protein C activity by the activated partial throm-
boplastin time method (SRL Inc Co, Tokyo, Japan).
Data sampling/measurement (blood sampling, MOF/DIC
scoring, and glucose clamp method) was performed twice
for each patient. The first data sampling/measurement was
carried out within 3 days after the admission, and the
second data sampling/measurement was performed 1
week after the first data sampling/measurement. Blood
sampling was carried out at 08:00 h on the day when the
glucose clamp method (the measurement of the M value)
was performed. We began the glucose clamp method at
09:00 h, when intravenous drip infusion containing
glucose for nutritional support was stopped. The daily
mean blood glucose level was calculated using the BG
during 24 h before the start of the glucose clamp method.
The following points were investigated in turn using the
aforementioned data. First, confirmation of the capability of
the AP for strict blood glucose control (by calculating the
daily mean BG) and for the evaluation of the GT (M value).
Whether the blood concentration of the stress-related hor-
mones (listed earlier), which are considered to be influenced
by sepsis and by the administration of drugs, was related to
the GT (M value) was also investigated. Third, whether there
were any relationships between the glucose tolerance (M
value) and coagulopathy, MODS (MOF score). The relation-
ships among coagulopathy, MODS (MOF/mMOF score),
and endothelial cell injury (TM) were then investigated.
Finally, confirmation of the parameters related to coagulopa-
thy that were most closely correlated with MODS
(MOF/mMOF score) and endothelial cell injury (TM).
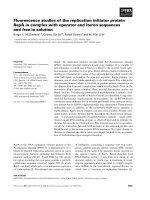
The AP used was STG-22, manufactured by NIKKISOH
Corporation (Tokyo, Japan) (Fig. 1). The AP controls BG by
administering insulin or glucose automatically according to
the absolute BG and the change of BG, which is measured
by continuous blood sampling.
The statistical data are shown as mean ± standard devia-
tion. Strengths of the relationships between the data are
indicated by correlation coefficient r, and the correlations
between the data are shown by a regression line. The
unpaired Student t test was used for the comparison of
mean values. P < 0.05 was considered significant.
Results
Blood glucose control and measurements of the
glucose tolerance by means of AP
The mean of the daily mean blood glucose levels and M
values obtained from the first and second measurements
were 183 ± 32 mg/dl (n = 8), 4.4 ± 1.4 mg/kg per min
(n = 7), and 147 ± 26 mg/dl (n = 9), 4.7 ± 1.6 mg/kg per
min (n = 8), respectively (Table 4). The daily mean blood
glucose level could not be calculated in one patient at the
first measurement because a blood sampling disorder of
AP occurred and a sufficient number of BG data could not
be obtained. M values could also not be measured in two
patients at the first measurement and in one patient at the
second measurement because the glucose intolerance
was severe and the BG level did not decrease to the
clamp level (80 mg/dl).
No significant relationships between the GT and blood
stress related hormone levels
There were no significant correlations between the M
value and blood stress hormone levels (adrenaline, nora-
drenaline, dopamine, growth hormone, glucagon, cortisol),
adrenocorticotrophic hormone, and thyroid-related hor-
mones (thyroid stimulating hormone, T
3
, free T
3
, T
4
, free
T
4
) (Table 5). We also investigated whether drug (cate-
cholamines [dopamine, dobutamine], glucocorticoids [pre-
Critical Care Vol 5 No 2 Hoshino et al
Figure 1
Bedside-type artificial pancreas STG-22.
donisolone]) administration significantly influenced the
glucose tolerance. There was, however, no significant dif-
ference between the mean of the M values of the patients
who were administered those drugs (4.9 ± 1.3 mg/kg per
min; n = 10) and that of those who were not administered
those drugs (4.0 ± 1.7 mg/kg per min; n = 5).
No significant correlations between the GT and MODS,
coagulopathy
There were no significant correlations between the M
value and MODS, and parameters related to coagulation
and fibrinolysis (Table 6).
Significant correlation between coagulopathy and MODS
The MOF score was strongly correlated with the DIC score
(r = 0.75, P < 0.002), TAT (r = 0.72, P < 0.002), tPA–PAI-
1 complex (r = 0.69, P < 0.002) and PLT (r = –0.68,
P < .002) among parameters related with coagulation and
fibrinolysis (Table 7). Because three of the aforementioned
parameters (not the tPA–PAI-1 complex) are used for cal-
culating the MOF score, however, correlations between the
mMOF score, in which the points of coagulopathy of the
MOF score are excluded, and parameters related to coagu-
lation and fibrinolysis were also analyzed. The mMOF score
was still strongly correlated with TAT (r = 0.69, P < 0.002),
DIC score (r = 0.66, P < 0.002), PLT (r = –0.65,
P < 0.003) and tPA–PAI-1 complex (r = 0.62, P < 0.005)
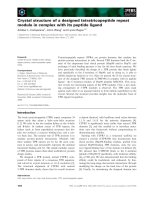
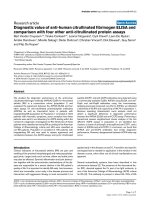
(Table 8; Fig. 2).
Significant correlations between endothelial cell injury
and MODS, coagulopathy
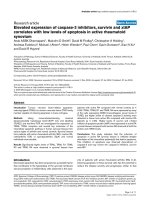
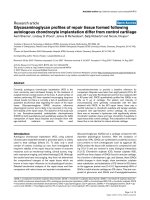
TM was correlated with MOF score (r = 0.92, P < 0.002)
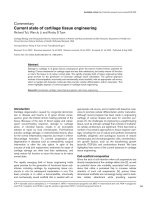
(Fig. 3), DIC score (r = 0.80, P < 0.002), tPA–PAI-1
complex (r = 0.85, P < 0.002), TAT (r = 0.85, P < 0.002)
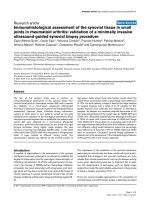
and PLT (r = –0.58, P < 0.03) (Table 9; Fig. 4). In one
patient, the measurement of TM was performed only once.
Relationships between tPA–PAI-1 complex and other
parameters related to coagulation and fibrinolysis
The tPA–PAI-1 complex was positively correlated with
DIC score (r = 0.74, P < 0.002), TAT (r = 0.85,
P < 0.002), and PAI-1 antigen (Table 10).
Available online />commentary review reports meeting abstracts
primary research
supplement
Table 4
Blood glucose control and measurements of glucose tolerance by means of artificial pancreas
Daily mean blood glucose levels (mg/dl) Mean M values (mg/kg per min)
First measurement 183 ± 32 (n = 8) 4.4 ± 1.4 (n = 7)
Second measurement 147 ± 26 (n = 9) 4.7 ± 1.6 (n = 8)
Total 164 ± 34 (n = 17) 4.6 ± 1.5 (n = 15)
The first measurement was performed within 3 days after admission, and the second measurement was performed 1 week after the first
measurement.
Table 5
No significant correlations between glucose tolerance and blood stress related hormone levels: correlation coefficient (
r
)
between the
M
value and hormones
Normal range Mean r P
Adrenaline (ng/ml) ≤0.17 0.11 ± 0.10 (n = 18) –0.17 < 0.55 (n = 15)
Noradrenaline (ng/ml) 0.15–5.7 0.79 ± 0.74 (n = 18) 0.15 < 0.60 (n = 15)
Dopamine (ng/ml) ≤0.03 19 ± 41 (n = 18) 0.20 < 0.48 (n = 15)
Growth hormone (ng/ml) 0.28–8.70 4.7 ± 5.2 (n = 18) –0.45 < 0.09 (n = 15)
Glucagon (pg/ml) 23–197 234 ± 156 (n = 18) 0.39 < 0.17 (n = 14)
Cortisol (µg/dl) 5.6–21.3 33 ± 42 (n = 18) –0.10 < 0.73 (n = 15)
ACTH (pg/ml) ≤60 28 ± 19 (n = 18) –0.05 < 0.87 (n = 15)
TSH (µU/ml) 0.5–4.8 1.1 ± 1.6 (n = 17) 0.49 < 0.08 (n = 14)
T
3
(ng/dl) 80–180 82 ± 30 (n = 17) –0.05 < 0.87 (n = 14)
Free T
3
(pg/ml) 2.5–4.5 2.2 ± 0.7 (n = 17) –0.10 < 0.74 (n = 14)
T
4
(µg/dl) 5.0–13.7 9.4 ± 4.2 (n = 17) 0.09 < 0.76 (n = 14)
Free T
4
(ng/dl) 0.8–1.9 1.4 ± 0.6 (n = 17) 0.11 < 0.71 (n = 14)
ACTH, Adrenocorticotrophic hormone; TSH, thyroid stimulating hormone; T
3
, triiodothyronine; T
4
= thyroxine.
Critical Care Vol 5 No 2 Hoshino et al
Table 6
No significant correlations between glucose tolerance and multiple organ dysfunction syndrome, coagulopathy: correlation
coefficient (
r
) between the
M
value and the multiple organ failure (MOF) score/parameters related with coagulopathy
Normal range Mean rP
MOF score 4.6 ± 1.5 (n = 15) 0.20 < 0.48 (n = 15)
DIC score 4.0 ± 1.8 (n = 18) 0.32 < 0.25 (n = 15)
PLT (/µl) 150,000–280,000 188,000±123,000 (n = 18) 0.39 < 0.15 (n = 15)
FDP (µg/ml) < 10 14 ± 15 (n = 18) 0.49 < 0.06 (n = 15)
PT ratio < 1.25 1.3 ± 0.10 (n = 16) –0.02 < 0.95 (n = 13)
Fibrinogen (mg/dl) 150–350 500 ± 154 (n = 18) –0.23 < 0.42 (n = 15)
TAT (ng/ml) ≤3.0 13.2 ± 13.0 (n = 18) 0.34 < 0.22 (n = 15)
PIC (µg/ml) ≤0.8 1.2 ± 0.7 (n = 18) 0.27 < 0.34 (n = 15)
D-Dimer (ng/ml) ≤150 750 ± 630 (n = 18) 0.43 < 0.11 (n = 15)
Plasminogen (%) 75–125 80 ± 23 (n = 18) 0.25 < 0.37 (n = 15)
AT-III (%) 70–120 94 ± 28 (n = 13) 0.25 < 0.47 (n = 11)
Protein C activity (%) 55–140 75 ± 43 (n = 18) 0.44 < 0.10 (n = 15)
Protein C antigen (%) 70–150 92 ± 51 (n = 18) 0.47 < 0.08 (n = 15)
Protein S activity (%) 60–150 72 ± 18 (n = 18) 0.42 < 0.12 (n = 15)
Protein S antigen (%) 65–135 83 ± 24 (n = 18) 0.42 < 0.12 (n = 15)
PAI-1 activity (U/ml) 12–15 5.3 ± 3.4 (n = 13) 0.55 < 0.10 (n = 10)
PAI-1 antigen (ng/ml) ≤50 120 ± 86 (n = 18) 0.22 < 0.44 (n = 15)
tPA–PAI-1 complex (ng/ml) ≤11 26 ± 18 (n = 18) 0.27 < 0.34 (n = 15)
AT-III, antithrombin-III; DIC, disseminated intravascular coagulation; FDP, fibrin and fibrinogen degradation products; PAI-1, plasminogen activator
inhibitor-1; PIC, α
2
plasmin inhibitor–plasmin complex; PLT, platelet count; PT, prothrombin time; TAT, thrombin–antithrombin complex; tPA, tissue
plasminogen activator.
Table 7
Correlation coefficients (
r
) between multiple organ failure
score and parameters related to coagulation and fibrinolysis
rPn
DIC score 0.75 < 0.002 18
TAT 0.72 < 0.002 18
tPA–PAI-1 complex 0.69 < 0.002 18
PLT –0.68 < 0.002 18
Protein S activity –0.48 < 0.04 18
Plasminogen –0.43 < 008 18
Protein C activity –0.41 < 0.09 18
D-Dimer 0.38 < 0.12 18
FDP 0.37 < 0.13 18
Protein C antigen –0.31 < 0.22 18
Protein S antigen –0.25 < 0.32 18
PAI-1 activity –0.25 < 0.42 13
PT ratio –0.23 < 0.40 16
AT-III 0.22 < 0.48 13
PIC 0.2 < 0.43 18
PAI-1 antigen 0.19 < 0.46 18
Fibrinogen 0.000,09 < 1.0 18
AT, Antithrombin; DIC, disseminated intravascular coagulation; FDP,
fibrin and fibrinogen degradation products; PAI-1, plasminogen
activator inhibitor-1; PIC, α
2
plasmin inhibitor–plasmin complex; PLT,
platelet count; PT, prothrombin time; TAT, thrombin–antithrombin
complex; tPA, tissue plasminogen activator.
Table 8
Correlation coefficients (
r
) between modified multiple organ
failure (mMOF) score* and parameters related to coagulation
and fibrinolysis
r P n
DIC score 0.66 < 0.002 18
TAT 0.69 < 0.002 18
PLT –0.65 < 0.003 18
tPA–PAI-1 complex 0.62 < 0.005 18
Protein S activity –0.44 < 0.07 18
Protein C activity –0.43 < 0.08 18
Plasminogen –0.42 < 0.08 18
Protein C antigen –0.32 < 0.20 18
D-Dimer 0.3 < 0.23 18
AT-III 0.24 < 0.46 13
Protein S antigen –0.22 < 0.38 18
PAI-1 activity –0.21 < 0.50 13
PT ratio –0.18 < 0.51 16
PAI-1 antigen 0.18 < 0.48 18
PIC 0.16 < 0.54 18
Fibrinogen 0.000,03 < 1.0 18
* mMOF score = MOF score – points of coagulopathy of the MOF
score. AT, Antithrombin; DIC, disseminated intravascular coagulation;
PAI-1, plasminogen activator inhibitor-1; PIC, α
2
plasmin
inhibitor–plasmin complex; PLT, platelet count; PT, prothrombin time;
TAT, thrombin–antithrombin complex; tPA, tissue plasminogen activator.
Discussion
Acutely ill patients often have coagulopathy and meta-
bolic disorders, including glucose intolerance and abnor-
mal serum fat levels, as well as organ dysfunctions.
Those abnormalities seem to be mutually related, but
studies concerning relationships among coagulopathy,
metabolic disorders, and organ dysfunctions have rarely
been reported. One of the reasons for this lack of litera-
ture seems to be that metabolic disorders, especially
glucose intolerance, are unstable and could not be easily
evaluated in acute phase. In this study, we have investi-
gated those relationships under strict blood glucose
control and the strict evaluation of the GT with the
glucose clamp method by means of AP in septic patients
with glucose intolerance.
Although the glucose tolerances of the patients were
impaired, blood glucose control by means of AP was
good, considering results of the mean of the M values
and the daily mean BG (Table 4). We could not measure
the M value three times because the GT was so severe
that BG did not decrease to the clamp level (80 mg/dl).
This problem was considered to indicate the necessity of
the improvement for measuring the M value in patients
with severe GT (eg increasing the amount of insulin infu-
Available online />commentary review reports meeting abstracts
primary research
supplement
Figure 2
Correlations between mMOF score and parameters related to coagulation and fibrinolysis. The mMOF score (mMOF score = MOF score – the
points of coagulopathy of MOF score) was positively correlated with (a) the DIC score, (b) TAT and (d) tPA–PAI-1 complex, and (c) negatively
correlated with PLT.
Figure 3
Correlation between TM and MOF score. The MOF score was
positively correlated with blood TM level.
sion, stopping intravenous drip infusion earlier than
09:00 h, etc).
There are many factors that influence BG or the GT. Stress
hormones and thyroid-related hormones are well known to
be included in those factors, and they are also used as the
drugs. In the present study in which the AP strictly con-
trolled BG, however, those hormones did not significantly
influence the glucose tolerance. This is determined from
the results that there were no significant correlations
between the M value and the blood concentration of these
hormones (Table 5), and that there were no significant
differences in the M values between the patients who were
administered these hormones and those who were not. We
consider that sepsis induced by some other factors other
than these hormones impaired the glucose tolerance.
The relationship between GT including fat metabolism and
hypercoagulability, indicated by the increased levels of
PAI-1 or tPA–PAI-1 complex, has been well investigated in
the patients with NIDDM [5,29,30], with hypertension
[31–34], with coronary artery disease [35], and in the
normal human subjects or the general population [36,37].
In these studies, PAI-1 or tPA–PAI complex was closely
related with, and thought to be caused by, hyperinsuline-
mia, hyperglycemia, insulin resistance, hypertriglyc-
eridemia, hypercholesterolemia, and increased level of
high density lipoprotein cholesterol. In vitro studies using
endothelial cells, hepatoma cells, or vascular smooth
muscle cells showed that PAI-1 was produced by
glucose, insulin, free fatty acid, cholesterol, very low
density lipoprotein, glucocorticoids, and hyperosmolarity
[18–23]. In our study performed under strict blood
glucose control by means of AP, however, the glucose
intolerance was not a significant factor influencing MODS
and coagulopathy, considering from the results that there
were no significant correlations between the M value and
the MOF score, parameters related with coagulation and
fibrinolysis (Table 6). In addition, under this strict blood
glucose control, BG, blood insulin and fat levels did not
significantly influence the coagulopathy, because there
were no significant correlations between parameters
related with coagulation and fibrinolysis and daily mean
BG, blood insulin concentration, and serum fat (triglyc-
eride, total cholesterol, free fatty acid) levels (data not
shown). These results are considered to indicate that the
Critical Care Vol 5 No 2 Hoshino et al
Figure 4
Correlations between TM and parameters related with coagulation and fibrinolysis. Blood TM levels were positively correlated with (a) the DIC
score, (b) tPA–PAI-1 complex and (c) TAT, and (d) negatively correlated with PLT.
influence of the GT and the factors related with the
glucose tolerance (eg BG, blood insulin and fat levels) to
coagulopathy could be excluded by the strict blood
glucose control using AP.
Relationships between coagulopathy and chronic organ
dysfunctions have been well investigated. The hypercoag-
ulable state or decreased fibrinolytic activity in NIDDM
patients, shown by increased levels of PAI-1, fibrinogen,
factor VII, von Willebrand factor, and tPA, are considered
to be risk factors of cardiovascular diseases [1–6,29,
38,39]. Increased PAI-1 level is especially thought to be a
causative factor of atherosclerosis [5,6,38]. In patients
other than those with NIDDM, including those with insulin-
dependent diabetes mellitus [40], history of myocardial
infarction [41], and hypertension [31–33], hypercoagula-
ble states with increased PAI-1 level are also considered
to be one of the risk factors of coronary atherosclerosis or
hypertension. Increased PAI-1 level seems to be the
cause of, and not only the result of, cardiovascular dis-
eases or atherosclerosis, because it was shown in an
animal study that increased expression of PAI-1 in the
arterial wall preceded atherosclerosis [6].
Relationships between hypercoagulable state and sepsis
or septic MODS have been investigated in recent years
[7–13]. The hypercoagulable state, shown by increased
levels of PAI-1 [7,8,10,13], TAT [7–9], and prothrombin
fragment 1 + 2 [11], and by decreased levels of AT-III
[7,9,11,12], factor VII [7,11], and protein C [12], were
reported in these studies to be closely related to septic
MODS. As mentioned in the Introduction, however, meta-
bolic factors including glucose and fat that are considered
to influence those parameters related with coagulopathy
are not taken into consideration in those investigations. In
our study, performed with strict blood glucose control by
AP, the MOF score (mMOF score) was positively corre-
lated with the DIC score, TAT, and tPA–PAI-1 complex,
and was negatively correlated with PLT (Tables 7 and 8;
Fig. 2). The tPA–PAI-1 complex, which is reported to posi-
tively correlate with tPA [42–45], is considered to be a
parameter of hypercoagulability and decreased fibrinoly-
sis, and to be closely related with thrombotic diseases
[42,43]. The tPA–PAI-1 complex was in fact also posi-
tively related with TAT (Table 10) in this study, which is the
parameter of hypercoagulability. On the contrary, there
were no significant correlations between the MOF score
(mMOF score) and parameters related with fibrinolysis (α
2
plasmin inhibitor–plasmin complex, fibrin and fibrinogen
degradation products, D-dimer). Judging from the afore-
mentioned results in the present study, hypercoagulability
and decreased fibrinolysis, indicated by the increase of
Available online />commentary review reports meeting abstracts
primary research
supplement
Table 9
Correlation coefficients (
r
) between thrombomodulin (TM) and
multiple organ failure (MOF) score, parameters related to
coagulation and fibrinolysis*
rPn
MOF score 0.92 < 0.002 17
DIC score 0.80 < 0.002 17
tPA–PAI-1 complex 0.85 < 0.002 17
TAT 0.85 < 0.002 17
PLT –0.58 < 0.01 17
FDP 0.50 < 0.04 17
D-Dimer 0.48 < 0.05 17
PAI-1 antigen 0.40 < 0.11 17
Protein C activity –0.38 < 0.13 17
Protein S activity –0.36 < 0.16 17
PIC 0.33 < 0.20 17
Fibrinogen –0.31 < 0.23 17
Plasminogen –0.31 < 0.23 17
Protein C antigen –0.3 < 0.25 17
AT-III 0.27 < 0.41 12
PT ratio –0.25 < 0.38 15
Protein S antigen –0.15 < 0.57 17
PAI-1 activity –0.04 < 0.90 12
* Mean of TM, 7.3 ± 4.2 FU/ml (n = 17); normal range, ≤4.5. AT-III,
antithrombin-III; DIC, disseminated intravascular coagulation;
FDP, fibrin and fibrinogen degradation products; PAI-1, plasminogen
activator inhibitor-1; PIC, α
2
plasmin inhibitor–plasmin complex;
PLT, platelet count; PT, prothrombin time; TAT, thrombin–antithrombin
complex; tPA, tissue plasminogen activator.
Table 10
Correlation coefficients (
r
) between the tissue plasminogen
activator–plasminogen activator inhibitor-1 (tPA–PAI-1)
complex and other parameters related to coagulation and
fibrinolysis
r P n
DIC score 0.74 < 0.002 18
TAT 0.85 < 0.002 18
PAI-1 antigen 0.60 < 0.007 18
PLT –0.49 < 0.04 18
Protein C activity –0.39 < 0.11 18
PT ratio –0.37 < 0.16 18
D-Dimer 0.36 < 0.14 18
FDP 0.36 < 0.14 18
Protein S antigen –0.34 < 0.17 18
Protein C antigen –0.33 < 0.18 18
Plasminogen –0.31 < 0.22 18
PIC 0.30 <0.23 18
Fibrinogen –0.10 < 0.70 18
AT-III 0.035 < 0.90 13
PAI-1 activity –0.014 < 0.98 13
AT-III, antithrombin-III; DIC, disseminated intravascular coagulation;
FDP, fibrin and fibrinogen degradation products; PIC, α
2
plasmin
inhibitor–plasmin complex; PLT, platelet count; PT, prothrombin time;
TAT, thrombin–antithrombin complex.
the tPA–PAI-1 complex and TAT, were considered to be
closely related with MODS in acutely ill septic patients.
The tPA–PAI-1 complex, which is not used for calculating
the MOF score and the DIC score, also seemed to be a
useful and sensitive marker of MODS.
Moreover, a hypercoagulable state indicated by the ele-
vated tPA–PAI-1 level may be one of the risk factors and
predictive markers of MODS. This follows from studies
reporting that the hypercoagulable state preceded MODS,
in which significant changes of the parameters related
with hypercoagulability were found at the onset of sepsis
[7]. We also found that changes of the tPA–PAI-1
complex preceded those of organ dysfunctions in some
cases (data not shown). These findings suggest that the
hypercoagulable state disturbs microcirculation and leads
to MODS [8,10].
There were close correlations between MOF score
(mMOF score) and TAT and tPA-PAI-1 complex, but no
significant correlations between MOF score (mMOF
score) and PAI-1, AT-III, and protein C in our study. The
reasons for this are not clear, but may be related to the
conditions in which our investigation was performed under
strict blood glucose control by means of AP, related to the
limited number of the patients in our study, or related to
the origin of the parameters. PAI-1 is synthesized not only
by the endothelium, but also by the liver, vascular smooth
muscle cells, and platelets [46]. AT-III is synthesized by
the liver and endothelium, and protein C by the liver. On
the contrary, the tPA–PAI-1 complex is considered to be
synthesized mainly by the activated endothelium, because
the tPA–PAI-1 complex is the indicator of tPA, as already
mentioned, and tPA is synthesized by the endothelium
activated with thrombin, cytokines (eg tumor necrosis
factor, interleukin-2), endotoxin, endothelin, cate-
cholamine, histamine, and activated protein C [17,47,48].
A positive correlation between MOF score (mMOF score)
and tPA–PAI-1 complex therefore suggests not only a
close relationship between organ dysfunction and hyper-
coagulability, but also an intimate relationship between
organ dysfunction and endothelial cell activation.
Endothelial cell injury was closely related with MODS and
coagulopathy characterized by hypercoagulability with
decreased fibrinolysis, judging from the results that TM
was closely correlated with MOF score, DIC score,
tPA–PAI-1 complex, TAT, and PLT (Table 9; Figs 3 and 4).
These results are consistent with the other reports that
endothelial cell activation or injury, which are caused by
endotoxin, cytokines, complement, and neutrophils
[14–17], causes a hypercoagulable state or DIC, which
leads to MODS [14–16]. TM is usually considered to be
one of the markers of endothelial cell injury. However, TM
also seemed to be a marker of endothelial cell activation in
septic patients, because there was positive correlation
between TM and tPA–PAI-1 complex (Table 9), which was
considered to be one of the parameters of endothelial cell
activation as mentioned earlier.
Conclusion
We investigated acutely ill septic patients with glucose
intolerance in which BG was strictly controlled and the
glucose tolerance was measured by the glucose clamp
method by means of AP, and obtained the following con-
clusions. The GT did not significantly relate with blood
stress related hormone levels, coagulopathy and MODS
under strict blood glucose control. Coagulopathy charac-
terized by hypercoagulability with decreased fibrinolysis
was closely related with MODS and endothelial cell injury.
Among the parameters related with coagulation and fibri-
nolysis, the tPA–PAI-1 complex, considered to originate
from activated endothelium, seemed to be a sensitive para-
meter of MODS and endothelial cell injury, and might be
one of the predictive and risk factors of MODS. Finally, the
treatment for reducing hypercoagulability and endothelial
cell activation/endothelial cell injury was thought to be justi-
fied as one of the therapies for acutely ill septic patients.
Further investigation will, however, be necessary for clari-
fying these conclusions because the number of the
patients we investigated was limited.
Acknowledgement
Most of this study was presented at the 18th and 19th International
Symposia on Intensive Care and Emergency Medicine, Belgium, March
1998 and March 1999, respectively.
References
1. Potter van Loon BJ, Kluft C, Radder JK, Blankenstein MA, Mein-
ders AE: The cardiovascular risk factor plasminogen activator
inhibitor type 1 is related to insulin resistance. Metabolism
1993, 42:945–949.
2. Vague IJ, Alessi MC, Vague P: Increased plasma plasminogen
activator inhibitor-1 levels. A possible link between insulin
resistance and atherothrombosis. Diabetologia 1991, 34:457–
462.
3. Landin K, Tengborn L, Smith U: Elevated fibrinogen and plas-
minogen activator inhibitor (PAI-1) in hypertension are related
to metabolic risk factors for cardiovascular diseases. J Int
Med 1990, 227:273–278.
4. Landin K, Stigendal L, Eriksson E, Krotkiewski M, Risberg B,
Tengborn L, Smith U: Abdominal obesity is associated with an
impaired fibrinolytic activity and elevated plasminogen activa-
tor inhibitor-1. Metabolism 1990, 39:1044–1048.
5. Juhan-Vague I, Alessi MC, Vague P: Thrombogenic and fibri-
nolytic factors and cardiovascular risk in non-insulin-depen-
dent diabetes mellitus. Ann Med 1996, 28:371–380.
6. Schneider DJ, Absher PM, Neimane D, Russell JC, Sobel BE: Fib-
rinolysis and atherogenesis in the JCR: LA-cp rat in relation to
insulin and triglyceride concentrations in blood. Diabetologia
1998, 41:141–147.
7. Leithauser B, Matthias FR, Nicolai U, Voss R: Hemostatic abnor-
malities and the severity of illness in patients at the onset of
clinically defined sepsis. Possible indication of the degree of
endothelial cell activation? Intensive Care Med 1996, 22:
631–636.
8. Asakura H, Jokaji H, Saito M, Uotani C, Kumabashiri I, Morishita E,
Yamazaki M, Aoshima K, Matsuda T: Study of the balance
between coagulation and fibrinolysis in disseminated
intravascular coagulation using molecular markers. Blood
Coag Fibrinol 1994, 5:829–832.
Critical Care Vol 5 No 2 Hoshino et al
Available online />commentary review reports meeting abstracts
primary research
supplement
9. Inthorn D, Hoffmann JN, Hartl WH, Muhlbayer D, Jochum M:
Antithrombin III supplementation in severe sepsis: beneficial
effects on organ dysfunction. Shock 1997, 8:328–334.
10. Kidokoro A, Iba T, Fukunaga M, Yagi Y: Alterations in coagula-
tion and fibrinolysis during sepsis. Shock 1996, 5:223–228.
11. Mesters RM, Mannucci PM, Coppola R, Keller T, Ostermann H,
Kienast J: Factor VIIa a and antithrombin III activity during
severe sepsis and septic shock in neutropenic patients. Blood
1996, 88:881–886.
12. Fourrier F, Chopin C, Goudemand J, Hendrycx S, Caron C, Rime
A, Marey A, Lestavel P: Septic shock, multiple organ failure,
and disseminated intravascular coagulation. Compared
paterns of antithrombin III, protein C, and protein S deficien-
cies. Chest 1992, 101:816–823.
13. Gando S, Kameue T, Nanzaki S, Nakanishi Y: Disseminated intra-
vascular coagulation in a frequent complication of systemic
inflammatory response syndrome. Thromb Haemost 1996,
75:224–228.
14. Gando S, Nakanishi Y, Kameue T, Nanzaki S: Soluble thrombo-
modulin increases in patients with disseminated intravascular
coagulation and in those with multiple organ dysfunction syn-
drome after trauma: role of neutrophil elastase. J Trauma 1995,
39:660–664.
15. Nachman RL, Silverstein R: Hypercoagulable states. Ann Intern
Med 1993, 119:819–827.
16. Endo S, Inada K, Nakae H, Takakuwa T, Kasai T, Yamada Y,
Suzuki T, Taniguchi S, Yoshida M: Blood levels of endothelin-1
and thrombomodulin in patients with disseminated intravas-
cular coagulation and sepsis. Res Commun Mol Pathol Phar-
macol 1995, 90:277–288.
17. Pearson JD: The control of production and release of haemo-
static factors in the endothelial cell. Baillieres Clin Haematol
1993, 6:629–651.
18. Dawson S, Hamsten A, Wiman B, Henney A, Humphries S:
Genetic variation at the plasminogen activator inhibitor-1
locus is associated with altered levels of plasminogen activa-
tor inhibitor-1 activity. Arterioscler Thromb 1991, 11:183–190.
19. Nordt TK, Klassen KJ, Schneider DJ, Sobel BE: Augumentation
of synthesis of plasminogen activator inhibitor type-1 in arter-
ial endothelial cells by glucose and its implications for local
fibrinolysis. Arterioscler Thromb 1993, 13:1822–1828.
20. Maiello M, Boeri D, Podesta F, Cagliero E, Vichi M, Odetti P,
Adezati L, Lorenzi M: Increased expression of tissue plasmino-
gen activator and its inhibitor and reduced fibrinolytic poten-
tial of human endothelial cells cultured in elevated glucose.
Diabetes 1992, 41:1009–1015.
21. Pandolfi A, Iacoviello L, Capani F, Vitacolonna E, Donati MB,
Consoli A: Glucose and insulin independently reduce the fibri-
nolytic potential of human vascular smooth muscle cells in
culture. Diabetologia 1996, 39:1425–1431.
22. Schneider DJ, Sobel BE: Synergistic augumentation of expres-
sion of plasminogen activator inhibitor type-1 induced by
insulin, very-low-density lipoproteins, and fatty acids. Coro-
nary Artery Dis 1996, 7:813–817.
23. Chen YQ, Su M, Walia RR, Hao Q, Covington JW, Vaughan DE:
Sp1 sites mediate activation of the plasminogen activator
inhibitor-1 promotor by glucose in vascular smooth muscle
cells. J Biol Chem 1998, 273:8225–8231.
24. Members of the American College of Chest Physicians/Society of
Critical Care Medicine Consensus Conference Committee. Chest
1992, 101:1644–1655.
25. Haraguchi Y. General discussion. Multiple organ failure IV:
DIC bleeding from digestive tract. J Jpn Assoc Crit Care Med
1990; 4:103–144
26. DeFronzo RA, Tobin JD, Andres AR: Glucose clamp technique:
a method for quantifying insulin secretion and resistance. Am
J Physiol 1979, 237:E214–E223
27. Shmueli E, Walker M, Alberti G: Normal splanchnic but
impaired peripheral insulin-stimulated glucose uptake in cir-
rhosis. Hepatology 1993, 18:86–95.
28. Aoki N, Hasegawa H. On the revised form of the comfirmatory
tests in diagnostic criteria for DIC. Annual Report of the
Research Committee on Coagulation disorders. Edited by Aoki N.
Tokyo: Ministry of Health and Welfare of Japan, 1988:37–41.
29. Haffner SM: Cardiovascular risk factors and the prediabetic
syndrome. Ann Med 1996, 28:363–370.
30. Lormeau B, Aurousseau MH, Valensi P, Paries J, Attali JR: Hyper-
insulinemia and hypofibrinolysis: effects of short term opti-
mized glycemic control with continuous insulin infusion in
type II diabetic patients. Metabolism 1997, 46:1074–1079.
31. Lemne C, De Faire U: Elevation of plasminogen activator
inhibitor 1 in borderline hypertension is linked to concomitant
metabolic disturbances. Eur J Clin Invest 1996, 26:692–697.
32. Jeng JR, Sheu WH, Jeng CY, Huang SH, Shieh SM: Impaired
fibrinolysis and insulin resistance in patients with hyperten-
sion. Am J Hypertens 1996, 9:484–490.
33. Cigolini M, Targher G, Seidell JC, Tonoli M, Schiavon R, Agostino
G, De Sandre G: Relationships of blood pressure to fibrinoly-
sis: influence of anthropometry, metabolic profile and behav-
ioural variables. J Hypertens 1995, 13:659–666.
34. Tomiyama H, Kimura Y, Mitsuhashi H, Kinouchi T, Yoshida H,
Kushiro T, Doba N: Relationship between endothelial function
and fibrinolysis in early hypertension. Hypertension 1998, 31:
321–327.
35. Bavenholm P, Proudler A, Silveira A, Crook D, Blomback M, de
Faire U, Hamsten A: Relationships of insulin and intact and
split proinsulin to haemostatic function in young men with
and without coronary artery disease. Thromb Haemost 1995,
73:568–575.
36. Calles-Escandon J, Mirza SA, Sobel BE, Schneider DJ: Induction
of hyperinsulinemia combined with hyperglycemia and hyper-
triglyceridemia increases plasminogen activator inhibitor 1 in
blood in normal human subjects. Diabetes 1998, 47:290–293.
37. Lindahl B, Asplund K, Eliasson M, Evrin P-E: Insulin resistance
syndrome and fibrinolytic activity: the northern Sweden
MONICA study. Int J Epidemiol 1996, 25:291–299.
38. Sobel BE, Woodcock-Mitchell J, Schneider DJ, Holt RE, Marut-
suka K, Gold H: Increased plasminogen activator inhibitor type
1 in coronary artery atherectomy specimens from type 2 dia-
betic compared with nondiabetic patients: a potential factor
predisposing to thrombosis and its persistence. Circulation
1998, 97:2213–2221.
39. Avellone G, Di Garbo V, Cordova R, Rotolo G, Abruzzese G,
Raneli G, De Simone R, Bompiani GD: Blood coagulation and
fibrinolysis in obese NIDDM patients. Diabetes Res 1994, 25:
85–92.
40. Carmassi F, Morale M, Puccetti R, De Negri F, Monzani F,
Navalesi R, Mariani G: Coagulation and fibrinolytic system
impairment in insulin dependent diabetes mellitus. Thromb
Res 1992, 67:643–654.
41. Bavenholm P, de Faire U, Landou C, Efendic S, Nilsson J, Wiman
B, Hamsten A: Progression of coronary artery disease in
young male post-infarction patients is linked to disturbances
of carbohydrate and lipoprotein matabolism and impaired fib-
rinolytic function. Eur Heart J 1998, 19:402–410.
42. Nordenhem A, Wiman B: Tissue plasminogen activator (tPA)
antigen in plasma: correlation with different tPA/inhibitor
complexes. Scand J Clin Lab Invest 1998, 58:475–784.
43. Yamauchi K, Suzuki T, Furumichi T, Saito H: Plasma tPA/PAI-1
complex and blood coagulability in patients with coronary
artery disease. Jpn Heart J 1992, 33:351–358.
44. Niwano H, Takahashi H, Tatewaki W, Wada K, Seki Y, Shibata A:
Behaviour of tissue plasminogen activator, plasminogen acti-
vator inhibitor 1 and their complex in various disease states.
Blood Coag Fibrinol 1992, 3:389–393.
45. Asakura H, Jokaji H, Saito M, Uotani C, Kumabashiri I, Morishita E,
Yamazaki M, Matsuda T: Change in plasma levels of tissue
plasminogen activator/inhibitor complex and active plasmino-
gen activator inhibitor in patients with disseminated intravas-
cular coagulation. Am J Hematol 1991, 36:176–183.
46. Sprengers ED, Kluft C: Plasminogen activator inhibitors. Blood
1987, 2:381–387.
47. Lijnen HR, Collen D: Mechanisms of physiological fibrinolysis.
Baillieres Clin Haematol 1995, 8:277–290.
48. Baars JW, de Boer JP, Wagstaff J, Roem D, Eerenberg-Belmer AJ,
Nauta J, Pinedo HM, Hack CE: Interleukin-2 induces activation
of coagulation and fibrinolysis: resemblance to the changes
seen during experimental endotoxemia. Br J Haematol 1992,
82:295–301.