Báo cáo khoa học: "Quantifying bedside-derived imaging of microcirculatory abnormalities in septic patients: a prospective validation study" docx
Bạn đang xem bản rút gọn của tài liệu. Xem và tải ngay bản đầy đủ của tài liệu tại đây (199.44 KB, 6 trang )
Open Access
Available online />R601
Vol 9 No 6
Research
Quantifying bedside-derived imaging of microcirculatory
abnormalities in septic patients: a prospective validation study
E Christiaan Boerma
1,2
, Keshen R Mathura
1
, Peter HJ van der Voort
2
, Peter E Spronk
1,3
and
Can Ince
1
1
Department of Physiology, Academic Medical Centre, University of Amsterdam, The Netherlands
2
Department of Intensive Care, Medical Centre Leeuwarden, The Netherlands
3
Department of Intensive Care, Gelre Ziekenhuizen Apeldoorn, The Netherlands
Corresponding author: E Christiaan Boerma,
Received: 10 Aug 2005 Accepted: 25 Aug 2005 Published: 22 Sep 2005
Critical Care 2005, 9:R601-R606 (DOI 10.1186/cc3809)
This article is online at: />© 2005 Boerma et al.; licensee BioMed Central Ltd.
This is an Open Access article distributed under the terms of the Creative Commons Attribution License ( />2.0), which permits unrestricted use, distribution, and reproduction in any medium, provided the original work is properly cited.
Abstract
Introduction The introduction of orthogonal polarization
spectral (OPS) imaging in clinical research has elucidated new
perspectives on the role of microcirculatory flow abnormalities in
the pathogenesis of sepsis. Essential to the process of
understanding and reproducing these abnormalities is the
method of quantification of flow scores.
Methods In a consensus meeting with collaboraters from six
research centres in different fields of experience with
microcirculatory OPS imaging, premeditated qualifications for a
simple, translucent and reproducible way of flow scoring were
defined. Consecutively, a single-centre prospective
observational validation study was performed in a group of 12
patients with an abdominal sepsis and a new stoma. Flow
images of the microcirculation in vascular beds of the sublingual
and stoma region were obtained, processed and analysed in a
standardised way. We validated intra-observer and inter-
observer reproducibility with kappa cross-tables for both types
of microvascular beds.
Results Agreement and kappa coefficients were >85% and
>0.75, respectively, for interrater and intrarater variability in
quantification of flow abnormalities during sepsis, in different
subsets of microvascular architecture.
Conclusion Semi-quantitative analysis of microcirculatory flow,
as described, provides a reproducible and transparent tool in
clinical research to monitor and evaluate the microcirculation
during sepsis.
Introduction
Recent clinical investigations have identified microcirculatory
abnormalities as a key component of the pathogenesis of sep-
sis [1,2]. These new insights have been mainly due to the intro-
duction of orthogonal polarization spectral (OPS) imaging by
Slaaf and co-workers [3], which uses green polarized light to
observe the microcirculation in vivo. Implementing OPS imag-
ing in a hand-held type of tool allowed us to observe the micro-
circulation of internal human organs for the first time [4,5]. The
central role of microcirculatory abnormalities in sepsis was elu-
cidated when OPS imaging was applied in critically ill patients.
Microcirculatory abnormalities were found in septic patients
by direct observation of the sublingual microcirculation by
means of OPS imaging [6,7], and such abnormalities were
found to be predictive in outcome [1].
An important issue in these investigations concerns the
method of quantifying the OPS movies of microvascular struc-
tures, to identify flow abnormalities associated with sepsis,
and evaluate its results. De Backer and co-workers [7,8] intro-
duced a semi-quantitative method, based on the number of
perfused vessels crossing three equidistant horizontal and ver-
tical lines. We also developed a score, based on a slightly dif-
ferent principle [6]. Both methods require subjective
assessment of flow to identify redistribution between different
sized micro vessels, especially the capillaries. Although these
methods have proven their worth in practice in identifying the
nature of microcirculatory dysfunction in sepsis, neither
CI = confidence interval; OPS = orthogonal polarization imaging.
Critical Care Vol 9 No 6 Boerma et al.
R602
method has yet been validated in terms of reproducibility. Fur-
thermore, there is a need for a more general method of analy-
sis, applicable to other microvascular structures with different
architecture than the usually investigated sublingual vascular
bed.
In this study, we present a consensus method of semi-quanti-
tative analysis of OPS imaging that is suitable for quantifying
microcirculatory abnormalities in critically ill patients in differ-
ent subsets of vascular beds: the sublingual region, villi of the
small bowel and crypts of the colon. We validated this method
for its interrater and intrarater variability and will discuss its
potency for future automated analysis by means of software
application.
Materials and methods
Specifications of the procedure
We called together six collaborative centres involved in clinical
microcirculation research in paediatric and adult intensive care
units in the Netherlands to come to a consensus about quan-
tification of microcirculatory abnormalities in direct observa-
tions obtained by means of OPS imaging. The six centres are
involved in OPS studies in various human organ tissues, such
as the sublingual region, gut villi, rectal mucosa, skin, conjunc-
tiva, gingival and brain tissue. This was important because we
wished to reach a consensus regarding a method that is appli-
cable to the various microcirculatory beds. The aim of the
process was to implement a systematic approach to the anal-
ysis of OPS derived microcirculatory flow imaging that would
allow identification and quantification of microcirculatory
abnormalities during critical illness. Preferably, the designed
method should be fit to analyse different microvascular struc-
tures that have variable vascular anatomy so as to avoid multi-
ple scoring systems for the evaluation of flow imaging in
specific organ oriented research. The scoring system should
have clear definitions that are easy to teach and have accept-
able interrater and intrarater variability. Storage of flow images
should be possible at all times and performed in a structured
way so that results can be discussed and (re)evaluated.
Finally, its application should avoid time-consuming process-
ing and its concept must be suitable for software analysis.
Definitions
To meet these premeditated qualifications we designed a sim-
ple semi-quantitative judgement of microvascular flow, which
distinguishes no flow (0), intermittent flow (1), sluggish flow
(2) and continuous flow (3). In case a microvascular subunit
contains different types of vessels with different diameters
(e.g. the sublingual vascular bed), these quantifications of flow
can be made per cohort of vessel diameter: small, 10 to 25
µm; medium, 26 to 50 µm; and large, 51 to 100 µm (Figs 1
and 2).
Imaging technique
The OPS technique, as described in detail elsewhere [9,10],
consists of a hand-held device that illuminates an area of inter-
est with polarized light, while imaging the remitted light
through a second polarizer (analyser) oriented in a plane pre-
cisely orthogonal to the plane of illumination. If a wavelength
within the haemoglobin absorption spectrum (e.g. 548 nm) is
chosen, red blood cells will appear dark and white blood cells
may be visible as refringent bodies. The vessel walls
themselves are not visualized directly and their imaging
depends, therefore, on the presence of red blood cells.
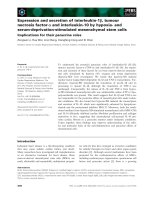
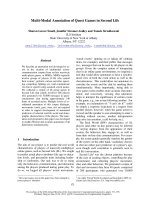
Figure 1
Orthogonal polarization imaging of a microvascular network; the sublin-gual microvascular architectureOrthogonal polarization imaging of a microvascular network; the sublin-
gual microvascular architecture. The image is divided in four quadrants
(a, b, c and d) with examples of vessel classification: small (s; 10 to 25
µm); medium (m; 26 to 50 µm); large (l; 51 to 100 µm). Objective 5×,
on screen 325×.
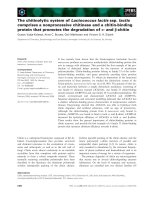
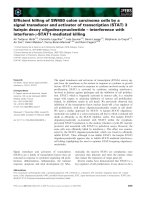
Figure 2
Orthogonal polarization imaging of a repeating vascular structure; the villi of the small intestineOrthogonal polarization imaging of a repeating vascular structure; the
villi of the small intestine. Objective 5×, on screen 325×.
Available online />R603
Imaging and analysis procedure
After gentle removal of saliva/faeces by an isotonic-saline-
drenched gauze, steady images of at least 20 seconds are
obtained and stored on digital videotape (SONY video walk-
man GV-D 1000E
®
), avoiding pressure artefacts. Subse-
quently, the images are captured in 5 to 10 s representative
video clips in avi format (sonyDVgate
®
). Video clips are ana-
lysed blindly and at random to prevent coupling between
images. Because heterogeneity of flow seems to be an impor-
tant characteristic of microvascular alterations during sepsis
[11], OPS images are obtained from three different regions
within the site of interest and each image is divided into four
equal quadrants (A,B,C and D). Quantification of flow is
scored per quadrant, for each cohort of vessel diameter if
applicable. The overall score, called microvascular flow index,
is the sum of each quadrant-score divided by the number of
quadrants in which the vessel type is visible (Tables 1 and 2).
Setting and patient selection
To validate the above process of quantification, we performed
a single centre prospective observational validation study in a
tertiary teaching hospital with a 23 bed mixed intensive care
unit. During an eight month period, patients with a new stoma
in the course of abdominal sepsis were included. Overt clinical
necrosis of the stoma was a contraindication for OPS imaging.
This particular model was chosen because a complete spec-
trum of microvascular flow abnormalities, ranging from no flow
(0) to normal flow (3), was expected to be visualized in poten-
tially three different microvascular subsets: the sublingual
region, gut villi in an ileostomy and crypts in a colostomy. A
local ethical and scientific committee waived the need for
informed consent as the observations were considered non-
invasive and no interventions were made.
Statistical analysis
Interrater and intrarater variability was calculated by kappa (κ)
cross tables for ordinal variables in Analyse-it
®
(Analyse-It
Software, Leeds, UK) and presented with 95% confidence
intervals (CI). The advantage of κ-coefficient calculation,
above establishing agreement alone, lies in the fact that the κ-
coefficient also takes into account the rule of chance [12,13].
The chance of agreement was estimated to be considerable
with such a limited number of ordinal variables. A κ-coefficient
>0.6 was considered good [13]. Weighted κ-coefficients (κ
w
)
were additionally calculated in order to take into account the
level of disagreement, giving weights to disagreement accord-
ing to the magnitude of the discrepancy [14].
Results
In an eight month period, 12 patients were included with a new
stoma as part of treatment of an abdominal sepsis. OPS imag-
ing was performed both in the sublingual region and in a stoma
during the intensive care unit stay on days 1, 3 and 7 after the
surgical procedure. In five patients an ileostomy, and in seven
patients a colostomy, was constructed. The mean APACHE II
score of the included patients was 19.7 (standard deviation ±
7.97) with an observed 45% intensive care unit and hospital
mortality. All patients were ventilated.
For assessment of interrater variability, each of two blinded
investigators scored the flow in each sample independently.
For the sublingual region there were 224 samples available. In
202 (90%) samples there was complete agreement; a scoring
difference of -1/+1 was found in 22 (10%) cases (Table 3).
The κ-coefficient for interrater variability in the sublingual
region was 0.85 (0.79–0.91; Table 4). As agreement in this
sample size appeared to be this good, further analysis was
done in a reduced sample size (arbitrarily a 50% reduction of
all available data was chosen). Stoma flow interrater agree-
ment was complete in 85/96 (89%) cases; a -1/+1 difference
occurred in 11/96 (11%) cases (Table 5) with a κ-coefficient
for the combined stoma site of 0.84 (95% CI 0.75–0.93;Table
4).
To assess intrarater variability, flow was scored two times
independently by the same investigator. For sublingual flow,
Table 1
Example of microvascular flow index calculation for a (sublingual) microvascular network
Flow Quadrant A Quadrant B Quadrant C Quadrant D MFI
Small 233210/4 = 2.5
Medium 133310/4 = 2.5
Large - 3 3 - 6/2 = 3
MFI, microvascular flow index.
Table 2
Example of microvascular flow index calculation for a repeating microvascular structure (gut villi)
Quadrant A Quadrant B Quadrant C Quadrant D MFI
Flow villi 233210/4 = 2.5
MFI, Microvascular flow index
Critical Care Vol 9 No 6 Boerma et al.
R604
complete intrarater agreement was found in 86/100 (86%)
samples, a -1/+1 difference in 12/100 (12%) and a -2/+2 dif-
ference in 2 (2%) cases (Table 6). The intrarater variability κ-
coefficient was calculated to be 0.78 (0.67–0.89) for the sub-
lingual region (Table 4). Stoma flow intrarater agreement was
complete in 64/72 (89%), a -1/+1 difference occurred in 8/72
(11%) cases (Table 7). The κ-coefficient for intrarater
variability for the combined stoma sites was 0.83 (0.71–
0.94;Table 4).
Discussion
We have shown that interrater and intrarater agreement and
the κ-coefficient for our method of semi-quantitative analysis of
OPS imaging of the microcirculation is high. This appears to
be true for different microvascular structures. These results
are important because the introduction of OPS flow imaging
in the field of clinical research has provided new perspectives,
unravelling the complex pathophysiology of microvacular dys-
function during sepsis. For the first time alterations of human
microcirculatory flow could be visualized in vivo [4,5]. In
combination with sublingual capnometry [15,16] or near infra-
red spectroscopy for measuring microcirculatory haemoglobin
saturation [17,18], OPS imaging can be used to investigate
the relationship between the microcirculation and metabolic
state during sepsis. Persistent microvascular disturbances in
the sublingual vascular bed during sepsis are associated with
poor outcome, providing a tool for detecting distributive
defects in sepsis, which could not achieved by conventional
monitoring of systemic hemodynamic- or oxygen-derived vari-
ables [1]. Furthermore, therapeutic interventions, such as the
use of volume resuscitation, vasopressors and vasodilators
[6,19], can be monitored at their potential level of impact, the
microcirculation. This promise can only be realised, however,
when the obtained images are interpreted uniformly and quan-
tification of microcirculatory flow abnormalities is reproducible.
To compare and evaluate OPS-derived flow imaging, it is
essential to quantify the complete spectrum of flow distur-
bances during sepsis and other shock models. Although direct
measurement of red blood cell velocity in a separate vessel is
very well feasible, its application does not do justice to the
complex microcirculatory flow patterns during sepsis, in which
heterogeneity of flow seems to be a key characteristic [11]. It
is important, therefore, to quantify a complete flow-pattern in a
specific organ site, preferably in more than one location.
Hence, the choice not only to derive OPS images from three
different locations within the organ site, but also to divide the
image itself into four quadrants. The definitions of different
flow patterns were kept simple (no flow, 0; intermittent flow, 1;
Table 3
Inter-observer agreement for flow score in the sublingual
region
Observer 1
Observer 2 Flow 0 Flow 1 Flow 2 Flow 3
Flow 0 16 2 0 0
Flow 1 2 22 3 0
Flow 2 0 4 65 8
Flow 3 0 0 3 99
Total 224
Table 4
Statistical data for semi-quantitative flow scoring in the
sublingual region and in combined stoma sites
Reliability Agreement Chance Kappa
a
κ
w
Sublingual
Interrater 0.90 0.35 0.85 (0.79–0.91) 0.90
Intrarater 0.86 0.37 0.78 (0.67–0.89) 0.81
Stoma
Interrater 0.89 0.28 0.84 (0.75–0.93) 0.89
Intrarater 0.89 0.36 0.83 (0.71–0.94) 0.89
a
Kappa plus 95% confidence intervals between brackets; κ
w
=
weighted kappa coefficient.
Table 5
Inter-observer agreement for flow score in the combined stoma
sites
Observer 1
Observer 2 Flow 0 Flow 1 Flow 2 Flow 3
Flow 0 9 3 0 0
Flow 1 0 21 1 0
Flow 2 0 6291
Flow 3 0 0 0 26
Total 96
Table 6
Intra-observer agreement for flow score in the sublingual
region
Observer 1
Observer 2 Flow 0 Flow 1 Flow 2 Flow 3
Flow 0 4000
Flow 1 0 10 2 2
Flow 2 0 1307
Flow 3 0 0 2 42
Total 100
Available online />R605
sluggish flow, 2; and continuous flow, 3) to avoid misconstruc-
tion. The overall good agreement in the quantification of flow,
per group of vessel diameter if applicable, validates its trans-
parency and reproducibility. Important for future implementa-
tion of this semi-quantitative flow score in clinical research or
even clinical practice, is the fact that disagreement of flow
quantification greater than +1/-1 was virtually absent, as
expressed by the weighted κ-coefficients, thus eliminating the
possibility of interchanging normal flow patterns with clearly
pathologic flow patterns.
During sepsis, a standstill, interruption or decrease of red
blood cell velocity might not be the only characteristic of
microcirculatory flow as hyperdynamic microcirculatory flow
patterns have also been observed. Because an increase in red
blood cell velocity may also lead to shunting, by means of the
inability of haemoglobin to off-load oxygen fast enough to tis-
sues as it passes through the microcirculation [20], it seems
important to distinguish normal flow from hyperdynamic flow
as well. With the current OPS technique being recorded at 25
frames per second, however, it is not possible to detect these
differences in flow adequately. In the future, these limitations
might be overcome by a new imaging technique with a
considerably better resolution: Sidestream Dark-Field imaging
[21]. Under these conditions, a category 4 might be added to
the flow variables.
The described type of analysis is especially suited for images
derived from non-fixed positions of a hand-held device. Under
these circumstances, the exact length of the vessel can not be
determined, preventing the exact quantification of red cell
velocity and vessel diameter. The highly improved image qual-
ity of Sidestream Dark-Field imaging has now made it possible,
however, to apply process algorithms much more effectively.
To date, we have developed image-processing software
designed for vessel identification in vascular images using a
process known as segmentation. Velocity is determined semi-
automatically after constructing space-time diagrams from the
centreline intensity of vessels in subsequent video frames. It
allows the user to query length, width and blood velocity of
individual vessel segments, thus creating a detailed statistical
report containing vascular parameters.
To avoid a complex set of non-comparable quantification sys-
tems for individual organ sites, the presented way of semi-
quantitative analyses was not only designed for the evaluation
of the behaviour of microcirculatory networks such as the sub-
lingual region and the brain [6], but also for repeating vascular
structures like those in the small intestine (villi), colon (crypts),
rectum (crypts), liver (sinuses) and gingival tissue [22]. Intra-
rater and interrater agreement and κ-coefficient for semi-quan-
titative flow analysis in stomas of the small intestine and colon
were as good as those for sublingual microcirculatory struc-
tures. This way of flow quantification seems, therefore, poten-
tially applicable to the analysis of OPS imaging in many more
microvascular structures not yet described in the literature.
Conclusion
Semi-quantitative analysis of OPS derived flow imaging, as
described, has a good intrarater and interrater reproducibility
for the evaluation of microcirculatory flow patterns during sep-
sis, both for microcirculatory networks and for repeating
microvascular structures. It provides a transparent and clini-
cally applicable non-invasive tool to monitor and evaluate the
microcirculation at the bedside.
Competing interests
The author(s) declare that they have no competing interests.
Authors' contributions
CB contributed to the design of the study, performed OPS
imaging and analysis and drafted the manuscript. KM coordi-
nated the consensus conference, provided technical support
and revised the manuscript. PV performed statistical analysis
and revised the manuscript critically. PS contributed to the
design of OPS imaging analysis and revised the manuscript.
CI conceived the study, participated in its design and coordi-
nation and helped to draft the manuscript. All authors read and
approved the final manuscript.
Table 7
Intra-observer agreement for flow score in the combined stoma
sites
Observer 1
Observer 2 Flow 0 Flow 1 Flow 2 Flow 3
Flow 0 9 0 0 0
Flow 1 1 3 1 0
Flow 2 0 1 32 1
Flow 3 0 0 4 20
Total 72
a
Kappa plus 95% confidence intervals between brackets; κ
w
=
weighted kappa coefficient.
Key messages
• Semi-quantitative analysis of OPS derived flow imaging,
as presented, has good interrater and intrarater
reproducibility.
• The described method of analysis is applicable both for
microcirculatory networks and for repeating microvascu-
lar structures.
• It provides a transparent, easy to use, clinical, non-inva-
sive tool to monitor and evaluate the microcirculation at
the bedside.
Critical Care Vol 9 No 6 Boerma et al.
R606
Acknowledgements
The authors are grateful to the other members of the collaborating
microcirculation-imaging research group for their contribution to the
consensus meeting. OLVG Amsterdam: DF Zandstra, Department of
ICU, Erasmus Medical Centre; J van Bommel and M Buise, Department
of Anaesthesiology; P Top, Department of Paediatric ICU. Anthonius
Ziekenhuis Nieuwegein: J de Graaff and P Elbers, Department of ICU.
Academic Medical Centre Amsterdam: KC Vollebregt, Department of
Gynaecology; JA Lindeboom, Department of Oral and Maxillofacial Sur-
gery; FA Pennings, Department of Neurosurgery; JG Dobbe, Medical
technology; B Atasever and PT Goedhart, Department of Physiology.
They would also like to express their gratitude to M Koopmans, research
nurse, Medical Centre Leeuwarden, for her dedicated and extensive
effort on OPS imaging analysis.
References
1. Sakr Y, Dubois MJ, De Backer D, Creteur J, Vincent JL: Persistent
microcirculatory alterations are associated with organ failure
and death in patients with septic shock. Crit Care Med 2004,
32:1825-1831.
2. Ince C: Microcirculation in distress: a new resuscitation end
point. Crit Care Med 2004, 32:1963-1964.
3. Slaaf DW, Tangelder GJ, Reneman RS: A versatile incident illu-
minator for intravital microscopy. Int J Microcirc Clin Exp 1987,
6:391-397.
4. Mathura KR, Alić L, Ince C: Initial clinical experience with OPS
imaging for observation of the human microcirculation. In
Yearbook of Intensive Care and Emergency Medicine Edited by:
Vincent JL. New York: Springer-Verlag; 2001:233-245.
5. Mathura KR, Bouma GJ, Ince C: Abnormal microcirculation in
brain tumours during surgery. Lancet 2001, 358:1698-1699.
6. Spronk PE, Ince C, Gardien MJ, Mathura KR, Oudemans-van
Straaten HM, Zandstra DF: Nitroglycerin in septic shock after
intravascular volume resuscitation. Lancet 2002,
360:1395-1396.
7. De Backer D, Creteur J, Preiser JC, Dubois MJ, Vincent JL: Micro-
vascular blood flow is altered in patients with sepsis. Am J
Respir Crit Care Med 2002, 166:98-104.
8. De Backer, Creteur J, Vincent JL: Use of orthogonal polarization
spectral imaging in intensive care. Orthogonal polarization
spectral imaging. Prog Appl Microcirc 2000, 24:104-109.
9. Groner W, Winkelman JW, Harris AG, Ince C, Bouma GJ, Mess-
mer K, Nadeau RG: Orthogonal polarization spectral imaging:
A new method for study of the microcirculation. Nat Med 1999,
5:1209-1212.
10. Harris AG, Sinitsina I, Messmer K: The cytoscanTM model E-II, a
new reflectance microscope for intravital microscopy: compar-
ison with the standard fluorescence method. J Vasc Res 2000,
37:469-476.
11. Ince C, Ashruf JF, Avontuur JA, Wieringa PA, Spaan JA, Bruining
HA: Heterogeneity of the hypoxic state in rat heart is deter-
mined at the capillary level. Am J Physiol 1993,
264:H294-H301.
12. Kundel HL, Polansky M: Measurement of observer agreement.
Radiology 2003, 228:303-308.
13. Cohen J: A coefficient of agreement for nominal scales. Educ
Psychol Meas 1960, 20:37-46.
14. Cohen J: Weighted kappa: nominal scale agreement with pro-
vision for scale disagreement or partial credit. Psychol Bull
1968, 70:213-220.
15. Weil MH, Nakagawa Y, Tang W: Sublingual capnometry: a new
non-invasive measurement for diagnosis and quantitation of
severity of circulatory shock. Crit Care Med 1999,
27:1225-1229.
16. Marik PE: Sublingual capnography: a clinical validation study.
Chest 2001, 120:923-927.
17. Schwarte LA, Fournell A, van Bommel J, Ince C: Redistribution of
intestinal microcirculatory oxygenation during acute hemodi-
lution in pigs. J Appl Physiol 2005, 98:1070-1075.
18. Buise MP, Ince C, Tilanus HW, Gommers D, van Bommel J: The
effect of nitroglycerin on microvascular perfusion and oxygen-
ation during gastric tube reconstruction. Anesth Analg 2005,
100:1107-1111.
19. Boerma EC, van der Voort PHJ, Ince C: Sublingual microcircula-
tory flow is impaired by the vasopressin-analogue terlipressin
in a patient with catecholamine-resistant septic shock. Acta
Anaesthesiol Scand 2005, 49:1387-1390.
20. Gutierrez G: The rate of oxygen release and its effect on capil-
lary O2 tension: a mathematical analysis. Respir Physiol 1986,
63:79-96.
21. Ince C: The microcirculation is the motor of sepsis. Critical
Care 2005, 9(suppl 4):S13-S19.
22. Lindeboom JAH, Mathura KR: Microvascular changes in alveolar
distraction osteogenesis. J Vasc Res 2004, 41(suppl 2):3.1.