Báo cáo y học: " Visualizing fusion of pseudotyped HIV-1 particles in real time by live cell microscopy" doc
Bạn đang xem bản rút gọn của tài liệu. Xem và tải ngay bản đầy đủ của tài liệu tại đây (2.52 MB, 14 trang )
BioMed Central
Page 1 of 14
(page number not for citation purposes)
Retrovirology
Open Access
Research
Visualizing fusion of pseudotyped HIV-1 particles in real time by live
cell microscopy
Peter Koch
1
, Marko Lampe
1,3
, William J Godinez
2
, Barbara Müller
1
,
Karl Rohr
2
, Hans-Georg Kräusslich*
1
and Maik J Lehmann
1
Address:
1
Department of Virology, Universitätsklinikum Heidelberg, Im Neuenheimer Feld 324, 69120 Heidelberg, Germany,
2
Department of
Bioinformatics and Functional Genomics, BIOQUANT, IPMB, University of Heidelberg, Im Neuenheimer Feld 267, 69120 Heidelberg, Germany
and
3
Division of Cell Biology, MRC Laboratory of Molecular Biology, Hills Road, Cambridge, CB20QH, UK
Email: Peter Koch - ; Marko Lampe - ;
William J Godinez - ; Barbara Müller - ; Karl Rohr - k.rohr@dkfz-
heidelberg.de; Hans-Georg Kräusslich* - ; Maik J Lehmann -
heidelberg.de
* Corresponding author
Abstract
Background: Most retroviruses enter their host cells by fusing the viral envelope with the plasma
membrane. Although the protein machinery promoting fusion has been characterized extensively,
the dynamics of the process are largely unknown.
Results: We generated human immunodeficiency virus-1 (HIV-1) particles pseudotyped with the
envelope (Env) protein of ecotropic murine leukemia virus eMLV to study retrovirus entry at the
plasma membrane using live-cell microscopy. This Env protein mediates highly efficient pH
independent fusion at the cell surface and can be functionally tagged with a fluorescent protein. To
detect fusion events, double labeled particles carrying one fluorophor in Env and the other in the
matrix (MA) domain of Gag were generated and characterized. Fusion events were defined as loss
of Env signal after virus-cell contact. Single particle tracking of >20,000 individual traces in two
color channels recorded 28 events of color separation, where particles lost the Env protein, with
the MA layer remaining stable at least for a short period. Fourty-five events were detected where
both colors were lost simultaneously. Importantly, the first type of event was never observed when
particles were pseudotyped with a non-fusogenic Env.
Conclusion: These results reveal rapid retroviral fusion at the plasma membrane and permit
studies of the immediate post-fusion events.
Background
Enveloped viruses enter host cells by membrane fusion at
the plasma membrane or at intracellular membranes. This
process is mediated by the interaction of cellular receptors
and Env glycoproteins. Numerous studies have revealed
detailed information about the proteins involved in
fusion for many viruses and have elucidated fundamental
principles of viral fusion mechanisms [1,2]. The dynamics
of the fusion process, however, is still incompletely char-
acterized. Furthermore, the early post-entry steps immedi-
ately following membrane fusion remain enigmatic for
many viruses.
Published: 18 September 2009
Retrovirology 2009, 6:84 doi:10.1186/1742-4690-6-84
Received: 22 April 2009
Accepted: 18 September 2009
This article is available from: />© 2009 Koch et al; licensee BioMed Central Ltd.
This is an Open Access article distributed under the terms of the Creative Commons Attribution License ( />),
which permits unrestricted use, distribution, and reproduction in any medium, provided the original work is properly cited.
Retrovirology 2009, 6:84 />Page 2 of 14
(page number not for citation purposes)
Previous investigations have employed bulk biochemical
assays or cell-cell fusion to study the viral fusion process
(for review see [3]). More recently, single particle tracking
of fluorescently labeled viruses has become possible and
has been successfully applied to characterize the entry of
various viruses (for review see [4]). In most cases, the
lipophilic dye DiD was used for labeling the membrane of
enveloped virus particles [5-7]. As DiD is incorporated
into the outer leaflet of the membrane its redistribution
after virus-cell contact indicates primarily the lipid mixing
of the contacting leaflets (termed hemifusion) and not the
formation of the fusion pore [7].
HIV-1 entry, as well as entry of many other retroviruses,
has long been believed to occur exclusively at the plasma
membrane. More recently, however, productive infection
by pH-independent, clathrin-dependent endocytosis of
HIV-1 has also been reported [8] and was recently sug-
gested to constitute the only route of productive entry [9].
We have developed a system to study the dynamics of
HIV-1 entry based on fluorescent live cell microscopy, in
which the MA domain of the main structural protein Gag
is labeled by fusion to a fluorescent protein [10]. MA lines
the inner surface of the viral membrane and is believed to
separate from the core of the virion upon membrane
fusion. The inner core is subsequently transformed into
the reverse transcription complex, and after reverse tran-
scription it is again transformed into the viral preintegra-
tion complex (PIC) (for review see [11]). These
nucleoprotein complexes are poorly characterized, but are
believed to contain no or only a small proportion of MA
molecules [12]. MA is believed to remain at the site of
fusion from where it is redistributed within the mem-
brane or into the cytosol [13]. To allow for direct detec-
tion of fusion events, the fluorescent label at the MA
domain was combined with a differently colored label at
the core-associated viral protein R (Vpr), which remains
associated with the PIC during cytoplasmic transport to
the nucleus [14]. Fusion should thus be accompanied by
a rapid separation of the two labels in this system. How-
ever, tracking >10,000 individual interactions at high time
resolution did not yield clear separation events [15]. Since
this may be due to the low fusogenicity of HIV, the possi-
bility to pseudotype retroviruses was applied, and HIV-1
particles carrying the highly fusogenic glycoprotein of
vesicular stomatitis virus (VSV-G) were analyzed. This
approach resulted in readily detectable bulk color separa-
tion over time with the mRFP.Vpr that accumulated at the
nuclear membrane and MA.eGFP exhibiting mostly cyto-
plasmic staining [15]. Thus, efficient fusion must have
occurred, but only sporadic events of color separation
were observed for individual particles. This raised the
question as to whether membrane fusion may not be
accompanied by immediate separation of the bulk of MA
from the viral core. Furthermore, pseudotyping with VSV-
G diverted the entry route of the particles to a pH depend-
ent endocytic pathway, thereby potentially influencing
subsequent events.
For these reasons we developed a system where the fate of
the viral membrane can be unequivocally determined. We
made use of fluorescent HIV particles, pseudotyped with
an Env protein from eMLV. This approach provides two
main advantages: First, MLV Env carrying particles target-
ing DFJ-8 cells with a high surface density of murine cati-
onic aminoacid transporter (mCAT-1, the receptor for
eMLV) represent one of the most efficient systems for
studying pH independent fusion at the plasma membrane
[16]. Second a well characterized fluorescent variant of
eMLV Env is available which has been shown to mediate
fusion with wild-type efficiency and remains associated
with the host cell membrane after fusion [16]. We have
studied the dynamics of retroviral fusion and investigated
immediate post fusion events by live cell imaging using
double labeled pseudotypes carrying the fluorescent vari-
ant of eMLV Env and the MA domain of HIV-1 Gag fused
to another fluorescent protein. Here, we report single par-
ticle tracking of >20,000 individual traces of double-fluo-
rescent pseudotyped HIV recording 28 events of color
separation and 45 additional events, where both colors
were lost simultaneously.
Results
Characterization of double labeled HIV-1 pseudotypes
To monitor the fusion of retroviral particles at the plasma
membrane of living cells, we established a double labe-
ling strategy in which a fluorescent label in the MA
domain of HIV-1 Gag (MA.mCherry) was combined with
another fluorescent label fused to eMLV Env (Env.YFP),
which was then used to pseudotype HIV-1 particles. Both
approaches have been described individually for func-
tional labeling of viral particles [10,16], but had not been
combined previously. Our initial aim was, therefore, to
determine double labeling efficiency and its effects on
viral infectivity. Previously, it was reported that an equi-
molar mixture of native and labeled HIV-1 Gag resulted in
particles exhibiting wild-type infectivity, while particles
made only from labeled Gag were significantly less infec-
tious [10]. We therefore co-transfected 293T cells with an
HIV-1 proviral plasmid lacking a functional env gene and
its respective derivative carrying mCherry in the gag gene
at an equimolar ratio and determined the optimal
amount of co-transfected plasmid encoding Env.YFP by
titration experiments. After sedimentation through a
sucrose cushion, viral particles were immobilized on
fibronectin-coated glass coverslips and imaged by epiflu-
orescence microscopy to determine the degree of co-local-
ization of the mCherry and YFP signals. Co-transfection of
a two fold molar excess of Env.YFP encoding DNA
resulted in at least 35% of all MA.mCherry carrying parti-
Retrovirology 2009, 6:84 />Page 3 of 14
(page number not for citation purposes)
cles being detectably labeled also by Env.YFP (data not
shown). Co-transfection of higher amounts of Env.YFP
encoding plasmid affected the expression efficiency of the
HIV derived plasmids, so that the production of particles
was significantly reduced. The correct protein composi-
tion and the degree of Gag processing were confirmed for
all particle preparations by immunoblotting using antis-
era against HIV-1 capsid (CA), MLV Env, and the fluores-
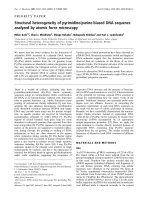
cent proteins mCherry and GFP, respectively (Figure 1).
Analysis of Env-dependent fusion by fluorescence
microscopy
In order to visualize individual retroviral fusion events at
the plasma membrane at high time resolution it is advan-
tageous to maximize the number of productive virus-cell
contacts occurring in the focal plane of the microscope.
Thus, virus-cell interactions were monitored by epifluo-
rescence microscopy after allowing cells to settle on top of
a layer of particles bound to fibronectin coated cham-
bered cover glasses rather than adding virus to adherent
cells. This approach avoided displacement of cell surface
associated viruses out of the microscopic focal plane due
to cellular movement or membrane ruffling, which would
lead to changes in signal intensities. Furthermore, this
setup serves to synchronize the time of virus-cell contact.
To determine whether virus particles that were immobi-
lized on the glass surface retained infectivity, a β-galactos-
idase based infection assay was performed. To this end,
equal amounts of MLV derived vector particles bearing
lacZ as a reporter gene and carrying different variants of
MLV Env were attached to the fibronectin coated chamber
slide. DFJ-8 cells were seeded onto the dense particle coat
and β-galactosidase activity was determined by X-gal
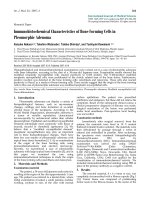
staining after 48 hours of incubation (Figure 2A). Glass
bound MLV particles retained their capacity to infect DFJ-
8 cells using this experimental setup. Comparison of vec-
tor particles carrying different Env proteins revealed no
significant impact on transduction efficiency of the YFP or
mCherry label fused to Env (Figure 2A and 2B), which is
in agreement with data from Sherer and colleagues [16].
As a control, we prepared MLV-based vector particles
whose fusion capabilities were impaired by a histidine-to-
arginine change at position 8 (H8R) within the YFP tagged
envelope protein (referred to as Env.YFP.H8R). This muta-
tion has been shown previously to block infection by
arresting virus-cell fusion at the hemifusion state [17]. As
indicated in Figure 2B, the H8R mutation reduced trans-
duction efficiency compared to wild-type by a factor of
eight, while particles lacking Env did not lead to detecta-
ble transduction.
We compared the infection efficiency of immobilized par-
ticles with that of free particles to determine whether
adherence to the cover slip affected the capacity of pseu-
dotyped particles to infect DFJ-8 cells. Parallel infections
were performed in which either particles or DFJ-8 cells
were pre-bound to fibronectin-coated cover slips and cells
or viruses were seeded on top. Infected cells were subse-
quently quantified by staining for β-galactosidase activity
and infectivity was normalized to the particle input deter-
mined by measuring the reverse transcriptase activity of
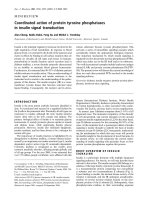
Immunoblot analysis of purified particlesFigure 1
Immunoblot analysis of purified particles.
pCHIV.mCherry derived particles pseudotyped with the indi-
cated Env proteins were purified from the supernatant of
293T cells co-transfected with the respective plasmids by
ultracentrifugation through a sucrose cushion. Samples were
separated by SDS-PAGE (12.5% acrylamide), transferred to
nitrocellulose according to standard procedures and proteins
were detected by quantitative immunoblot (Li-Cor) using the
following antisera: anti-CA (top panel); anti-mCherry (sec-
ond panel); anti gp70 (third panel); anti-GFP (bottom panel).
Positions of molecular mass standards (in kDa) are shown at
the left.
Retrovirology 2009, 6:84 />Page 4 of 14
(page number not for citation purposes)
immobilized and free particles, respectively. These experi-
ments revealed that the infectivity of the immobilized par-
ticles was equal or slightly better than that of the free
particles (data not shown).
Next, we determined whether virus-cell fusion can be
monitored by fluorescence microscopy using our experi-
mental setup. Double labeled pseudotyped HIV-1 parti-
cles carrying MA.mCherry and Env.YFP were bound to
fibronectin coated cover glasses and incubated with DFJ-8
cells. After 2 and 30 minutes, respectively, cells were fixed
and images were recorded by performing z-stack series
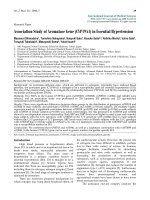
through the adhered cells (Figure 3). It was described pre-
viously that Env.YFP is transferred to the plasma mem-
brane of the host cell upon fusion [16]. This was also
observed for the Env.YFP pseudotyped HIV particles
whose incubation with target cells led to a gradually
increasing diffuse YFP staining of the plasma membrane
(Figure 3A). Transfer of Env.YFP into the target cell mem-
brane was fusion dependent and was not detected for the
fusion impaired particles harboring the H8R mutation
(Env.YFP.H8R; Figure 3B). Thirty minutes after cell set-
tling, a punctate YFP and mCherry signal was seen at the
cell surface, but neither a YFP nor a mCherry membrane
stain was detectable (Figure 3B). As another control, dou-
ble labeled particles deficient in the viral protease were
used. These particles are fusion-defective because cleavage
of the R-peptide from the MLV Env protein by the viral
protease is necessary to render Env fusion-competent. By
using a cell-cell fusion assay, particles bearing Env.YFP
and deficient in protease (referred to as Env.YFP.PR(-))
were at least tenfold less fusion-competent than Env.YFP
(data not shown). No significant membrane staining was
detectable when cells were incubated for 30 minutes with
these particles (Figure 3C). Furthermore, no Env.YFP
membrane staining was detected when eMLV receptor
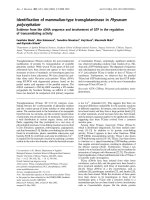
Infectivity of glass-bound VLPsFigure 2
Infectivity of glass-bound VLPs. MLV-based vector particles carrying the β-galactosidase marker gene and the indicated Env
proteins were purified from the supernatants of transfected 293T cells. Comparable amounts of particles (as determined by
anti-MLV CA immunoblot) were adhered to fibronectin-coated coverslips, and DFJ-8 cells were allowed to settle on top of the
VLP coated surface. (A) Following 48 hours of incubation at 37°C, cells were fixed and stained for β-galactosidase activity. (B)
Infected cells were counted in 5 fields of view each (corresponding to ~500 cells) per experiment. The graph shows mean val-
ues and standard deviations from three independent experiments.
Retrovirology 2009, 6:84 />Page 5 of 14
(page number not for citation purposes)
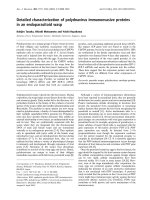
Membrane staining of cells resulting from fusion with fluorescently labeled VLPsFigure 3
Membrane staining of cells resulting from fusion with fluorescently labeled VLPs. DFJ-8 cells were incubated on
chambered coverslips coated with VLPs (corresponding to 500 ng p24) labeled with MA.mCherry carrying the indicated Env
derivatives: (A) Env.YFP; (B) Env.YFP.H8R; (C) Env.YFP.PR(-). Cells were fixed 2 and 30 minutes after virus-cell contact,
respectively, and z-stacks were recorded. Maximum projections of deconvolved z-series are shown. White lines indicate the
outline of the cell as determined by bright-field microscopy. Scale bars correspond to 10 μm.
Retrovirology 2009, 6:84 />Page 6 of 14
(page number not for citation purposes)
deficient parental DF-1 cells were used instead of DFJ-8
cells (data not shown). Taken together, our results indi-
cate that the chosen setup is appropriate for investigating
viral fusion at the cell membrane by live cell microscopy.
Visualization of individual fusion events by single particle
tracing
After monitoring overall virus-cell fusion by fluorescence
microscopy, we were next interested in visualizing and
characterizing single particle fusion events at the plasma
membrane. To this end, Env.YFP and MA.mCherry double
labeled particles were again immobilized on fibronectin
coated cover glasses, and DFJ-8 cells were allowed to settle
onto the virus like particle (VLP) coat. Image acquisition
was started immediately after cell attachment to the glass
bottom (defined as time point 0, Figure 4). Time resolved
epifluorescence microscopy revealed a continuous reduc-
tion in the number of YFP signals originating from single
virions, indicating viral fusion at the cell membrane. The
number of YFP-labeled particles in areas of the cover glass
where no cell had settled remained, on the other hand,
largely unchanged (Figure 4A). A time series of images fol-
lowing settling of a cell onto the particle coat revealed a
gradually appearing diffuse membrane stain (see Addi-
tional file 1, 2 and 3), indicating the cumulative effect of
multiple individual fusion events. Interestingly, the signal
corresponding to the labeled MA protein was not lost con-
comitantly with the Env.YFP signal, and a punctate pat-
tern of mCherry on the cell surface remained even after 30
minutes of incubation (Figure 4A). Only a faint diffuse
YFP membrane stain was observed for Env.YFP.H8R bear-
ing particles upon prolonged incubation (30 minutes)
and the punctate Env.YFP signal remained largely
unchanged, indicating that many fewer particles had
fused with the plasma membrane (Figure 4B). There was
also no significant change in the MA.mCherry signal (Fig-
ure 4B). The same was observed for protease-defective par-
ticles (Figure 4C).
Quantification of the red and green signal intensities orig-
inating from MA.mCherry and Env.YFP, respectively, of at
least 400 individual double labeled particles as a function
of time revealed a significant loss of the Env-associated
YFP signal relative to the MA-associated mCherry signal
for particles bearing fusion-competent Env.YFP (approxi-
mately 50% decrease after 20 minutes) as depicted in Fig-
ure 4E. To determine whether loss of the Env-YFP signal
could be due to quenching of the pH-sensitive fluoro-
phore YFP upon exposure of endocytosed particles to the
low pH of the endosome, experiments were performed in
the presence of ammonium chloride which prevents
endosomal acidification (Figure 4D). As indicated in Fig-
ure 4E, ammonium chloride treatment had no significant
impact on the loss of the Env.YFP signal over time. Fur-
thermore, specific loss of the Env-associated signal could
also be observed when Env was labeled with the less pH-
sensitive protein mCherry (data not shown). Immobi-
lized particles which had no cell contact did not display a
significant loss of the Env.YFP signal, which indicates that
photobleaching also did not contribute significantly to
the loss of YFP fluorescence (indicated as background in
Figure 4E). As expected, fusion impaired particles
(Env.YFP.PR(-) and Env.YFP.H8R bearing VLPs, respec-
tively) showed only a minor reduction of the YFP signal
(approximately 10% decrease in the first 20 minutes after
cell contact).
The observation of a persistent MA signal after loss of the
viral membrane was not expected considering current
models of retroviral entry. To determine whether the MA
shell could have been artificially stabilized by fusion of
the fluorescent protein, we analyzed MA shell dissociation
in vitro using two different approaches. First, the Env.YFP/
MA.mCherry labeled particles were adhered to a glass
cover slip, incubated with 0.05% Triton X-100 and the
number of single and double labeled particles was
recorded over time. These experiments showed a rapid
and concomitant loss of both signals upon detergent
addition (Additional file 4A). Second, we made use of a
FRET based assay to monitor the time course of MA shell
dissociation. Purified particles labeled with a mixture of
MA.eCFP and MA.eYFP displayed a strong FRET signal
which rapidly disappeared upon disruption of the particle
membrane with 0.05% Triton X-100. As expected, stabili-
zation of the Gag shell by prevention of Gag processing
prevented the decay of this FRET signal. Dissociation of
the mature MA.XFP shell (indicated by a fluorescence
spectrum resembling that of free eCFP) was complete
within ~10 seconds at 37°C (Additional file 4B).
After validating the experimental setup under bulk condi-
tions, we proceeded to monitor single fusion events in
real time. Immediately after DFJ-8 cells had contacted the
layer of immobilized double labeled particles, imaging
was initiated at 1 frame/second in each channel. The
Additional files 5 and 6 show a time course of the initial
events after virus-cell contact. Figure 5A depicts represent-
ative still images of the movie shown in Additional file 5.
The white circle in Figure 5A identifies a double labeled
particle which rapidly lost its Env.YFP fluorescence within
the first 12 seconds after cell contact, while the
MA.mCherry intensity remains unaltered, manifested by a
change in particle color from yellow to red (Figure 5A).
We developed an automated tracking approach to obtain
quantitative data on a large number of individual virus-
cell contacts that was adapted to monitor fluorescence
intensities of individual particles in two channels at low
signal-to-noise ratio [18]. Figure 5B shows changes in sig-
nal intensities over time for the particle indicated in Figure
5A. To acquire a statistically relevant data set, we tracked
Retrovirology 2009, 6:84 />Page 7 of 14
(page number not for citation purposes)
Figure 4 (see legend on next page)
Retrovirology 2009, 6:84 />Page 8 of 14
(page number not for citation purposes)
more than 20,000 individual double labeled particles. As
summarized in Table 1, 28 color separation events indi-
cating fusion were identified in the case of Env.YFP carry-
ing particles, whereas no color separation was detected
when more than 11,000 particles bearing the fusion
impaired Env.YFP.H8R mutant were tracked. In 13 of
those 28 events, mobility of the particle precluded contin-
ued observation of the MA signal. From the remaining 15
events, 10 resulted in a stable punctate MA signal over the
remaining observation period. Examples of individual tra-
jectories of fusion events are shown in the Additional file
7. Interestingly, 45 events of simultaneous loss of both
colors were detected in the case of VLPs harboring
Env.YFP, while only twelve such events were observed for
particles bearing the fusion defective Env.YFP.H8R
mutant.
Discussion
This study aimed at monitoring individual fusion events
of eMLV Env pseudotyped HIV-1 particles and at analyz-
ing the subsequent fate of the sub-membrane MA layer. So
far, the dynamics of virus-cell fusion has been predomi-
nantly studied using cell-cell fusion assays in which cells
expressing a viral Env protein fuse with cells expressing
the cellular receptor for the virus [19-21]. However, the
stoichiometry of Env and receptor as well as the geometry
of the fusion area between two similarly sized cells do not
accurately reflect the events occurring in the fusion
between a small virion and a much larger cell. Analysis of
cell-cell fusion events revealed an average half-time of 10
to 20 minutes [22,23]. Scoring for loss of fluorescent Env
molecules from double labeled HIV/eMLV pseudotypes,
28 fusion events were identified in the present study; and
individual fusion events were already observed within sec-
onds after the first virus-cell contact. This result is in agree-
ment with a previous study, in which fusion of individual
HIV-1 Env pseudotyped viruses labeled with the
lipophilic dye DiD and GFP attached to the NC domain of
Gag was monitored after binding to target cells at low
temperature. These authors also observed initial fusion
events within the first minute after shifting the tempera-
ture to 37°C [6], and they concluded that virus-cell fusion
proceeds without significant delay during rising tempera-
ture. Thus, virus-cell fusion appears to be kinetically dif-
ferent from cell-cell fusion.
Our approach involved pseudotyping of fluorescent HIV-
1 particles carrying a fluorophor in the MA domain of Gag
with fluorescent eMLV Env. Both modifications have been
shown to be compatible with particle formation and
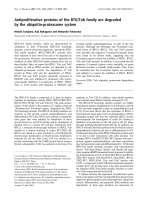
Relative loss of the Env signal in the particle population induced by cell contactFigure 4 (see previous page)
Relative loss of the Env signal in the particle population induced by cell contact. VLPs labeled with Env.YFP and
MA.mCherry were bound to fibronectin coated chambered coverslips and incubated under live cell imaging conditions at 37°C.
Particles bound to the cover slip were visualized by epifluorescence microscopy. DFJ-8 cells were added, and the moment of
attachment of the cells to the coverslip was defined as time point 0. Incubation was continued at 37°C, and images were
recorded at 1 frame/min. Please note that due to the experimental setup only single slices within the focal plane are depicted.
(A) shows individual images of a cell on a VLP layer carrying Env.YFP recorded at the indicated time points. The outline of the
cell as determined by bright field microscopy is indicated in white. Note that for both time points the same cell is shown, but
the cellular morphology is changing in the early phase of attachment. (B) shows a control experiment, using fusion impaired
VLPs double labeled with Env.YFP.H8R and MA.mCherry. (C) shows a control experiment, using double labeled VLPs deficient
in the viral protease. (D) shows a control experiment using the same double labeled VLPs as in (A) in the presence of 30 mM
NH
4
Cl. Scale bars in all depicted images correspond to 10 μm. (E) Color separation of double labeled particles over time.
Images recorded at the indicated time points were evaluated using an automated tracking software. The number of red and
green punctuated signals, originating from MA.mCherry and YFP-labeled Env, respectively, were determined for at least 400
single particles in three independent experiments, and the total number of red and green signals per image was quantified. The
plot shows the ratio between the number of green and red signals determined as a measure for the bulk amount of double
labeled particles. Quantification in regions covered by cells is shown for particles carrying Env.YFP in the absence (green) and
presence of NH
4
Cl (grey), for particles carrying Env.YFP.H8R (orange) and for Env.YFP.PR(-) particles (red), respectively. As
control, the same quantitative analysis was performed for the background signal of particles in areas where no cells had settled
(black).
Table 1: Summary of the automated tracking results.
Env.YFP Env.YFP.H8R
Tracks (total) 21054 11609
Fusions events 28 0
Simultaneous loss of both colors 45 12
The table represents the total number of all particles tracked by an
automated tracking software [18], the number of monitored fusion
events and the number of particles, where both colors were lost
simultaneously. Only particles bearing Env.YFP and Env.YFP.H8R as a
fusion defective control have been analyzed.
Retrovirology 2009, 6:84 />Page 9 of 14
(page number not for citation purposes)
infectivity [10]. Env is a membrane-embedded glycopro-
tein that is expected to remain attached to the plasma
membrane after fusion. Accordingly, progressive plasma
membrane labeling was observed upon incubation of
DFJ-8 target cells with particles carrying wild-type Env, but
not with particles carrying fusion-impaired or -defective
variants. MA is associated with the inner leaflet of the vir-
ion membrane and is generally believed to remain at the
plasma membrane after fusion before dissociating into
the cytosol. Thus, the combination chosen in this report
would not appear to be optimal for detecting color sepa-
ration upon fusion. However, previous studies had shown
bulk separation of labeled MA and inner core proteins
over time when double labeled particles were incubated
with permissive cells, while individual events of color sep-
aration were not detected [15]. These observations raised
the possibility that HIV-1 MA may remain attached with
the entering viral core for at least a short period after
Visualization of a fusion event in real timeFigure 5
Visualization of a fusion event in real time. (A) MA.mCherry and Env.YFP double labeled particles were immobilized
onto a fibronectin coated cover slip, and DFJ-8 cells were allowed to settle on the particle layer. Image acquisition with a frame
rate of 0.76 frames/sec was started as soon as the first cells reached the microscope slide (~1 minute after cell addition; see
Additional files 5 and 6). Still images taken from the movie shown in Additional file 5 at the indicated time points after the start
of image acquisition are shown. The particle of interest is indicated by a white circle. Scale bar = 10 μm. (B) Plots of fluores-
cence as a function of time. Depicted are normalized intensity values of the Env.YFP signal (green) and the MA.mCherry signal
(red) of the virus particle monitored in (A) (indicated by a white circle) and the background intensities of the Env.YFP channel
(grey). Time indicates the duration of virus-cell contact in seconds.
Retrovirology 2009, 6:84 />Page 10 of 14
(page number not for citation purposes)
membrane fusion. Consistent with this hypothesis, partic-
ulate MA signals were largely retained upon incubation of
target cells with immobilized double labeled particles,
while the Env.YFP signal was gradually lost over time.
Tracking individual double labeled particles identified 28
events of color separation, indicating that the MA layer
can dissociate from the surface glycoproteins upon mem-
brane fusion. It may then remain associated with the
entering viral core, at least for a short time. 10 of the 15
particles underwent a color separation event in the live
cell experiments and could subsequently be followed
until the end of the data acquisition. Consistent with our
hypothesis, the 10 particles displayed a punctate
MA.mCherry signal over the remaining observation
period (corresponding to up to 4 minutes after color sep-
aration). While this does not clearly exclude a dissociation
of the punctate MA.mCherry signal at later time points, it
suggests that the MA shell may at least be transiently sta-
ble after the envelope is lost. Preliminary results on triple
labeled particles carrying different fluorophors in Env, MA
and the viral core also support this conclusion, revealing
transient co-localization of MA and the entering core after
fusion-dependent loss of the Env layer (unpublished
observation). These events were rare, and it is currently
not clear whether they give rise to productive entry. MLV
pseudotypes efficiently fuse with DFJ-8 cells, however;
and they exhibit a high infectivity on these cells, making
it likely that at least some of the observed events represent
productive fusion. Conceivably, the observed color sepa-
ration events may constitute only a minority of all fusion
events with the majority not being scored because of con-
comitant loss of MA together with Env fluorescence. This
appears unlikely, however, because only 45 further events
of particles losing the fluorescent signal were detected. In
these cases both colors were lost simultaneously. Con-
comitant disappearance of both colors could be due to
loss of the particle from the focus plane (e.g. during endo-
somal uptake), which may explain why such events were
also seen for particles pseudotyped with fusion-defective
Env. The number of events was much lower in this case
(12 versus 45), indicating that at least some of the
observed events of simultaneous loss of both colors also
represent membrane fusion. Based on this study, such
events do not appear to be more common than separation
of Env and MA, however.
MA carries the plasma membrane trafficking moiety of
Gag and is thus responsible for Gag membrane associa-
tion in the assembly phase [24]. This is mediated by N-ter-
minal myristoylation, basic charges and a
phosphatidylinositol 4,5-bisphosphate binding site in
MA [25,26]. Membrane binding affinity is much lower for
the cleaved MA domain than for full-length Gag [27,28].
This is due to a myristoyl switch regulating exposure of the
acyl chain and due also to the lack of stable multimerisa-
tion of MA [29,30]. Accordingly, MA is rapidly stripped
from the viral core upon detergent treatment [31-33], and
only small amounts of MA have been detected in HIV pre-
integration complexes [11,12]. The bulk of MA can thus
be expected to dissociate from the membrane into the
cytoplasm as monomers or small oligomers after fusion.
Such redistribution of MA is in agreement with previous
observations using MA.eGFP/Vpr.mCherry labeled parti-
cles. After prolonged incubation, a diffuse cytoplasmic
distribution was observed for the MA.eGFP signal in this
case [15]. This redistribution does not always occur
directly upon fusion, however, since particulate
MA.mCherry signals could be tracked for up to several
minutes after loss of the Env signal in the present study.
The simplest explanation for this phenotype would be the
retention of a stable MA lattice at the fusion site with con-
comitant dissipation of Env molecules within the plasma
membrane. There is currently no evidence, however, for a
stable MA lattice. This hypothesis cannot explain the occa-
sionally observed rapid movement of MA clusters after
loss of the Env signal. Nor would this hypothesis be com-
patible with the temporary co-localisation of MA and the
core in triple labeled particles. Such co-localisation could
be due to a delayed opening of the fusion pore that allows
dissipation of Env proteins within the plasma membrane
while the core is still retained in the particle neck. A
delayed release of an aqueous marker was observed after
hemifusion had occurred in a previous study [6], and this
could also apply to the later stages of fusion pore opening.
Alternatively, the MA layer may dissociate from the mem-
brane and remain transiently associated with the viral core
after fusion and separation from the membrane. Further-
more, interaction of MA with the cytoplasmic tail of its
cognate Env protein may be important for regular uncoat-
ing. Future live cell microscopy studies using high time
resolution and fluorophors in different viral proteins will
shed light on these immediate post-fusion events which
are largely unexplored for most viruses.
Methods
Plasmids
The plasmid Friend MLV Env-YFP [16] was provided by
W. Mothes (Yale University School of Medicine). The
plasmids pMMP-LTR-LacZ and pMDoldGag-Pol were pro-
vided by Richard Mulligan (Department of Genetics, Har-
vard University). The plasmid 1765-H8R [17] that
expresses the MLV envelope protein bearing a histidine to
arginine mutation at position 8 was a gift from L. Albrit-
ton (University of Tennessee). To introduce the H8R
mutation into Env.YFP we performed site directed muta-
genesis using the Stratagene quick exchange kit (forward
primer: 5'-CTCAGTGGGCCGCCCGATTGGGGGCTA-
GAGTATC-3'; reverse primer: 5'-
GATACTCTAGCCCCCAATCGGGCGGCCCACTGAG-3')
resulting in the plasmid Env.YFP.H8R. Plasmid pCHIV
Retrovirology 2009, 6:84 />Page 11 of 14
(page number not for citation purposes)
and derivatives have been described previously [15]. The
plasmid pCHIV.Env(-).PR(-) carrying a point mutation in
the PR active site and a frameshift mutation in the env
gene was constructed by exchange of an AgeI-XhoI frag-
ment of pCHIV.PR(-) with the corresponding fragment of
pCHIV.Env(-).Env.YFP with an uncleaved R-peptide is
referred to as Env.YFP.PR(-).
Tissue culture and production of fluorescently labeled virus
particles
293T, DF-1 and DFJ-8 cells were cultured in Dulbecco's
modified Eagle's medium (DMEM; Invitrogen), supple-
mented with 10% fetal calf serum (FCS; Biochrom), pen-
icillin (100 IU/mL) and streptomycin (100 μg/mL). Live
cell imaging studies were performed in PBS supplemented
with 1 mM CaCl
2
, 0.5 mM MgCl
2
and 1% FCS. For pro-
duction of double fluorescently labeled particles, 293T
cells were co-transfected with a mixture of pCHIV.Env(-),
pCHIV.mCherry.Env(-), or their protease deficient vari-
ants, respectively, and the plasmid Env.YFP in a molar
ratio of 1:1:4 by calcium phosphate precipitation. Super-
natants were harvested at 36 hours post transfection and
filtered through a 0.45 μm filter. Particles were concen-
trated by ultracentrifugation through a 20% (w/w)
sucrose cushion. Virions were resuspended at 3 μl/ml cul-
ture supernatant in phosphate-buffered saline (PBS) sup-
plemented with 10% FCS and 10 mM HEPES pH 7.3,
frozen in liquid nitrogen, and stored at -80°C. Particle
yield was determined by ELISA quantitation of the p24
capsid protein using an in house ELISA. For Western blot-
ting, samples were separated by SDS-PAGE (16% acryla-
mide gels) and transferred by semi-dry blotting to an
activated PVDF membrane (Immobilon-FL, Millipore).
Viral proteins were detected by using polyclonal rabbit
antiserum raised against recombinant HIV-1 CA protein
or goat anti-Rauscher murine leukemia virus gp70 with
known cross-reactivity to MLV Env (provided by C. Buch-
holz, Paul Ehrlich Institute, Langen). Rat polyclonal
antiserum raised against mCherry was provided by Hein-
rich Leonhardt, LMU Munich. YFP was detected using rab-
bit polyclonal antiserum against recombinant GFP.
Detection and documentation were performed with the
Li-Cor Odyssey system according to the manufacturer's
instructions, using the appropriate secondary antibodies
provided by the manufacturer. MLV vector particles trans-
ducing β-galactosidase were quantified either by immu-
noblotting against the p30 CA protein (antiserum kindly
provided by C. Buchholz, Paul Ehrlich Institute, Langen)
or by measuring their reverse transcriptase activity using
the RETRO SYS, RT Activity Kit (Innovagen AB) as recom-
mended by the manufacturer.
Analysis of viral infectivity
To determine viral infectivity, MLV vector particles carry-
ing the lacZ gene and the indicated Env proteins were gen-
erated as described previously [16]. Briefly, 293T cells
were co-transfected with 5 μg of a plasmid encoding the
vector RNA (pMMP-LTR-LacZ), 5 μg plasmid encoding
wild-type Env or its labeled derivatives, respectively, and 5
μg plasmid encoding wild-type GagPol (pMDoldGag-Pol)
in a 10 cm dish by calcium phosphate precipitation. The
medium was changed 24 hours and 36 hours post trans-
fection, the medium was harvested and particles were
purified as described above. Comparable amounts of par-
ticles (as determined by p30 immunoblot) were adhered
to fibronectin-coated coverslips and DFJ-8 cells were
allowed to settle on top of the virus coated surface. After
48 hours cells were fixed with 4% PFA and β-galactosidase
activity was determined by X-gal staining. The percentage
of infected cells was determined by the ratio of stained
cells to total cells.
Microscopy
Epifluorescence microscopy was performed on a Zeiss
Axiovert 200 M microscope with a back illuminated EM-
CCD camera (Cascade II, Roper Scientific). Images were
acquired with Metamorph Software (Visitron). For live
cell imaging, cells were incubated at 37°C in a microscope
incubation chamber (EMBLEM, Heidelberg, Germany).
The microscopic setup has been described previously [15].
For experiments analyzing single particle fusion, eight-
chambered cover glasses (LabTek, Nunc) were coated with
fibronectin (Sigma) at a concentration of 100 μg/μl and
incubated at 37°C for 1 h. Fibronectin was removed and
the cover glasses were dried for 30 minutes and rinsed
with PBS. Fluorescent virus particles in PBS were subse-
quently added to the chambers. To detect overall changes
in the VLP population, we used a VLP amount corre-
sponding to 500 ng p24. For single event tracing, a VLP
amount corresponding to 100 ng p24 was used. VLPs were
allowed to adhere to fibronectin for 30 minutes at room
temperature before removal of the virus containing solu-
tion. Subsequently, a suspension containing approxi-
mately 5,000 DFJ-8 cells was added in pre-warmed PBS
supplemented with 1 mM CaCl
2
and 0.5 mM MgCl
2
and
1% FCS. Image acquisition was started when cells
attached to the bottom of the cover glasses. Cell positions
were documented by bright field images recorded imme-
diately before and after the time series. To block endo-
somal acidification, DFJ-8 cells were trypsinized and
incubated in the presence of 30 mM NH
4
Cl for 3 h at
37°C. Afterwards the cells were added to prebound VLPs
in PBS containing 30 mM NH
4
Cl and image acquisition
was started.
Automated particle tracking
For automated analysis a 2D tracking approach was devel-
oped to track dual-colored particles with a low signal-to-
noise ratio. Details of the particle localization and track-
ing algorithms are described elsewhere [18]. Briefly, parti-
Retrovirology 2009, 6:84 />Page 12 of 14
(page number not for citation purposes)
cles were localized using 2D Gaussian fitting and particle
positions and fluorescence intensities in both YFP and
RFP channels were recorded. The particles were tracked in
consecutive frames using a probabilistic scheme based on
the Kalman filter. To detect color separation or events
where both labels vanished simultaneously the intensity
profiles of each track in both green and red channel were
analyzed. For this, the intensity profiles, which were
derived from the automatically generated VLP traces of
both channels, were compared to the corresponding back-
ground level. the mean intensity level of both signals had
to differ by at least one standard deviation from the back-
ground signal to be considered as a double labeled parti-
cle. Color separation was defined as a drop of one signal
to background intensity. Supplemental method informa-
tion is available in Additional file 8.
Competing interests
The authors declare that they have no competing interests.
Authors' contributions
PK and ML performed the experimental work. MJL, BM
and HGK conceived the study and designed individual
experiments. WJG and KR developed the tracking soft-
ware. PK, BM, MJL and HGK wrote the manuscript. All
authors read and approved the final manuscript.
Additional material
Additional file 1
Movie of a cell settling onto a glass cover slip. Brightfield movie of a
DFJ-8 cell settling onto a glass cover slip coated with Env.YFP and
MA.mCherry double labeled particles (as shown in the Additional files 2
and 3). The time series was started at the time point of cell attachment to
the cover glass. Images were acquired at 1 frame per minute over a period
of 20 minutes. The video is played at a speed of 10 frames per second.
Click here for file
[ />4690-6-84-S1.mov]
Additional file 2
Movie illustrating the visualization of retroviral fusion indicated by
the gradual appearance of a diffuse membrane stain. Corresponding to
the Additional files 1 and 3 the movie S2 shows the Env.YFP signals
(green channel) of the coated Env.YFP and MA.mCherry double labeled
particles coated onto a glass cover slip while DFJ-8 cells attach to the cover
glass. The time series was started at the time point of cell attachment to
the cover glass. Images were acquired at 1 frame per minute over a period
of 20 minutes. The video is played at a speed of 10 frames per second.
Click here for file
[ />4690-6-84-S2.mov]
Additional file 3
Movie illustrating the distribution of HIV-1-Matrix during retroviral
fusion. Corresponding to the Additional files 1 and 2 the movie shows the
MA.mCherry signals (red channel) of the coated Env.YFP and
MA.mCherry double labeled particles coated onto a glass cover slip. Dur-
ing the observation time DFJ-8 cells attach to the cover glass (see Addi-
tional file 1). The time series was started at the time point of cell
attachment to the cover glass. Images were acquired at 1 frame per minute
over a period of 20 minutes. The video is played at a speed of 10 frames
per second.
Click here for file
[ />4690-6-84-S3.mov]
Additional file 4
Dissociation of mature and immature particles upon detergent treat-
ment. (A) Time course of particle dissociation induced by detergent treat-
ment under imaging conditions. Particles labeled with both MA.mCherry
and Env.YFP were adhered to a glass coverslip and imaged with a time
resolution of 1 frame/sec. At 15 sec after the start of observation (arrow)
Triton-X100 was added to a final concentration of 0.05%, and observa-
tion was continued. At 20, 30, 40 and 50 sec after the start of the obser-
vation, the numbers of punctuate double labeled (yellow line) and
MA.mCherry signals (red line) were quantified. As a control, double
labeled PR(-) particles were subjected to the same procedure, and the
punctate Gag.mCherry signal was quantified (blue line). The numbers
were normalized to the values obtained at the beginning of observation (t
= 0). The plot shows data from one representative experiment out of 3
independent experiments. (B) Time course of MA.XFP shell dissociation
in vitro monitored by FRET analysis. Mature or immature FRET reporter
particles labeled with eCFP and eYFP fused to the MA domain of Gag,
were prepared as described in the supplementary methods. Fluorescence
measurements were carried out at 25°C or 37°C, respectively, using an
excitation wavelength of 433 nm. At t = 0, Triton-X100 was added to a
final concentration of 0.05%, and fluorescence emission at 528 nm was
monitored over time. Volume corrected values were normalized to the
emission intensity recorded before detergent addition.
Click here for file
[ />4690-6-84-S4.tiff]
Additional file 5
Movie displaying an individual fusion event indicated by color sepa-
ration, corresponding to still images in Figure 5A. Env.YFP (green)
and MA.mCherry (red) labeled particles were coated onto a glass cover-
slip, and DFJ-8 cells were allowed to settle onto the virus particles. Image
acquisition with a time resolution of 0.76 frames/sec was started at the
time point of cell attachment to the coverslip. The video shows a section of
the movie covering 38 sec and is displayed at a speed of 10 frames per sec-
ond. The particle of interest is indicated by a white circle. While the
Env.YFP signal vanished within 15 sec after virus-cell contact, the label
of the MA domain remained punctated during the remaining period of
observation. Still images of the video are shown in Figure 5A.
Click here for file
[ />4690-6-84-S5.mov]
Retrovirology 2009, 6:84 />Page 13 of 14
(page number not for citation purposes)
Acknowledgements
We thank Walther Mothes, Rainer Pepperkok and Friedrich Frischknecht
for inspiring and helpful discussions and Oliver Fackler, Christian Buchholz
and Heinrich Leonhardt for their kind gifts of reagents. This study was sup-
ported in part by a grant from the DFG to BM and HGK (MU885/4-2) and
by the BMBF-funded project Viroquant (0313923). PK was supported
through the DFG Graduiertenkolleg GRK1188. HGK is a member of the
excellence cluster CellNetworks (EXC81), whose support of the imaging
facility is greatly acknowledged.
References
1. Hernandez LD, Hoffman LR, Wolfsberg TG, White JM: Virus-Cell
and Cell-Cell Fusion. Annual Review of Cell and Developmental Biol-
ogy 1996, 12:627-661.
2. Chan DC, Kim PS: HIV Entry and Its Inhibition. Cell 1998,
93:681-684.
3. Gallo SA, Finnegan CM, Viard M, Raviv Y, Dimitrov A, Rawat SS, Puri
A, Durell S, Blumenthal R: The HIV Env-mediated fusion reac-
tion. Biochimica et Biophysica Acta (BBA) - Biomembranes 2003,
1614:36-50.
4. Brandenburg B, Zhuang X: Virus trafficking - learning from sin-
gle-virus tracking. Nat Rev Micro 2007, 5:197-208.
5. Lakadamyali M, Rust MJ, Babcock HP, Zhuang X: Visualizing infec-
tion of individual influenza viruses. Proc Natl Acad Sci USA 2003,
100:9280-9285.
6. Markosyan RM, Cohen FS, Melikyan GB: Time-resolved imaging
of HIV-1 Env-mediated lipid and content mixing between a
single virion and cell membrane. Mol Biol Cell 2005,
16:5502-5513.
7. Melikyan GB, Barnard RJ, Abrahamyan LG, Mothes W, Young JA:
Imaging individual retroviral fusion events: from hemifusion
to pore formation and growth. Proc Natl Acad Sci USA 2005,
102:8728-8733.
8. Daecke J, Fackler OT, Dittmar MT, Krausslich HG: Involvement of
clathrin-mediated endocytosis in human immunodeficiency
virus type 1 entry. J Virol 2005, 79:1581-1594.
9. Miyauchi K, Kim Y, Latinovic O, Morozov V, Melikyan GB: HIV
Enters Cells via Endocytosis and Dynamin-Dependent
Fusion with Endosomes. Cell 2009, 137:433-444.
10. Muller B, Daecke J, Fackler OT, Dittmar MT, Zentgraf H, Krausslich
H-G: Construction and Characterization of a Fluorescently
Labeled Infectious Human Immunodeficiency Virus Type 1
Derivative. J Virol 2004, 78:10803-10813.
11. Cullen BR: Journey to the Center of the Cell. Cell 2001,
105:697-700.
12. Miller M, Farnet C, Bushman F: Human immunodeficiency virus
type 1 preintegration complexes: studies of organization and
composition. J Virol 1997, 71:5382-5390.
13. Farnet C, Haseltine W: Determination of Viral Proteins
Present in the Human Immunodeficiency Virus Type 1 Pre-
integration Complex. J Virol 1991, 65:1910-1915.
14. McDonald D, Vodicka MA, Lucero G, Svitkina TM, Borisy GG, Emer-
man M, Hope TJ: Visualization of the intracellular behavior of
HIV in living cells. J Cell Biol 2002, 159:441-452.
15. Lampe M, Briggs JAG, Endress T, Glass B, Riegelsberger S, Kräusslich
H-G, Lamb DC, Bräuchle C, Müller B: Double-labelled HIV-1 par-
ticles for study of virus-cell interaction. Virology 2007,
360:92-104.
16. Sherer NM, Lehmann MJ, Jimenez-Soto LF, Ingmundson A, Horner
SM, Cicchetti G, Allen PG, Pypaert M, Cunningham JM, Mothes W:
Visualization of retroviral replication in living cells reveals
budding into multivesicular bodies. Traffic 2003, 4:785-801.
17. Zavorotinskaya T, Qian Z, Franks J, Albritton LM: A Point Mutation
in the Binding Subunit of a Retroviral Envelope Protein
Arrests Virus Entry at Hemifusion. J Virol 2004, 78:473-481.
18. Godinez WJ, Lampe M, Wörz S, Müller B, Eils R, Rohr K: Determin-
istic and probabilistic approaches for tracking virus particles
in time-lapse fluorescence microscopy image sequences.
Medical Image Analysis 2009, 13:325-342.
19. Zimmerberg J, Blumenthal R, Sarkar D, Curran M, Morris S:
Restricted movement of lipid and aqueous dyes through
pores formed by influenza hemagglutinin during cell fusion.
J Cell Biol 1994, 127:1885-1894.
20. Plonsky I, Zimmerberg J: The initial fusion pore induced by bac-
ulovirus GP64 is large and forms quickly. J Cell Biol 1996,
135:1831-1839.
21. Munoz-Barroso I, Salzwedel K, Hunter E, Blumenthal R: Role of the
Membrane-Proximal Domain in the Initial Stages of Human
Immunodeficiency Virus Type 1 Envelope Glycoprotein-
Mediated Membrane Fusion. J Virol 1999, 73:6089-6092.
22. Frey S, Marsh M, Gunther S, Pelchen-Matthews A, Stephens P,
Ortlepp S, Stegmann T: Temperature dependence of cell-cell
fusion induced by the envelope glycoprotein of human
immunodeficiency virus type 1. J Virol 1995, 69:
1462-1472.
23. Melikyan GB, Markosyan RM, Hemmati H, Delmedico MK, Lambert
DM, Cohen FS: Evidence That the Transition of HIV-1 gp41
into a Six-Helix Bundle, Not the Bundle Configuration,
Induces Membrane Fusion. J Cell Biol 2000, 151:413-424.
24. Zhou W, Parent LJ, Wills JW, Resh MD: Identification of a mem-
brane-binding domain within the amino-terminal region of
human immunodeficiency virus type 1 Gag protein which
interacts with acidic phospholipids. J Virol 1994, 68:2556-2569.
25. Saad JS, Miller J, Tai J, Kim A, Ghanam RH, Summers MF: Structural
basis for targeting HIV-1 Gag proteins to the plasma mem-
brane for virus assembly. Proc Natl Acad Sci USA 2006,
103:11364-11369.
26. Ono A, Ablan SD, Lockett SJ, Nagashima K, Freed EO: Phosphati-
dylinositol (4,5) bisphosphate regulates HIV-1 Gag targeting
to the plasma membrane. Proc Natl Acad Sci USA 2004,
101:14889-14894.
Additional file 6
Movie displaying an individual fusion event indicated by color sepa-
ration, followed by disappearance of the punctate MA.mCherry signal.
Env.YFP (green) and MA.mCherry (red) labeled particles were coated
onto a glass coverslip, and DFJ-8 cells were allowed to settle onto the virus
particles. Image acquisition with a time resolution of 0.76 frames/sec was
started when the cell contacted the coverslip. The Env.YFP signal vanished
within 30 sec after virus-cell contact and the punctate MA.mCherry signal
disappeared 4 sec afterwards. The video shows a section of the movie cov-
ering 35 sec and is played at a speed of 10 frames per second. The particle
of interest is indicated by a circle.
Click here for file
[ />4690-6-84-S6.mov]
Additional file 7
Representative trajectories of individual particles undergoing color
separation. (A-C) Trajectories of individual particles from live cell imag-
ing data, similar to those shown in Additional files 5 and 6, were derived
by automated tracking as described in Materials and Methods. White
lines depict the outline of the cells as determined by bright field micros-
copy. Blue circles indicate the initial attachment sites of the particles at
the cell surface. To visualize the color separation event, the tracks of the
complete double labeled particles are presented in yellow, while the red
part of the trajectories indicates the movement of mCherry labeled subviral
particles following loss of the Env signal. Scale bars: 5
μ
m.
Click here for file
[ />4690-6-84-S7.tiff]
Additional file 8
Supplementary materials and methods.
Click here for file
[ />4690-6-84-S8.doc]
Publish with BioMed Central and every
scientist can read your work free of charge
"BioMed Central will be the most significant development for
disseminating the results of biomedical research in our lifetime."
Sir Paul Nurse, Cancer Research UK
Your research papers will be:
available free of charge to the entire biomedical community
peer reviewed and published immediately upon acceptance
cited in PubMed and archived on PubMed Central
yours — you keep the copyright
Submit your manuscript here:
/>BioMedcentral
Retrovirology 2009, 6:84 />Page 14 of 14
(page number not for citation purposes)
27. Spearman P, Horton R, Ratner L, Kuli-Zade I: Membrane binding
of human immunodeficiency virus type 1 matrix protein in
vivo supports a conformational myristyl switch mechanism.
J Virol 1997, 71:6582-6592.
28. Zhou W, Resh M: Differential membrane binding of the human
immunodeficiency virus type 1 matrix protein. J Virol 1996,
70:8540-8548.
29. Tang C, Loeliger E, Luncsford P, Kinde I, Beckett D, Summers MF:
Entropic switch regulates myristate exposure in the HIV-1
matrix protein. Proc Natl Acad Sci USA 2004, 101:517-522.
30. Dalton A, Ako-Adjei D, Murray P, Murray D, Vogt V: Electrostatic
interactions drive membrane association of the human
immunodeficiency virus type 1 Gag MA domain. J Virol 2007,
81:6434-6445.
31. Welker R, Hohenberg H, Tessmer U, Huckhagel C, Krausslich H-G:
Biochemical and Structural Analysis of Isolated Mature
Cores of Human Immunodeficiency Virus Type 1. J Virol 2000,
74:1168-1177.
32. Accola MA, Ohagen A, Göttlinger HG: Isoloation of Human
Immunodeficiency Virus Type 1 Cores: Retention of Vpr in
the Absence of p6
gag
. J Virol 2000, 74:6198-6202.
33. Kotov A, Zhou J, Flicker P, Aiken C: Association of Nef with the
Human Immunodeficiency Virus Type 1 Core. J Virol 1999,
73:8824-8830.