Sedation and Analgesia for Diagnostic and Therapeutic Procedures – Part 8 potx
Bạn đang xem bản rút gọn của tài liệu. Xem và tải ngay bản đầy đủ của tài liệu tại đây (231.51 KB, 33 trang )
220 Lowrie and Blumer
instability (2,3). The ability to monitor the “level” of sedation may allow
change in medication administration or increased vigilance for cardiopul-
monary events during the procedure. Current clinical scales are imprecise
and poorly sensitive or specific. Neurophysiologic monitoring using
electroencephalographic variables or evoked potential responses may pro-
vide a rigorous and reproducible quantification of the state of anesthesia
that may more clearly delineate the parts of the anesthesia triad and increase
the sensitivity of sedation efficacy and safety monitoring.
2. CLINICAL EVALUATIVE TOOLS
Many approaches to measuring the pharmacodynamic response to seda-
tives and analgesics have been published. These rating systems have been
variably applied to patients who are undergoing anesthesia for specific pro-
cedures, to evaluate speed and completeness of recovery after anesthesia,
and during relatively long-term sedation in the intensive care unit (ICU).
Although some have been carefully validated for a specific purpose, many
have simply been applied in a given situation for which the system may or
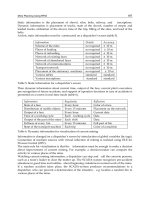
may not have been appropriately validated. Table 1 lists several published
sedation scoring systems divided into categories that depend on the degree
of patient participation and objectiveness of observer ratings. Scoring sys-
tems that depend on patient participation may not be convenient for clinical
use during a procedure, and are affected by patient effort and learning the
response over time. Observer ratings of sedation, particularly if not tested
for interobserver variability, are affected by interobserver interpretation and
bias. In attempts to overcome these inherent problems with clinical testing,
some clinical tools combine observer-based ratings with physiologic vari-
ables that change during sedation and are presumably not open to observer
interpretation (4).
2.1. Patient Tasks
The digit symbol substitution test (DSST), which is frequently used in
drug evaluation studies, particularly of benzodiazepines, requires the patient
to match a number with a symbol from a code involving the numbers 1
through 9 matched to single symbols. The patient must also draw the sym-
bol on the test paper. Scoring involves both the number of attempts and
correct answers. Psychomotor impairment is effectively measured with
DSST (5). Choice reaction time (CRT), another common psychometric test,
has been used to differentiate among hypnotic agents and reflects the sedat-
ing potential of a drug. A tight dose-effect curve may be obtained using
CRT and several benzodiazepine dose levels (6). These types of psychomet-
Assessment of Sedation Depth 221
ric tests, although well-validated, have not been applied frequently in clini-
cal situations involving anesthesia or sedation for procedures. During peri-
ods of heavy sedation, the patient cannot participate enough to produce
results, and patient activity at other times may interfere with the completion
of the procedure or study.
Many studies have used visual analog scales (VAS) completed by the
patient at various points during anesthetic administration and the procedure
(7). These scales are usually 10-cm lines capped at each end by a statement
intended to reflect the extremes of the effect measured. The distance mea-
sured from the negative end of the scale to the point marked by the patient is
the “score” recorded. For instance, Smith used VAS labeled “wide awake”
and “almost asleep” during a study of the sedative effects of propofol (8).
Table 1
Some Published Sedation Scoring Systems
Subjective observer rating
Visual analog scales
Steward
Ramsay
Harris
Modified Glasgow Coma Scale
Observer’s Assessment of Alertness/Sedation Scale (OAA/S)
Cambridge
Bloomsbury
Cook/Newcastle
Neurobehavioral Assessment Scale (NAS)
Sedation-Agitation Scale (SAS)
Patient task performance
Digital symbol substitution test (DSST)
Choice reaction time (CRT)
Memory tests
Visual analog scales
Physiologic measures included
COMFORT
Nisbet and Norris
Heart rate variability
Esophageal sphincter contractility
PRST (Pressure, rate, sweat, tearing)
222 Lowrie and Blumer
The patient is asked to indicate the point on the line that correlates with his
or her current state. VAS have shown remarkable consistency in the com-
parison of scores simultaneously assessed by the patient and an independent
observer (9). Simple recall of several objects or words over time, or the
ability to acquire memory, is another psychometric technique that has been
used as a measure of anesthesia during procedures (10). However, eliciting
implicit or explicit memory following a sedation or anesthetic event after
the fact does little to monitor the depth of sedation or anesthesia during the
procedure.
Problems with these types of psychometric tests include the effects of
patient learning and effort, group comparison effects, and probably even the
time of day performed (11). Psychomotor function will improve over time
as the patient repeatedly performs the same task (practice). This effect can
be lessened in drug evaluation studies by designing the placebo score as the
maximum possible score, but clinical sedation studies rarely utilize placebo.
The degree of effort the patient uses to complete the task will affect the
results. It is difficult to separate effort from drug effects during sedation.
Finally, particular task performance will vary by patient type. Both the eld-
erly and children will have different psychomotor performance than healthy
adults. The effects of chronic illness are poorly understood. It is possible to
use psychometric scoring to compare group data if the individual’s score is
expressed as a change from baseline ability.
2.2. Observer Ratings
VAS are also used by clinicians to rate the level of sedation and have
been used to assess inter-rater validity for new anesthetic techniques (12).
The end caps of the scale can be more inclusive when someone other than
the patient is rating sedation, as degrees of unresponsiveness can be included.
When VAS are used to evalutate a single patient over time by many clini-
cians, the raters must be careful to ensure that they are rating the same vari-
able. Pain, agitation, and degree of sedation may be confused.
When reporting the use of a particular sedative regimen during mechani-
cal ventilation in an ICU in 1974, Ramsay used the sedation ratings shown
in Table 2 (13). This scoring system has been used extensively in ICUs and
in the recovery room during anesthesia emergence. As the need for precise
monitoring of the efficacy of sedatives and anesthetics has grown, scrutiny
of the Ramsay scale as an assessment tool has escalated (14). The Ramsay
scale will provide a numerical label for a subjective assessment of a level of
sedation. As such, it may be useful as a tool for inter-personnel discussions
of patient status. However, even for this use the scale is not precise, particu-
larly for critically ill patients. It is frequently criticized for having only one
Assessment of Sedation Depth 223
level of agitation assessment (15). The six levels of sedation are not mutu-
ally exclusive. Patients may be agitated and restless (Level 1), but not awake
at the same time they are responsive to light glabellar tap (Level 5). The
rater using the scale may not provide an identical stimulus in the “light”
glabellar tap or “loud” auditory stimulus as previously applied or applied by
another rater. Interpretation of “brisk” or “sluggish” adds bias to the scale.
Table 3 lists several other published scores similar to the Ramsay score in
the use of a numerical value attached to a semisubjective rater assessment of
the patient at that moment. Varying degrees of rater/patient interaction are
required. Scores reported by Cohen, Cambridge, and Newcastle are all spe-
cific to patients supported with mechanical ventilation (16).
The Sedation-Agitation Scale (SAS) (Table 4) was developed to describe
the patient’s state of agitation and sedation during a study of haloperidol use
in an adult ICU (17). A later paper reported the reliability and validity of a
revised SAS for patients in ICUs (18). It showed acceptable interrater reli-
ability and for ICU use, it has the advantage of including several degrees of
agitation. Despite the perceived benefit in critically ill patients of multiple
levels of agitation assessment (Levels 5–7), it is interesting to note that in
actual usage, patients were only scored using Levels 1–5 (19). It was vali-
dated against the two unvalidated but commonly used Ramsay and Harris
Scales (20) (Table 5) and has since been correlated with bispectral index
(BIS) monitoring in ICU patients (19).
The Observer’s Assessment of Alertness/Sedation Scale (OAA/S Scale)
(Table 6) was developed to assess the ability of a benzodiazepine antagonist
to reverse sedation. It was tested for reliability and validity against VAS,
DSST, and Serial Sevens Subtraction Test (21). It has been used to assess
the level of sedation achieved with propofol in adult patients (22), and to
assess sedation efficacy in a double-blind, placebo-controlled protocol using
an opioid and a benzodiazepine during elective biopsy procedures (23). As
Table 2
The Ramsay Score
a
1. Patient anxious and agitated or restless or both
2. Patient cooperative, oriented, and tranquil
3. Patient responds to commands only
4. Brisk response to light glabellar tap or loud auditory stimulus
5. Sluggish response to light glabellar tap or loud auditory stimulus
6. No response to light glabellar tap or loud auditory stimulus
a
Adapted from ref. (13).
224 Lowrie and Blumer
with the Ramsay Scale, inadequately sedated or agitated, uncooperative
patients are not well-assessed with the OAA/S Scale.
Chernik then developed the Neurobehavioral Assessment Scale (NAS)
specifically to evaluate patients across the full range of behavioral function-
ing. The NAS was tested for interrater reliability and evaluated against two
scores believed to be most effective at the extreme ends of the range of
neurobehavior, the Glascow Coma Score (GCS) and DSST (24). The NAS
was tested during induction of anesthesia before a surgical procedure. The
GCS is believed to rate more unresponsive or comatose patients well. How-
ever, it correlated poorly with NAS in lightly sedated patients. On the other
hand, the DSST that requires a fair degree of alertness showed good correla-
tion with NAS. Therefore, Chernik concluded that NAS is an effective scale,
Table 3
Sedation Scales
Cohen sedation score
a
0 Asleep, no response to tracheal
suction
1 Arousable, coughs with tracheal
suction
2 Awake, spontaneously coughs or
triggers ventilator
3 Actively breathes against ventilator
4 Unmanageable
Bloomsbury sedation score
a
3 Agitated and restless
2 Awake and uncomfortable
1 Aware but calm
0 Roused by voice, remains calm
–1 Roused by movement or suction
–2 Roused by painful stimuli
–3 Unarousable
A Natural sleep
Cambridge sedation score
a
1 Agitated
2 Awake
3 Roused by voice
4 Roused by tracheal suction
5 Unarousable
6 Paralyzed
7 Asleep
Simplified post-anesthesia recovery
score
a
Consciousness
2 Awake
1 Responding to stimuli
0 Not responding
Airway
2 Coughing on command or crying
1 Maintaining good airway
0 Airway requires maintenance
Movement
2 Moving limbs purposefully
1 Non-purposeful movements
0 Not moving
a
Adapted from refs. (16,69).
Assessment of Sedation Depth 225
Table 4
The Sedation-Agitation Scale
a
7 Dangerous agitation Pulling an ET tube, trying to remove catheters, climbing
over bed rail, striking at staff, thrashing side-to-side
6 Very agitated Does not calm despite frequent verbal reminding of lim-
its; requires physical restraints, biting ET tube
5 Agitated Anxious or mildly agitated, attempting to sit up, calms
down to verbal instructions
4 Calm and cooperative Calm, awakens easily, follows commands
3 Sedated Difficult to arouse, awakens to verbal stimuli or gentle
shaking but drifts off again, follows simple commands
2 Very sedated Arouses to physical stimuli but does not communicate
or follow commands, may move spontaneously
1 Unarousable Minimal or no response to noxious stimuli, does not
communicate or follow commands
a
Adapted from ref. (17).
Table 5
Harris Scale
a
A. General condition
1. Confused and uncontrollable
2. Anxious and agitated
3. Conscious, oriented, and calm
4. Asleep but arousable to speech, obeys commands
5. Asleep but responds to loud auditory stimulus or sternal pressure
6. Unarousable
B. Compliance with mechanical ventilation
1. Unable to control ventilation
2. Distressed, fighting ventilator
3. Coughing when moved but tolerating ventilation for most of the time
4. Tolerating movement
C. Response to endotracheal suctioning
1. Agitation, distress, prolonged coughing
2. Coughs, distressed, rapid recovery
3. Coughs, not distressed
4. No cough
a
Adapted from ref. (20).
226 Lowrie and Blumer
226
Table 6
The Observer’s Assessment of Alertness/Sedation Scale
a
Facial Composite
Responsiveness Speech expression Eyes score level
Responds readily to name Normal Normal Clear 5 (Alert)
spoken in normal tone No ptosis
Lethargic response to name Mild slowing Mild relaxation Glazed or mild ptosis 4
spoken in normal tone or thickening (<half the eye)
Responds only after name Slurring or Marked relaxation Glazed and marked ptosis 3
is called loudly and/or prominent (Slack jaw) (>half the eye)
repeatedly slowing
Responds only after mild Few recognizable — — 2
prodding or shaking words
Does not respond — — — 1 (Deep sleep)
a
Adapted from ref. (21).
Assessment of Sedation Depth 227
particularly at more alert ranges of sedation. The scale scores an interview
process with specific questions on the orientation to person, place, and time,
and includes asking the patient to repeat a sentence to enable the rater to
judge the quality of speech. The rater must also judge 4–5 levels of alert-
ness, disorientation, speech articulation, and psychomotor retardation.
The GCS has been used to assess sedation efficacy (25) and as a valida-
tion tool for new sedation scales as noted previously. The original GCS was
a nonvalidated scale intended to allow interrater reliability in the assessment
of coma without extensive staff training (26). Subsequently, predictions of
severity of outcome after head trauma have been linked to GCS scores on
presentation (27). It is a scale of three parts: motor response, verbal response
and eye opening (Table 7). Various scales have been denoted the “modi-
fied” Glascow Coma Scale and have been used in different settings to rate
the efficacy of a particular drug combination for sedation in mechanically
ventilated patients in the ICU by omitting the verbal section (28). It is doubt-
ful that “levels” of coma and sedation are synonymous enough to make this
a valid technique.
Techniques that require an observer to rate a patient characteristic or degree
of response to an applied stimulus are all subject to variability in observer
Table 7
Glasgow Coma Score
a
Activity Best response Score
Eye opening Spontaneous 4
To verbal stimuli 3
To pain 2
None 1
Verbal Oriented 5
Confused 4
Inappropriate words 3
Nonspecific sounds 2
None 1
Motor Follows commands 6
Localizes pain 5
Withdraws in response to pain 4
Flexion in response to pain 3
Extension in response to pain 2
None 1
a
Adapted from ref. (26).
228 Lowrie and Blumer
skill, experience, and judgment. Although training and interobserver valid-
ity testing make these types of scoring systems more accurate, precise appli-
cation of these scores to the clinical situation for which they were intended
is even more necessary. Sedation and analgesia in the intubated patient over
time in the ICU is a very different process than short-term sedation and
analgesia or anesthesia of the same patient undergoing a procedure. Seda-
tion in the ICU is necessary not only to allow patient tolerance of prolonged
immobilization and invasive monitoring devices, but also to possibly pre-
vent and certainly alleviate “ICU stress delirium” believed by many to be an
indication of cerebral failure (15). Regulation of sleep cycles and a “semi-
alert” but calm state of being are now believed to be most beneficial in ICU
patients as opposed to the coma deemed desirable in earlier years of ICU
medicine (29). Sedation and analgesia for short procedures encompass only
the goals of patient comfort, ability to complete the procedure, and possibly
amnesia. With expectant cardiopulmonary management, during short
nonoperative procedures, it is unclear that there is a meaningful difference
between deeper levels of sedation rated by an observer rating score devel-
oped for ICU patients (SAS, for instance) when patients arouse to physical
stimuli and move spontaneously (SAS Level 2) or are calm and awaken
easily, following commands (SAS Level 4) but allow the procedure to occur.
It is generally believed that deeper levels of sedation predict longer recov-
ery time but newer short-acting anesthetics have facilitated early recovery
to a large extent (30).
It is recommended that observer rating scales be used only in the popula-
tion and clinical situation for which they are validated. Furthermore, pain vs
anxious agitation, and sleepiness vs unconsciousness are not easily distin-
guished by assigning a score to one specific patient characteristic or response.
Inappropriate medications may be used when the cause of the patient
response is not understood. For instance, large doses of potent anxiolytics
may be used inappropriately to “sedate” a somnolent or confused patient
who is agitated because of pain. Separate quantitative scales of pain, somno-
lence, and anxiety more in keeping with the modern hypotheses of an anes-
thesia “triad” may be necessary to appropriately manage the variety of
sedatives and analgesics available today (7).
2.3. Physiologic Variables
Sedation assessment methods that use physiologic responses to stimulus
or medication are usually viewed as more objective than the observer rat-
ings described here. Anesthesiologists have long described the hemody-
namic changes that occur during varying levels of general anesthesia (4).
Assessment of Sedation Depth 229
For instance, Table 8 shows a simple means of evaluating the level of anes-
thesia using change in blood pressure and heart rate from baseline, degree of
sweating and tearing referred to as PRST. Utility may be limited in the pres-
ence of hemodynamically active medications or underlying disease that
directly affects vital signs (31). Nisbet developed a scoring system that incor-
porated physiologic changes for preoperative and intra-operative use (32)
(Table 9). A score of 0–4 correlated with “poor” sedation, 5–6 “fair” and 7–10
“good” sedation. He attempted to validate this scoring system against an
observer’s subjective assessment of sedation (drowsy, wide awake, anxious).
However, the statistical analysis used was incomplete.
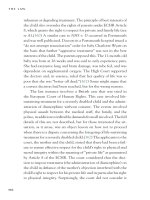
The COMFORT score was developed and validated against observer VAS
ratings for use in assessing sedation in mechanically ventilated children
(33,34) (Table 10). A score between 17 and 26 was considered indicative of
optimal sedation in ventilated patients in the unit in which it was developed.
The 2-min observation period for accurate score reporting has contributed
to the concern that the score is too complex for routine use, adding to the
ICU nursing workload (29). The COMFORT score has not been validated in
adults or during procedures, where the level of stimulus may change quickly
and frequently.
Another physiologic variable that has been studied in the context of depth
of anesthesia is lower esophageal sphincter contractility, which is increased
by physiologic stress (35). Deepening levels of anesthesia lowers esoph-
ageal contractility. The correlation between sphincter contractility and clini-
cal signs of deep anesthesia was at first believed to be quite strong (36).
Table 8
PRST Scale
a
Systolic blood pressure (mmHg) < Control + 15 0
> Control + 15 1
> Control + 30 2
Heart rate (beats/min) < Control + 15 0
> Control + 15 1
> Control + 30 2
Sweating Nil 0
Skin moist to touch 1
Visible beads of sweat 2
Tears No excess of tears in open eyes 0
Excess of tears in open eyes 1
Tear overflow from closed eyes 2
a
Adapted from ref. (4).
230 Lowrie and Blumer
Table 9
A Scoring System for Objective Measurement of Sedation
a
A. Subjective state in operating room
Apprehensive 0
Fully awake 1
Drowsy 2
B. Change in state after premedication
Apparent improvement, change in state 1–2 or 2–3 2
No change 1
Apparent deterioration change in state 2–1 0
C. Change after premedication
Fall in blood pressure >10 mmHg 2
No change 1
Rise in blood pressure >10 mmHg 0
Fall in heart rate >10/min 2
No change 1
Rise in heart rate >10/min 0
D. After stimulation
Rise in blood pressure >10 mmHg 0
No change 1
Rise in heart rate >10/min 0
a
Adapted from ref. (32).
Table 10
The COMFORT Scale
a
ALERTNESS
Deeply asleep 1
Lightly asleep 2
Drowsy 3
Fully awake and alert 4
Hyper-alert 5
CALMNESS/AGITATION
Calm 1
Slightly anxious 2
Anxious 3
Very anxious 4
Panicky 5
(continued)
Assessment of Sedation Depth 231
Table 10 (cont.)
RESPIRATORY RESPONSE
No coughing and no spontaneous respiration 1
Spontaneous respiration with little or no response to ventilation 2
Occasional cough or resistance to ventilator 3
Actively breathes against ventilator or coughs regularly 4
Fights ventilator; coughing or choking 5
PHYSICAL MOVEMENT
No movement 1
Occasional, slight movement 2
Frequent, slight movement 3
Vigorous movement limited to extremities 4
Vigorous movements including torso and head 5
BLOOD PRESSURE (MAP) BASELINE
Blood pressure below baseline 1
Blood pressure consistently at baseline 2
Infrequent elevations (1–3) of ≥15% 3
Frequent elevations (>3) of ≥15% 4
Sustained elevation ≥ 15% 5
HEART RATE BASELINE
Heart rate below baseline 1
Heart rate consistently at baseline 2
Infrequent elevations (1–3) of ≥15% above baseline during observation period 3
Frequent elevations (>3) of ≥15% above baseline 4
Sustained elevation of ≥ 15% 5
MUSCLE TONE
Muscles totally relaxed, no muscle tone 1
Reduced muscle tone 2
Normal muscle tone 3
Increased muscle tone and flexion of fingers and toes 4
Extreme muscle rigidity and flexion of fingers and toes 5
FACIAL TENSION
Facial muscles totally relaxed 1
Facial muscle tone normal, no facial muscle tension evident 2
Tension evident in some facial muscles 3
Tension evident throughout facial muscles 4
Facial muscles contorted and grimacing 5
a
Adapted from ref. (34).
232 Lowrie and Blumer
However, further study has shown wide interpatient and interagent variabil-
ity (37,38), and that atropine ablates the ability to monitor change in esoph-
ageal contractility (39). The value of this modality as a measure of depth of
anesthesia is therefore questionable.
Reduction of heart rate variation has been shown with induction of anes-
thesia and increased variation is seen with recovery (40). Recent develop-
ment of computer real time analysis of heart-rate variation may provide an
objective physiologic index of depth of anesthesia. Stimulation with chest
physiotherapy of sedated and paralyzed ICU patients produced marked
increases in respiratory sinus arrhythmia without significant changes in elec-
trocardiogram (ECG) R-R interval (41). Commercially available analyzing
equipment was used to correlate beat-to-beat variability of heart rate and
Ramsay scores in 20 mechanically ventilated ICU patients during awaken-
ing from midazolam sedation (42). Prediction of Ramsay score was poor.
Perhaps the use of hemodynamically active medications or co-existing dis-
ease that may have altered heart rate variability confounded the ability to
assess anesthesia effects alone with this tool. On the other hand, the Ramsay
score may simply be too insensitive to correlate well with this type of index.
Although physiologic methods of assessment of sedation efficacy are
desirable in terms of objectivity, these techniques have not been used to
assess patients at “lighter” levels of sedation during short procedures, not
involving muscle relaxation or neuromuscular blockade. Their ability to dis-
criminate effectively between levels of sedation remains inconclusive.
3. NEUROPHYSIOLOGIC MONITORING
3.1. Modalities
Clinical monitoring tools are in general poor predictors of patient aware-
ness of sensations, experiences, and pain in the operating room. Use of neu-
romuscular blockade in the ICU renders most nonphysiologic clinical tools
useless. Once the patient exhibits a change in physiology (heart rate or blood
pressure increase) or response to stimulus (movement or follows a com-
mand), awareness may have already occurred. The technique of isolating an
arm from the effects of neuromuscular blockade with a tourniquet has dem-
onstrated response to commands during a variety of anesthetic regimens and
poor correlation with clinical assessments of the “depth” of anesthesia (44).
The incidence of awareness during anesthesia averages 0.25–1%, but may
be as high as 43% in certain populations (1). Particularly during the use of
neuromuscular blockade, the electroencephalogram (EEG) as an indicator
of brain function may offer more precise measurement of the individual’s
response to sedation and analgesia.
Assessment of Sedation Depth 233
The EEG is a plot of voltage of the electrical activity of the cerebral cor-
tex against time. The resulting waveforms are traditionally interpreted on
the basis of amplitude, frequency, and location of origin and pattern recog-
nition. All medications used for anesthesia alter the EEG and many, with
increasing drug concentration, will eventually produce burst suppression.
The burst suppression pattern is closely associated with unconsciousness,
but is not usually considered a desirable level of even general anesthesia, as
patients may become hemodynamically unstable and recover slowly. The
changes exhibited in frequency, amplitude, and EEG pattern during dose
escalation are both drug- and patient-specific (44). The traditionally formatted
EEG is a complex, cumbersome record that requires a high level of training
and attention for accurate interpretation. Standardization, reproducibility, and
electrical interference in the operating room or ICU are also problematic.
Computer analysis of EEG raw data has been developed to overcome
some of the difficulties inherent to EEG interpretation. The cerebral func-
tion monitor (CFM) is an early simple example of processed EEG informa-
tion, which used a single EEG channel and integrated EEG frequency and
amplitude to produce a single tracing. This system was further modified to
produce the cerebral function analyzing monitor (CFAM) that used two EEG
channels and analyzed different frequency bands along with amplitude to
produce a trend over time (45). Although developed for use in the ICU,
impairment of cerebral function by changes in perfusion or oxygenation
blunts the CFAM tracing, and deep sedation cannot be differentiated from
general anesthesia (unconsciousness) (9,31). Other methods of EEG pro-
cessing are considered superior techniques.
Fast Fourier transformation can be performed in real time for several EEG
channels by microprocessors. Power spectrum analysis involves Fourier
analysis of an epoch of EEG raw waveform defined by amplitude, frequency,
and phase angle, and resolved into a set of sinusoids that when added
together equal the original EEG complex. This information may be displayed
as a compressed spectral array that is a histogram of power (amplitude
2
) vs
frequency or as a density spectral array, where a color change represents
power for each frequency. Compressed spectral array and density spectral
array are essentially very compact displays of an EEG, yet they require a
good deal of training and judgment by the practitioner for correct interpretation.
Numerical parameters have been derived from statistical analysis of the
power spectrum to simplify pattern recognition. The epoch of EEG signal is
assumed to be stationary or linear, and its variables normally distributed. Com-
monly derived variables include the peak power frequency or the frequency
with the highest power in the epoch, median power frequency or the frequency
234 Lowrie and Blumer
that divides the power spectrum in two halves, and spectral edge frequency
defined by the frequency below which 95% of the power is located.
Power spectrum analysis also assumes that frequency bands of the EEG
are independent variables. Because the EEG is not completely stationary
and there are interrelationships between frequency components (phase cou-
pling where the phase of one component depends on the phase angle of other
components), power spectrum analysis may analyze two complex wave-
forms with different phase structures as identical. Bispectral analysis allows
for the influence of these nonlinear interrelationships, and can produce a
multivariate index single number called the bispectral index (BIS). A com-
mercially available algorithm provides a BIS score. It is important to under-
stand that this algorithm was derived from analyzing a large database of
EEGs from patients receiving hypnotic agents that were intended to produce
degrees of lack of awareness and recall (unconsciousness) (46,47). The inter-
action of analgesia in BIS (reduction in pain perception manifested by
decreased autonomic responses to noxious stimuli) is unclear (48). Bispectral
analysis is a classic form of EEG interpretation. A complete discussion of
EEG signal processing including a detailed description of BIS specific to
anesthesia has recently been published (49).
The electrophysiologic response to external sensory stimuli—auditory,
peripheral nerve stimulation, visual—is represented by evoked potentials.
Anesthetics produce dose- and agent-specific changes in the amplitudes and
latencies of evoked potential waveforms. Some authors believe that evoked
responses may be able to differentiate the analgesic and hypnotic effects of
a variety of medications (50,51). Somatosensory-evoked potentials (SSEP)
have been used most often as a monitor of neurologic function during proce-
dures involving spinal cord manipulation, and the cortically generated SSEP
amplitude is suppressed with analgesics but not some hypnotics (52). Audi-
tory-evoked potentials (AEP) have been best characterized in relationship
to sedation (53). The AEP tracing is produced by delivering specific clicks
or tones through earphones. The resulting scalp signal is processed to cancel
out background EEG signal, and a representative waveform is produced.
Early AEP generated from the brainstem are not affected by anesthetics.
The late AEP that arise from the frontal cortex vary from individual to indi-
vidual and are quite dependent on the degree of attention and alertness. The
midlatency AEP represent noncognitive cortical processing of the auditory
signal, are highly reproducible from patient to patient, and correlate closely
with consciousness and implicit memory during anesthesia. Some training
is needed for interpretation of waveform changes unless the latencies and
amplitudes are indexed. Evoked potential monitoring is also technically dif-
Assessment of Sedation Depth 235
ficult in the electrically active environment of the operating room and ICU,
making this technique in its currently available mode less attractive than
processed EEG techniques for general use (54).
3.2. Clinical Comparisons
Many systems have been designed to titrate anesthetic medications to
target serum drug concentrations or mean alveolar concentrations of inhaled
gases that have been shown to produce the desired level of anesthesia (55).
In a study designed to evaluate the relationship of BIS to measured drug
concentration and clinically assigned levels of sedation, 72 volunteers were
given isoflurane, propofol, midazolam, or alfentanil in a dose-ranging man-
ner to achieve target concentrations (56). Compared to an OAA/S score of 2
or less (defined as unconsciousness in this study), BIS correlated better than
propofol concentration and equally well with midazolam and isoflurane con-
centrations. Ninety-five percent of participants were unconscious, with a
BIS of 50. Target-controlled infusion of propofol was also used with and
without the addition of narcotic in a volunteer study assessing BIS, OAA/S,
and memory function (57). BIS correlated better than drug concentration
with OAA/S. These investigators noted that the increase in BIS induced
with painful stimulus was blunted in the presence of alfentanil, lending sup-
port to use of BIS as a monitor of depth of consciousness and not of pain
response. The use of BIS monitoring and target-controlled infusion technol-
ogy may facilitate more closely controlled drug delivery and consistent se-
dation levels (58,59).
Theoretically, because BIS considers phase coupling and the nonlinear
nature of the EEG, it should describe anesthesia-induced changes in the EEG
better than power spectrum analysis. Studies directly comparing the correla-
tion of BIS, 95% spectral-edge frequency (SEF), and median frequency
(MF) with OAA/S during sedation with midazolam or propofol show much
better correlation between BIS and clinical scores during induction and
recovery (60,61). Similar comparisons of BIS, power spectrum indices, and
AEP have shown very poor specificity and sensitivity of 95% spectral edge
and median frequency in predicting unconsciousness, whereas AEP was
somewhat better than BIS (62–64).
Retrospective group correlation of one monitor with another monitor may
indicate improved sensitivity and specificity. Monitors of anesthesia are
potentially most helpful if they can predict patient response. In a study that
compared BIS, AEP, 95% SEF and median frequency, Doi used target-
controlled infusions of propofol and alfentanil and evaluated movement at
laryngeal mask insertion (65). Although all patients had loss of eyelash
236 Lowrie and Blumer
reflex confirming unconsciousness before attempted insertion, only the AEP
index 30 s before insertion discriminated between movers and non-movers.
However, Kochs could not demonstrate good prediction of movement
response to skin incision during isoflurane anesthesia using AEP (66). Simi-
lar findings were reported in 1998 during sevoflurane anesthesia (67). BIS,
SEF, MF, and OAA/S did not predict movement at skin incision.
BIS represents the most accurate neurophysiologic monitor currently
available for monitoring of anesthesia level. Although it may not completely
accurately predict response to painful stimulus (incision) or deep reflexic
response (laryngeal stimulus), it may allow more tightly controlled anesthe-
sia delivery, resulting in a shorter recovery time. Higher BIS scores at the
end of clinically controlled anesthesia with propofol and desflurane pre-
dicted fast-track eligibility in outpatient tubal ligation patients (30). In a
randomized, multi-institutional study comparing standard practice during
propofol-alfentanil-nitrous oxide anesthesia to standard practice plus BIS tar-
geting of propofol infusions, anesthesiologists attempted to achieve the fastest
possible recovery times (68). The intra-operative course was similar between
the two groups; however, the propofol infusion rate was reduced (134 and 116
ug/kg/min), extubation occurred sooner (11 and 7 min), more patients were ori-
ented on arrival in the recovery room (43% and 23%) and eligibility for dis-
charge was earlier (38 and 32 min) in the group that received BIS monitoring.
4. CONCLUSION
The ideal monitor of sedation and analgesia will need to differentiate level
of consciousness and pain. It must be easily used across many patient types
and during a variety of procedures, and be easily understood by a variety of
clinical practitioners. It should be predictive of response to stimuli, not sim-
ply an alarm to indicate a threshold has been reached. It must be equally able
to monitor patients who are in the process of becoming conscious and those
who may be slowly reaching undesirable levels of unconsciousness. Current
clinical scoring systems certainly do not provide this degree of accuracy or
flexibility. The BIS and indexed AEP represent the currently available tech-
nology useful for patients receiving neuromuscular blockade who are most
likely to experience undetected awareness during ICU sedation and anesthe-
sia and for producing very tightly controlled levels of effective and uniform
anesthesia. Whether BIS and AEP are useful for targeting sedation (imply-
ing a higher level of consciousness than anesthesia) remains to be demon-
strated. Further work must be done to apply BIS and AEP to children,
specific anesthetic regimens, and critically ill patients whose disease pro-
cess may affect cerebral blood flow and function.
Assessment of Sedation Depth 237
REFERENCES
1. Glass, P. S. A. (1999) Why and how we will monitor the state of anesthesia in
2010? Acta Anaesthesiol. Belg. 50, 35–44.
2. American Academy of Pediatrics, Committee on Drugs. (1992) Guidelines for
monitoring and management of pediatric patients during and after sedation for
diagnostic and therapeutic procedures. Pediatrics 89, 1110–1115.
3. American Society of Anesthesiologists Task Force on Sedation and Analgesia
by Non-Anesthesiologists. (1996) Practice guidelines for sedation and analge-
sia by non-anesthesiologists. Anesthesiology 84, 459–471.
4. Wang, D. Y. (1993) Assessment of sedation in the ICU. Intensive Care World
10, 193–196.
5. Johnson, L. C. and Chernik, D. A. (1982) Sedative-hypnotics and human per-
formance. Psychopharmacology 76, 101–113.
6. Hindmarch, I. (1994) Instrumental assessment of psychomotor functions and the
effects of psychotropic drugs. Acta Psychiatr. Scand. (89 Suppl) 380, 49–52.
7. Wansbrough, S. R. and White, P. F. (1993) Sedation scales: Measures of calm-
ness or somnolence? Anesth. Analg. 76, 219–221.
8. Smith, I., Monk, T. G., White, P. F., and Ding, Y. (1994) Propofol infusion
during regional anesthesia: sedative, amnestic, and anxiolytic properties.
Anesth. Analg. 79, 313–319.
9. Avramov, M. N. and White, P. F. (1995) Methods for monitoring the level of
sedation. Crit. Care Clin. 11, 803–826.
10. Bailey, A. R. and Jones, J. G. (1997) Patients’ memories of events during gen-
eral anaesthesia. Anaesthesia 52, 460–476.
11. Laurijssen, B. E. and Greenblatt, D. J. (1996) Pharmacokinetic-pharmacody-
namic relationships for benzodiazepines. Clin. Pharmacokinet. 1, 52–76.
12. Wehrmann, T., Kokabpick, S., Lembcke, B., Caspary, W. F., and Seifert, H.
(1999) Efficacy and safety of intravenous propofol sedation during routine
ERCP: a prospective, controlled study. Gastrointest. Endosc. 49, 677–683.
13. Ramsay, M. A. E., Savege, T. M., Simpson, B. R. J., and Goodwin, R. (1974)
Controlled sedation with alphaxalone-alphadolone. Br. Med. J. 2, 656–659.
14. Hansen-Flaschen, J., Cowen, J., and Polomano, R. C. (1994) Beyond the
Ramsay scale: need for a validated measure of sedating drug efficacy in the
intensive care unit. CCM 22, 732–733.
15. Crippen, D. W. (1994) Neurologic monitoring in the intensive care unit. New
Horizons 2, 107–120.
16. Schulte-Tamburen, A. M., Schier, J., Briegel, J., Schwender, D., and Peter, K.
(1999) Comparison of five sedation scoring systems by means of auditory
evoked potentials. Intensive Care Med. 25, 377–382.
17. Riker, R. R., Fraser, G., and Cox, P. M. (1994) Continuous infusion haloperi-
dol controls agitation in critically ill patients. Crit. Care Med. 22, 433–440.
18. Riker, R. R., Picard, J. T., and Fraser, G. L. (1999) Prospective evaluation of
the sedation-agitation scale for adult critically ill patients. Crit. Care Med. 27,
1325–1329.
238 Lowrie and Blumer
19. Simmons, L. E., Riker, R. R., Prato, S., and Fraser, G. L. (1999) Assessing
sedation during intensive care unit mechanical ventilation with the bispectral
index and the sedation-agitation scale. Crit. Care Med. 27, 1499–1504.
20. Harris, C. E., O’Donnell, C., Macmillan, R., et al. (1991) Use of propofol by
infusion for sedation of patients undergoing haemofiltration—Assessment of
the effect of haemofiltration on the level of sedation and on blood propofol
concentration. J. Drug Dev. 4(Suppl 3), 37–39.
21. Chernik, D. A., Gillings, D., Laine, H., Hendler, J., Silver, J. M., Davidson, A.
B., et al. (1990) Validity and reliability of the observer’s assessment of alertness/
sedation scale: Study with intravenous midazolam. J. Clin. Psychopharmacol.
10, 244–251.
22. Casati, A., Fanelli, G., Casaletti, E., Colnaghi, E., Cedrati, V., and Torri, G.
(1999) Clinical assessment of target-controlled infusion of propofol during
monitored anesthesia care. Can. J. Anesth. 46, 235–239.
23. Avramov, M. N., Smith, I., and White, P. F. (1996) Interactions between
midazolam and remifentanil during monitored anesthesia care. Anesthesiology
85, 1283–1289.
24. Chernik, D. A., Tucker, M., Gigli, B., Yoo, K., Paul, K., Laine, H., et al. (1992)
Validity and reliability of the neurobehavioral assessment scale. J. Clin.
Psychopharmacol. 12, 43–48.
25. Lerman, B., Yoshida, D., and Levitt, M. A. (1996) A prospective evaluation of
the safety and efficacy of methohexital in the emergency department. Am. J.
Emerg. Med. 14, 351–354.
26. Teasdale, G. and Jennett, B. (1974) Assessment of coma and impaired con-
sciousness: a practical scale. Lancet July 13, 81–84.
27. Alvarez, M., Nava, J. M., Rue, M., and Quintana, S. (1998) Mortality predic-
tion in head trauma patients: Performance of Glascow coma score and several
severity systems. Crit. Care Med. 26, 142–148.
28. Edbrooke, D. L., Newby, D. M., Mather, S. J., Dixon, A. M., and Hebron, B. S.
(1982) Safer sedation for ventilated patients. A new application for etomidate.
Anaesthesia 37, 765–771.
29. Lowson, S. M. and Sawh, S. (1999) Adjuncts to analgesia. Crit. Care Clin. 15,
119–141.
30. Song, D., van Vlymen, J., and White, P. F. (1998) Is the bispectral index useful
in predicting fast-track eligibility after ambulatory anesthesia with propofol
and desflurane? Anesth. Analg. 87, 1245–1248.
31. Habibi, S. and Coursin, D. B. (1996) Assessment of sedation, analgesia, and
neuromuscular blockade in the perioperative period. Int. Anesth. Clinics 34,
215–241.
32. Nisbet, H. L. A. and Norris, W. (1963) Objective measurement of sedation II:
A simple scoring system. Br. J. Anaesth. 35, 618–623.
33. Ambuel, B., Hamlett, K. W., Marx, C. M., and Blumer, J. L. (1992) Assessing
distress in pediatric intensive care environments: The COMFORT scale. J.
Pediatr. Psychol. 17, 95–109.
Assessment of Sedation Depth 239
34. Marx, C. M., Smith, P. G., Lowrie, L. H., Hamlett, K. W., Ambuel, B.,
Yamashita, T. S., and Blumer, J. L. (1994) Optimal sedation of mechanically
ventilated pediatric critical care patients. CCM 22, 163–170.
35. Faulkner, W. B. (1940) Objective oesophageal changes due to psychic factors.
American Journal of Medical Science 200, 796–803.
36. Evans, J. M., Bithell, J. F., and Vlachonikolis, I. G. (1987) Relationship between
lower oesophageal contractility, clinical signs and halothane concentration dur-
ing general anesthesia and surgery in man. Br. J. Anaesth. 59, 1346–1355.
37. Isaac, P. A. and Rosen, M. (1990) Lower oesophageal contractility and detec-
tion of awareness during anaesthesia. Br. J. Anaesth. 65, 319–324.
38. Cox, P. N. and White, D. C. (1986) Do oesophageal contractions measure
“depth” of anaesthesia? Br. J. Anaesth. 58, 131P-132P.
39. Aitkenhead, A. R., Lin, E. S., and Thomas, D. (1987) Relationship between
lower esophageal contractility and clinical signs of light anaesthesia. Anesthe-
siology 67, A671.
40. Pomfrett CJD, Beech, M. J., and Healy, T. E. J. (1991) Variation in respiratory
sinus arrhythmia may reflect levels of anaesthesia. Br. J. Anaesth. 67, 646–647.
41. Wang, D. Y., Pomfrett, C. J. D., and Healy, T. E. J. (1993) Respiratory sinus
arrhythmia: A new, objective sedation score. Br. J. Anaesth. 71, 354–358.
42. Haberthur, C., Lehmann, F., and Riz, R. (1996) Assessment of depth of midazo-
lam sedation using objective parameters. Intensive Care Med. 22, 1385–1390.
43. Winchell, R. J. and Hoyt, D. B. (1996) Spectral analysis of heart rate variabil-
ity in the ICU: a measure of autonomic function. J. Surg. Res. 63, 11–16.
44. Heier, T. and Steen, P. A. (1996) Assessment of anaesthesia depth. Acta
Anaesthesiol. Scand. 40, 1087–1100.
45. Maynard, D., Prior, P. F., and Scott, D. F. (1969) A device for continuous
monitoring of cerebral activity in resuscitated patients. Br. Med. J. 4, 545–546.
46. Kearse, L. A., Rosow, C., Zaslavsky, A., Connors, P., Dershwitz, M., and
Denman, W. (1998) Bispectral analysis of the electroencephalogram predicts
conscious processing of information during propofol sedation and hypnosis.
Anesthesiology 88, 25–34.
47. Leslie, K., Sessler, D. I., Smith, W. D., Larson, M. D., Ozaki, M., Blanchard,
D., et al. (1996) Prediction of movement during propofol/nitrous oxide anes-
thesia. Anesthesiology 84, 52–63.
48. Shapiro, B. A. (1999) Bispectral index: better information for sedation in the
intensive care unit? Crit. Care Med. 27, 1663–1664.
49. Rampil, I. J. (1998) A primer for EEG signal processing in anesthesia. Anes-
thesiology 89, 980–1002.
50. Crabb, I., Thornton, C., Konieczko, K. M., Chan, A., Aquilina, R., Frazer, N.,
et al. (1996) Remifentanil reduces auditory and somatosensory evoked responses
during isoflurane anaesthesia in a dose-dependent manner. Br. J. Anaesth. 76,
795–801.
51. Thornton, C. and Sharpe, R. M. (1998) Evoked responses in anaesthesia. Br. J.
Anaesth. 81, 771–781.
240 Lowrie and Blumer
52. Thornton, C. and Jones, J. G. (1993) Evaluating depths of anesthesia: Review
of methods. Int. Anesthesiol. Clin. 31, 67–88.
53. Schwender, D., Weninger, E., Daunderer, M., Klasing, S., Poeppel, E., and
Peter, K. (1995) Anesthesia with increasing doses of sufentanil and midlatency
auditory evoked potentials in humans. Anesth. Analg. 80, 499–505.
54. Stanski, D. R. (2000) Monitoring depth of anesthesia, in Anesthesia (Miller, R.
D., ed.), Churchill Livingstone, Philadelphia, PA, pp. 1087–1116.
55. Newson, C., Joshi, G. P., Victory, R., and White, P. F. (1995) Comparison of
propofol administration techniques for sedation during monitored anesthesia
care. Anesth. Analg. 81, 486–491.
56. Glass, P. S., Bloom, M., Kearse, L., Rosow, C., Sebel, P., and Manberg, P.
(1997) Bispectral analysis measures sedation and memory effects of propofol,
midazolam, isoflurane, and alfentanil in healthy volunteers. Anesthesiology 86,
836–847.
57. Iselin-Chaves, I. A. (1998) Flaishon, R., Sebel, P. S., Howell, S., Gan, T. J.,
Sigl, J., et al. The effect of the interaction of propofol and alfentanil on recall,
loss of consciousness, and the bispectral index. Anesth. Analg. 87, 949–955.
58. Mortier, E., Struys, M., De Smet, T., Versichelen, L., and Roly, G. (1998)
Closed-loop controlled administration of propofol using bispectral analysis.
Anaesthesia 53, 749–754.
59. Struys, M., Versichelen, L., Byttebier, G., Mortier, E., Moerman, A., and Rolly,
G. (1998) Clinical usefulness of the bispectral index for titrating propofol tar-
get effect-site concentration. Anaesthesia 53, 4–12.
60. Liu, J., Singh, H., and White, P. F. (1997) Electroencephalographic bispectral
index correlates with intraoperative recall and depth of propofol-induced seda-
tion. Anesth. Analg. 84, 185–189.
61. Liu, J., Singh, H., and White, P. F. (1996) Electroencephalogram bispectral
analysis predicts the depth of midazolam-induced sedation. Anesthesiology 84,
64–69.
62. Schraag, S., Bothner, U., Gajraj, R., Kenny, G. N., and Georgieff, M. (1999)
The performance of electroencephalogram bispectral index and auditory
evoked potential index to predict loss of consciousness during propofol infu-
sion. Anesth. Analg. 89, 1311–1315.
63. Gajraj, R. J., Doi, M., Manzaridis, H., and Kenny, G. N. C. (1998) Analysis of
the EEG bispectrum, auditory evoked potentials and the EEG power spectrum
during repeated transitions from consciousness to unconsciousness. Br. J.
Anaesth. 80, 46–52.
64. Doi, M., Gajraj, R. J., Mantzaridis, H., and Kenny, G. N. C. (1997) Relation-
ship between calculated blood concentration of propofol and electrophysiologi-
cal variables during emergence from anaesthesia: comparison of bispectral
index, spectral edge frequency, median frequency and auditory evoked poten-
tial index. Br. J. Anaesth. 78, 180–184.
65. Doi, M., Gajraj, R. J., Mantzaridis, H., and Kenny, G. N. C. (1999) Prediction
of movement at laryngeal mask airway insertion: comparison of auditory
evoked potential index, bispectral index, spectral edge frequency and median
frequency. Br. J. Anaesth. 82, 203–207.
Assessment of Sedation Depth 241
66. Kochs, E., Kalkman, C. J., Thornton, C., Newton, D., Bischoff, P., Kuppe, H.,
et al. (1999) Middle latency auditory evoked responses and electroencephalo-
graphic derived variable do not predict movement to noxious stimulation dur-
ing 1 minimum alveolar anesthetic concentration isoflurane/nitrous oxide
anesthesia. Anesth. Analg. 88, 1412–1417.
67. Katoh, T., Suzuki, A., and Ikeda, K. (1998) Electroencephalographic deriva-
tives as a tool for predicting the depth of sedation and anesthesia induced by
sevoflurane. Anesthesiology 88, 624–650.
68. Gan, T. J., Glass, P. S., Windsor, A., Payne, F., Rosow, C., Sebel, P., and
Manberg, P. (1997) BIS Utility Study Group. Bispectral index monitoring
allows faster emergence and improved recovery from propofol, alfentanil, and
nitrous oxide anesthesia. Anesthesiology 87, 808–815.
69. Steward, D. J. (1975) A simplified scoring system for the post-operative recov-
ery room. Can. Anaesth. Soc. J. 22, 111–113.
Sedated Patients: Nursing Perspectives 243
243
From: Contemporary Clinical Neuroscience: Sedation and Analgesia for Diagnostic and Therapeutic Procedures
Edited by: S. Malviya, N. N. Naughton, and K. K. Tremper © Humana Press Inc., Totowa, NJ
10
Nursing Perspectives
on the Care of Sedated Patients
Terri Voepel-Lewis, MSN, RN
1. INTRODUCTION
Recent changes in the health care environment have increased the demand
for sedation to facilitate medical and diagnostic procedures. First, there has
been an increased availability and utilization of various diagnostic and thera-
peutic procedures. Furthermore, it has become widely accepted that seda-
tion and analgesia decrease the patient’s anxiety, enhance the patient’s
comfort, and may thereby improve the success of any procedure (1). Addi-
tionally, the costs associated with sedation are less than those associated
with general anesthesia for similar procedures (2), and the amount of dis-
ruption in daily life is also perceived to be less. Finally, several short-acting
sedative agents have been introduced during the last few of decades that
may offer safer alternatives for use during procedures.
This increased demand for sedation requires the involvement of knowl-
edgeable and skilled teams of care providers to assure the provision of safe
and high-quality care (3). Typically, a primary care provider orders the pro-
cedure. However, an attending physician in the diagnostic procedures area
is responsible for the procedure itself and for the overall management of the
sedated patient. Additionally, it is the direct care provider, generally a nurse,
who is responsible for pre-procedural preparation, administration of seda-
tive agents, ongoing patient monitoring, discharge assessment, and patient
education. Although several providers may be involved with sedation of a pa-
tient, in a practical sense it is the nurse who ensures appropriateness of care,
and implementation and compliance with practice guidelines for every pa-
tient. Therefore, it is important that the nurse be fully aware of institutional
sedation practice guidelines, and be knowledgeable about all aspects of se-
dation care. This chapter examines the role and responsibilities of the nurse
who provides care for patients requiring sedation for a medical procedure,
244 Voepel-Lewis
and emphasizes the important risk factors and special considerations associ-
ated with sedation outside of the operating room.
2. PERSONNEL
Existing practice guidelines (1,4–7) recommend that one trained person
is responsible for the provision of care and monitoring of the patient through-
out a sedation episode; however, there is no consensus regarding the qualifi-
cations for sedation personnel (8). Recent literature suggests that in most
settings, this primary sedation care provider is a registered nurse (3,9–12).
Additionally, recent standards from the Joint Commission on the Accredita-
tion of Health Care Organizations (JCAHO) state that sufficient numbers of
qualified personnel, in addition to the licensed independent practitioner per-
forming the procedure, must be present during procedures using moderate
or deep sedation (7).
Competency-based training programs should be established in settings
providing sedation care, and nurses and other caregivers must demonstrate
proficiency prior to caring for sedated patients (12,13). Competency should
include knowledge of the pharmacology of the medications used and of fac-
tors that increase the potential for risks associated with sedation. Further-
more, the sedation care provider must be trained in the use of monitoring
and emergency equipment, and be able to recognize and respond to compli-
cations associated with sedation. National guidelines recommend minimal
training in basic life support (BLS), but some organizations require advanced
cardiac life support (ACLS) training for the sedation care provider. At the
least, the care provider must be capable of establishing a patent airway and
maintaining ventilation and oxygenation. Furthermore, an individual who is
capable of establishing intravenous (iv) access and one who is trained in
ACLS must be immediately available.
The nurse or sedation care provider should also be aware of state policies
on administration of sedation (12), as there are restrictions and policies
regarding sedation practices in many states (1). For instance, some states
mandate that a physician must be present in the room throughout a proce-
dure performed under sedation, and others simply require a physician to be
in the vicinity. Some states have policy statements regarding the authorized
involvement of unlicensed personnel in the care of sedated patients, and
others do not address this issue. Recent guidelines of the JCAHO mandate
that anesthesiology departments are responsible for ensuring the consistency
of sedation care throughout the institution. Furthermore, the JCAHO stipu-
lates that individuals who provide moderate to deep sedation must have the
appropriate credentials to manage patients at whatever level of sedation or