Engineering Materials Vol II (microstructures processing design) 2nd ed. - M. Ashby_ D. Jones (1999) Episode 7 doc
Bạn đang xem bản rút gọn của tài liệu. Xem và tải ngay bản đầy đủ của tài liệu tại đây (873.86 KB, 30 trang )
Structure of ceramics 171
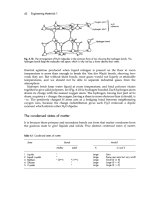
Fig. 16.4. Silicate structures. (a) The SiO
4
monomer. (b) The Si
2
O
7
dimer with a bridging oxygen.
(c) A chain silicate. (d) A sheet silicate. Each triangle is the projection of an SiO
4
monomer.
When the ratio MO/SiO
2
is a little less than 2/1, silica dimers form (Fig. 16.4b). One
oxygen is shared between two tetrahedra; it is called a bridging oxygen. This is the first
step in the polymerisation of the monomer to give chains, sheets and networks.
With decreasing amounts of metal oxide, the degree of polymerisation increases.
Chains of linked tetrahedra form, like the long chain polymers with a –C–C– back-
bone, except that here the backbone is an –Si–O–Si–O–Si– chain (Fig. 16.4c). Two
oxygens of each tetrahedron are shared (there are two bridging oxygens). The others
form ionic bonds between chains, joined by the MO. These are weaker than the –Si–
O–Si– bonds which form the backbone, so these silicates are fibrous; asbestos, for
instance, has this structure.
If three oxygens of each tetrahedron are shared, sheet structures form (Fig. 16.4d).
This is the basis of clays and micas. The additional M attaches itself preferentially to
one side of the sheet – the side with the spare oxygens on it. Then the sheet is polarised:
it has a net positive charge on one surface and a negative charge on the other. This
interacts strongly with water, attracting a layer of water between the sheets. This is
what makes clays plastic: the sheets of silicate slide over each other readily, lubricated
172 Engineering Materials 2
by the water layer. As you might expect, sheet silicates are very strong in the plane of
the sheet, but cleave or split easily between the sheets: think of mica and talc.
Pure silica contains no metal ions and every oxygen becomes a bridge between two
silicon atoms giving a three-dimensional network. The high-temperature form, shown in
Fig. 16.3(c), is cubic; the tetrahedra are stacked in the same way as the carbon atoms in
the diamond-cubic structure. At room temperature the stable crystalline form of silica
is more complicated but, as before, it is a three-dimensional network in which all the
oxygens bridge silicons.
Silicate glasses
Commercial glasses are based on silica. They are made of the same SiO
4
tetrahedra on
which the crystalline silicates are based, but they are arranged in a non-crystalline, or
amorphous, way. The difference is shown schematically in Fig. 16.5. In the glass, the
tetrahedra link at the corners to give a random (rather than a periodic) network. Pure
silica forms a glass with a high softening temperature (about 1200°C). Its great strength
and stability, and its low thermal expansion, suit it for certain special applications, but
it is hard to work with because its viscosity is high.
This problem is overcome in commercial glasses by introducing network modifiers to
reduce the viscosity. They are metal oxides, usually Na
2
O and CaO, which add posit-
ive ions to the structure, and break up the network (Fig. 16.5c). Adding one molecule
of Na
2
O, for instance, introduces two Na
+
ions, each of which attaches to an oxygen of
a tetrahedron, making it non-bridging. This reduction in cross-linking softens the glass,
reducing its glass temperature T
g
(the temperature at which the viscosity reaches such a
high value that the glass is a solid). Glance back at the table in Chapter 15 for generic
glasses; common window glass is only 70% SiO
2
: it is heavily modified, and easily
Fig. 16.5. Glass formation. A 3-co-ordinated crystalline network is shown at (a). But the bonding
requirements are still satisfied if a random (or glassy) network forms, as shown at (b). The network
is broken up by adding network modifiers, like Na
2
O, which interrupt the network as shown at (c).
Structure of ceramics 173
Fig. 16.6. A typical ceramic phase diagram: that for alloys of SiO
2
with Al
2
O
3
. The intermediate compound
3Al
2
O
3
SiO
2
is called mullite.
worked at 700°C. Pyrex is 80% SiO
2
; it contains less modifier, has a much better
thermal shock resistance (because its thermal expansion is lower), but is harder to
work, requiring temperatures above 800°C.
Ceramic alloys
Ceramics form alloys with each other, just as metals do. But the reasons for alloying
are quite different: in metals it is usually to increase the yield strength, fatigue strength
or corrosion resistance; in ceramics it is generally to allow sintering to full density, or
to improve the fracture toughness. But for the moment this is irrelevant; the point here
is that one deals with ceramic alloys just as one did with metallic alloys. Molten
oxides, for the most part, have large solubilities for other oxides (that is why they
make good fluxes, dissolving undesirable impurities into a harmless slag). On cooling,
they solidify as one or more phases: solid solutions or new compounds. Just as for
metals, the constitution of a ceramic alloy is described by the appropriate phase diagram.
Take the silica–alumina system as an example. It is convenient to treat the compon-
ents as the two pure oxides SiO
2
and Al
2
O
3
(instead of the three elements Si, Al and
O). Then the phase diagram is particularly simple, as shown in Fig. 16.6. There is a
compound, mullite, with the composition (SiO
2
)
2
(Al
2
O
3
)
3
, which is slightly more stable
than the simple solid solution, so the alloys break up into mixtures of mullite and
alumina, or mullite and silica. The phase diagram has two eutectics, but is otherwise
straightforward.
The phase diagram for MgO and Al
2
O
3
is similar, with a central compound, spinel,
with the composition MgOAl
2
O
3
. That for MgO and SiO
2
, too, is simple, with a com-
pound, forsterite, having the composition (MgO)
2
SiO
2
. Given the composition, the
equilibrium constitution of the alloy is read off the diagram in exactly the way de-
scribed in Chapter 3.
174 Engineering Materials 2
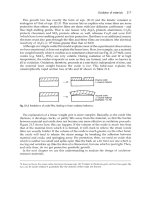
Fig. 16.7. Microstructural features of a crystalline ceramic: grains, grain boundaries, pores, microcracks
and second phases.
The microstructure of ceramics
Crystalline ceramics form polycrystalline microstructures, very like those of metals
(Fig. 16.7). Each grain is a more or less perfect crystal, meeting its neighbours at grain
boundaries. The structure of ceramic grain boundaries is obviously more complicated
than those in metals: ions with the same sign of charge must still avoid each other and,
as far as possible, valency requirements must be met in the boundary, just as they are
within the grains. But none of this is visible at the microstructural level, which for a
pure, dense ceramic, looks just like that of a metal.
Many ceramics are not fully dense. Porosities as high as 20% are a common feature
of the microstructure (Fig. 16.7). The pores weaken the material, though if they are
well rounded, the stress concentration they induce is small. More damaging are cracks;
they are much harder to see, but they are nonetheless present in most ceramics, left by
processing, or nucleated by differences in thermal expansion or modulus between
grains or phases. These, as we shall see in the next chapter, ultimately determine the
strength of the material. Recent developments in ceramic processing aim to reduce the
size and number of these cracks and pores, giving ceramic bodies with tensile strengths
as high as those of high-strength steel (more about that in Chapter 18).
Vitreous ceramics
Pottery and tiles survive from 5000 bc, evidence of their extraordinary corrosion resist-
ance and durability. Vitreous ceramics are today the basis of an enormous industry,
turning out bricks, tiles and white-ware. All are made from clays: sheet silicates such
as the hydrated alumino-silicate kaolin, Al
2
(Si
2
O
5
)(OH)
4
. When wet, the clay draws
water between the silicate sheets (because of its polar layers), making it plastic and
easily worked. It is then dried to the green state, losing its plasticity and acquiring
enough strength to be handled for firing. The firing – at a temperature between 800
Structure of ceramics 175
and 1200°C – drives off the remaining water, and causes the silica to combine with
impurities like CaO to form a liquid glass which wets the remaining solids. On cool-
ing, the glass solidifies (but is still a glass), giving strength to the final composite of
crystalline silicates bonded by vitreous bonds. The amount of glass which forms dur-
ing firing has to be carefully controlled: too little, and the bonding is poor; too much,
and the product slumps, or melts completely.
As fired, vitreous ceramics are usually porous. To seal the surface, a glaze is applied,
and the product refired at a lower temperature than before. The glaze is simply a
powdered glass with a low melting point. It melts completely, flows over the surface
(often producing attractive patterns or textures), and wets the underlying ceramic,
sucking itself into the pores by surface tension. When cold again, the surface is not
only impervious to water, it is also smooth, and free of the holes and cracks which
would lead to easy fracture.
Stone or rock
Sedimentary rocks (like sandstone) have a microstructure rather like that of a vitreous
ceramic. Sandstone is made of particles of silica, bonded together either by more silica
or by calcium carbonate (CaCO
3
). Like pottery, it is porous. The difference lies in the
way the bonding phase formed: it is precipitated from solution in ground water, rather
than formed by melting.
Igneous rocks (like granite) are much more like the SiO
2
–Al
2
O
3
alloys described in
the phase diagram of Fig. 16.6. These rocks have, at some point in their history, been
hot enough to have melted. Their structure can be read from the appropriate phase
diagram: they generally contain several phases and, since they have melted, they are
fully dense (though they still contain cracks nucleated during cooling).
Ceramic composites
Most successful composites combine the stiffness and hardness of a ceramic (like glass,
carbon, or tungsten carbide) with the ductility and toughness of a polymer (like epoxy)
or a metal (like cobalt). You will find all you need to know about them in Chapter 25.
Further reading
W. D. Kingery, H. F. Bowen, and D. R. Uhlman, Introduction to Ceramics, 2nd edition, Wiley, 1976.
I. J. McColm, Ceramic Science for Materials Technologists, Chapman and Hall, 1983.
Problems
16.1 Describe, in a few words, with an example or sketch as appropriate, what is
meant by each of the following:
176 Engineering Materials 2
(a) an ionic ceramic;
(b) a covalent ceramic;
(c) a chain silicate;
(d) a sheet silicate;
(e) a glass;
(f) a network modifier;
(g) the glass temperature;
(h) a vitreous ceramic;
(i) a glaze;
(j) a sedimentary rock;
(k) an igneous rock.
The mechanical properties of ceramics 177
Chapter 17
The mechanical properties of ceramics
Introduction
A Ming vase could, one would hope, perform its primary function – that of pleasing
the eye – without being subjected to much stress. Much glassware, vitreous ceramic
and porcelain fills its role without carrying significant direct load, though it must
withstand thermal shock (if suddenly heated or cooled), and the wear and tear of
normal handling. But others, such as brick, refractories and structural cement, are
deliberately used in a load-bearing capacity; their strength has a major influence on the
design in which they are incorporated. And others still – notably the high-performance
engineering ceramics and abrasives – are used under the most demanding conditions
of stress and temperature.
In this chapter we examine the mechanical properties of ceramics and, particularly,
what is meant by their “strength”.
The elastic moduli
Ceramics, like metals (but unlike polymers) have a well-defined Young’s modulus: the
value does not depend significantly on loading time (or, if the loading is cyclic, on
frequency). Ceramic moduli are generally larger than those of metals, reflecting the
greater stiffness of the ionic bond in simple oxides, and of the covalent bond in silic-
ates. And since ceramics are largely composed of light atoms (oxygen, carbon, silicon,
aluminium) and their structures are often not close-packed, their densities are low.
Because of this their specific moduli (E/
ρ
) are attractively high. Table 17.1 shows that
Table 17.1 Specific moduli: ceramics compared to metals
Material Modulus
E
Density
r
Specific modulus E/
r
(GPa) (Mg m
−
3
) (GPa/Mg m
−
3
)
Steels 210 7.8 27
Al alloys 70 2.7 26
Alumina, Al
2
O
3
390 3.9 100
Silica, SiO
2
69 2.6 27
Cement 45 2.4 19
178 Engineering Materials 2
alumina, for instance, has a specific modulus of 100 (compared to 27 for steel). This is
one reason ceramic or glass fibres are used in composites: their presence raises the
specific stiffness of the composite enormously. Even cement has a reasonable specific
stiffness – high enough to make boats out of it.
Strength, hardness and the lattice resistance
Ceramics are the hardest of solids. Corundum (Al
2
O
3
), silicon carbide (SiC) and, of
course, diamond (C) are used as abrasives: they will cut, or grind, or polish almost
anything – even glass, and glass is itself a very hard solid. Table 17.2 gives some feel
for this: it lists the hardness H, normalised by the Young’s modulus E, for a number
of pure metals and alloys, and for four pure ceramics. Pure metals (first column of
Table 17.2) have a very low hardness and yield strength (remember H ≈ 3
σ
y
). The main
purpose of alloying is to raise it. The second column shows that this technique is very
successful: the hardness has been increased from around 10
−3
E to about 10
−2
E. But
now look at the third column: even pure, unalloyed ceramics have hardnesses which
far exceed even the best metallic alloys. Why is this?
When a material yields in a tensile test, or when a hardness indenter is pressed into
it, dislocations move through its structure. Each test, in its own way, measures the
difficulty of moving dislocations in the material. Metals are intrinsically soft. When
atoms are brought together to form a metal, each loses one (or more) electrons to the
gas of free electrons which moves freely around the ion cores (Fig. 17.1a). The binding
energy comes from the general electrostatic interaction between the positive ions and
the negative electron gas, and the bonds are not localised. If a dislocation passes
through the structure, it displaces the atoms above its slip plane over those which lie
below, but this has only a small effect on the electron–ion bonding. Because of this,
there is a slight drag on the moving dislocation; one might liken it to wading through
tall grass.
Most ceramics are intrinsically hard; ionic or covalent bonds present an enormous
lattice resistance to the motion of a dislocation. Take the covalent bond first. The covalent
bond is localised; the electrons which form the bond are concentrated in the region
between the bonded atoms; they behave like little elastic struts joining the atoms
(Fig. 17.1b). When a dislocation moves through the structure it must break and reform
Table 17.2 Normalised hardness of pure metals, alloys and ceramics
Pure metal H/E Metal alloy H/E Ceramic H/E
Copper 1.2 × 10
−3
Brass 9 × 10
−3
Diamond 1.5 × 10
−1
Aluminium 1.5 × 10
−3
Dural (Al 4% Cu) 1.5 × 10
−2
Alumina 4 × 10
−2
Nickel 9 × 10
−4
Stainless steel 6 × 10
−3
Zirconia 6 × 10
−2
Iron 9 × 10
−4
Low alloy steel 1.5 × 10
−2
Silicon carbide 6 × 10
−2
Mean, metals 1 × 10
−3
Mean, alloys 1 × 10
−2
Mean, ceramics 8 × 10
−2
The mechanical properties of ceramics 179
Fig. 17.1. (a) Dislocation motion is intrinsically easy in pure metals – though alloying to give solid solutions
or precipitates can make it more difficult. (b) Dislocation motion in covalent solids is intrinsically difficult
because the interatomic bonds must be broken and reformed. (c) Dislocation motion in ionic crystals is easy
on some planes, but hard on others. The hard systems usually dominate.
these bonds as it moves: it is like traversing a forest by uprooting and then replanting
every tree in your path.
Most ionic ceramics are hard, though for a slightly different reason. The ionic bond,
like the metallic one, is electrostatic: the attractive force between a sodium ion (Na
+
)
and a chlorine ion (Cl
−
) is simply proportional to q
2
/r where q is the charge on an
electron and r the separation of the ions. If the crystal is sheared on the 45° plane
shown in Fig. 17.1(c) then like ions remain separated: Na
+
ions do not ride over Na
+
ions, for instance. This sort of shear is relatively easy – the lattice resistance opposing
it is small. But look at the other shear – the horizontal one. This does carry Na
+
ions
over Na
+
ions and the electrostatic repulsion between like ions opposes this strongly.
The lattice resistance is high. In a polycrystal, you will remember, many slip systems
are necessary, and some of them are the hard ones. So the hardness of a polycrystalline
ionic ceramic is usually high (though not as high as a covalent ceramic), even though
a single crystal of the same material might – if loaded in the right way – have a low
yield strength.
So ceramics, at room temperature, generally have a very large lattice resistance. The
stress required to make dislocations move is a large fraction of Young’s modulus:
typically, around E/30, compared with E/10
3
or less for the soft metals like copper or
180 Engineering Materials 2
lead. This gives to ceramics yield strengths which are of order 5 GPa – so high that the
only way to measure them is to indent the ceramic with a diamond and measure the
hardness.
This enormous hardness is exploited in grinding wheels which are made from small
particles of a high-performance engineering ceramic (Table 15.3) bonded with an
adhesive or a cement. In design with ceramics it is never necessary to consider plastic
collapse of the component: fracture always intervenes first. The reasons for this are as
follows.
Fracture strength of ceramics
The penalty that must be paid for choosing a material with a large lattice resistance is
brittleness: the fracture toughness is low. Even at the tip of a crack, where the stress is
intensified, the lattice resistance makes slip very difficult. It is the crack-tip plasticity
which gives metals their high toughness: energy is absorbed in the plastic zone, mak-
ing the propagation of the crack much more difficult. Although some plasticity can
occur at the tip of a crack in a ceramic too, it is very limited; the energy absorbed is
small and the fracture toughness is low.
The result is that ceramics have values of K
IC
which are roughly one-fiftieth of those
of good, ductile metals. In addition, they almost always contain cracks and flaws (see
Fig. 16.7). The cracks originate in several ways. Most commonly the production method
(see Chapter 19) leaves small holes: sintered products, for instance, generally contain
angular pores on the scale of the powder (or grain) size. Thermal stresses caused by
cooling or thermal cycling can generate small cracks. Even if there are no processing or
thermal cracks, corrosion (often by water) or abrasion (by dust) is sufficient to create
cracks in the surface of any ceramic. And if they do not form any other way, cracks
appear during the loading of a brittle solid, nucleated by the elastic anisotropy of the
grains, or by easy slip on a single slip system.
The design strength of a ceramic, then, is determined by its low fracture toughness
and by the lengths of the microcracks it contains. If the longest microcrack in a given
sample has length 2a
m
then the tensile strength is simply
σ
π
TS
IC
.=
K
a
m
(17.1)
Some engineering ceramics have tensile strengths about half that of steel – around
200 MPa. Taking a typical toughness of 2 MPa m
1/2
, the largest microcrack has a size of
60
µ
m, which is of the same order as the original particle size. (For reasons given
earlier, particle-size cracks commonly pre-exist in dense ceramics.) Pottery, brick
and stone generally have tensile strengths which are much lower than this – around
20 MPa. These materials are full of cracks and voids left by the manufacturing pro-
cess (their porosity is, typically, 5–20%). Again, it is the size of the longest crack – this
time, several millimetres long – which determines the strength. The tensile strength of
cement and concrete is even lower – as low as 2 MPa in large sections – implying the
presence of at least one crack a centimetre or more in length.
The mechanical properties of ceramics 181
Fig. 17.2. Tests which measure the fracture strengths of ceramics. (a) The tensile test measures the tensile
strength, s
TS
. (b) The bend test measures the modulus of rupture, s
r
, typically 1.7 × s
TS
. (c) The compression
test measures the crushing strength, s
c
, typically 15 × s
TS
.
Fig. 17.3. (a) In tension the largest flaw propagates unstably. (b) In compression, many flaws propagate
stably to give general crushing.
As we shall see, there are two ways of improving the strength of ceramics: decreas-
ing a
m
by careful quality control, and increasing K
IC
by alloying, or by making the
ceramic into a composite. But first, we must examine how strength is measured.
The common tests are shown in Fig. 17.2. The obvious one is the simple tensile test
(Fig. 17.2a). It measures the stress required to make the longest crack in the sample
propagate unstably in the way shown in Fig. 17.3(a). But it is hard to do tensile tests on
ceramics – they tend to break in the grips. It is much easier to measure the force
required to break a beam in bending (Fig. 17.2b). The maximum tensile stress in the
surface of the beam when it breaks is called the modulus of rupture,
σ
r
; for an elastic
beam it is related to the maximum moment in the beam, M
r
, by
182 Engineering Materials 2
σ
r
r
M
bd
=
6
2
(17.2)
where d is the depth and b the width of the beam. You might think that
σ
r
(which is
listed in Table 15.7) should be equal to the tensile strength
σ
TS
. But it is actually a little
larger (typically 1.7 times larger), for reasons which we will get to when we discuss
the statistics of strength in the next chapter.
The third test shown in Fig. 17.2 is the compression test. For metals (or any plastic
solid) the strength measured in compression is the same as that measured in tension.
But for brittle solids this is not so; for these, the compressive strength is roughly
15 times larger, with
σ
C
≈ 15
σ
TS
. (17.3)
The reason for this is explained by Fig. 17.3(b). Cracks in compression propagate
stably, and twist out of their original orientation to propagate parallel to the compression
axis. Fracture is not caused by the rapid unstable propagation of one crack, but the
slow extension of many cracks to form a crushed zone. It is not the size of the largest
crack (a
m
) that counts, but that of the average
a
. The compressive strength is still given
by a formula like eqn. (17.1), with
σ
π
C
IC
= C
K
a
(17.4)
but the constant C is about 15, instead of 1.
Thermal shock resistance
When you pour boiling water into a cold bottle and discover that the bottom drops out
with a smart pop, you have re-invented the standard test for thermal shock resistance.
Fracture caused by sudden changes in temperature is a problem with ceramics. But
while some (like ordinary glass) will only take a temperature “shock” of 80°C before
they break, others (like silicon nitride) will stand a sudden change of 500°C, and this is
enough to fit them for use in environments as violent as an internal combustion engine.
One way of measuring thermal shock resistance is to drop a piece of the ceramic,
heated to progressively higher temperatures, into cold water. The maximum temper-
ature drop ∆T (in K) which it can survive is a measure of its thermal shock resistance.
If its coefficient of expansion is
α
then the quenched surface layer suffers a shrinkage
strain of
α
∆T. But it is part of a much larger body which is still hot, and this constrains
it to its original dimensions: it then carries an elastic tensile stress E
α
∆T. If this tensile
stress exceeds that for tensile fracture,
σ
TS
, the surface of the component will crack and
ultimately spall off. So the maximum temperature drop ∆T is given by
E
α
∆T =
σ
TS
. (17.5)
Values of ∆T are given in Table 15.7. For ordinary glass,
α
is large and ∆T is small
– about 80°C, as we have said. But for most of the high-performance engineering
ceramics,
α
is small and
σ
TS
is large, so they can be quenched suddenly through
several hundred degrees without fracturing.
The mechanical properties of ceramics 183
Fig. 17.4. A creep curve for a ceramic.
Creep of ceramics
Like metals, ceramics creep when they are hot. The creep curve (Fig. 17.4) is just like
that for a metal (see Book 1, Chapter 17). During primary creep, the strain-rate de-
creases with time, tending towards the steady state creep rate
˙
ε
ss
= A
σ
n
exp(−Q/RT). (17.6)
Here
σ
is the stress, A and n are creep constants and Q is the activation energy for
creep. Most engineering design against creep is based on this equation. Finally, the
creep rate accelerates again into tertiary creep and fracture.
But what is “hot”? Creep becomes a problem when the temperature is greater than
about
1
3
T
m
. The melting point T
m
of engineering ceramics is high – over 2000°C – so
creep is design-limiting only in very high-temperature applications (refractories, for
instance). There is, however, one important ceramic – ice – which has a low melting
point and creeps extensively, following eqn. (17.6). The sliding of glaciers, and even
the spreading of the Antarctic ice-cap, are controlled by the creep of the ice; geophysic-
ists who model the behaviour of glaciers use eqn. (17.6) to do so.
Further reading
W. E. C. Creyke, I. E. J. Sainsbury, and R. Morrell, Design with Non-ductile Materials, Applied
Science Publishers, 1982.
R. W. Davidge, Mechanical Behaviour of Ceramics, Cambridge University Press, 1979.
D. W. Richardson, Modern Ceramic Engineering. Marcel Dekker, 1982.
Problems
17.1 Explain why the yield strengths of ceramics can approach the ideal strength
˜
σ
,
whereas the yield strengths of metals are usually much less than
˜
σ
. How would
you attempt to measure the yield strength of a ceramic, given that the fracture
strengths of ceramics in tension are usually much less than the yield strengths?
184 Engineering Materials 2
17.2 Why are ceramics usually much stronger in compression than in tension?
Al
2
O
3
has a fracture toughness K
IC
of about 3 MPa m
1/2
. A batch of Al
2
O
3
samples is found to contain surface flaws about 30
µ
m deep. Estimate (a) the
tensile strength and (b) the compressive strength of the samples.
Answers: (a) 309 MPa, (b) 4635 MPa.
17.3 Modulus-of-rupture tests are carried out using the arrangement shown in Fig. 17.2.
The specimens break at a load F of about 330 N. Find the modulus of rupture,
given that l = 50 mm, and that b = d = 5 mm.
Answer: 198 MPa.
17.4 Estimate the thermal shock resistance ∆T for the ceramics listed in Table 15.7. Use
the data for Young’s modulus E, modulus of rupture
σ
r
and thermal expansion
coefficient
α
given in Table 15.7. How well do your calculated estimates of ∆T
agree with the values given for ∆T in Table 15.7?
[Hints: (a) assume that
σ
TS
≈
σ
r
for the purposes of your estimates; (b) where there
is a spread of values for E,
σ
r
or
α
, use the average values for your calculation.]
The statistics of brittle fracture and case study 185
Chapter 18
The statistics of brittle fracture and case study
Introduction
The chalk with which I write on the blackboard when I teach is a brittle solid. Some
sticks of chalk are weaker than others. On average, I find (to my slight irritation), that
about 3 out of 10 sticks break as soon as I start to write with them; the other 7 survive.
The failure probability, P
f
, for this chalk, loaded in bending under my (standard)
writing load is 3/10, that is
P
f
= 0.3. (18.1)
When you write on a blackboard with chalk, you are not unduly inconvenienced if
3 pieces in 10 break while you are using it; but if 1 in 2 broke, you might seek an
alternative supplier. So the failure probability, P
f
, of 0.3 is acceptable (just barely). If
the component were a ceramic cutting tool, a failure probability of 1 in 100 (P
f
= 10
−2
)
might be acceptable, because a tool is easily replaced. But if it were the window of a
vacuum system, the failure of which can cause injury, one might aim for a P
f
of 10
−6
;
and for a ceramic protective tile on the re-entry vehicle of a space shuttle, when one
failure in any one of 10,000 tiles could be fatal, you might calculate that a P
f
of 10
−8
was
needed.
When using a brittle solid under load, it is not possible to be certain that a compon-
ent will not fail. But if an acceptable risk (the failure probability) can be assigned to the
function filled by the component, then it is possible to design so that this acceptable
risk is met. This chapter explains why ceramics have this dispersion of strength; and
shows how to design components so they have a given probability of survival. The
method is an interesting one, with application beyond ceramics to the malfunctioning
of any complex system in which the breakdown of one component will cause the
entire system to fail.
The statistics of strength and the Weibull distribution
Chalk is a porous ceramic. It has a fracture toughness of 0.9 MPa m
1/2
and, being
poorly consolidated, is full of cracks and angular holes. The average tensile strength of
a piece of chalk is 15 MPa, implying an average length for the longest crack of about
1 mm (calculated from eqn. 17.1). But the chalk itself contains a distribution of crack
lengths. Two nominally identical pieces of chalk can have tensile strengths that differ
greatly – by a factor of 3 or more. This is because one was cut so that, by chance, all the
cracks in it are small, whereas the other was cut so that it includes one of the longer
186 Engineering Materials 2
Fig. 18.1. If small samples are cut from a large block of a brittle ceramic, they will show a dispersion of
strengths because of the dispersion of flaw sizes. The average strength of the small samples is greater than
that of the large sample.
flaws of the distribution. Figure 18.1 illustrates this: if the block of chalk is cut into
pieces, piece A will be weaker than piece B because it contains a larger flaw. It is
inherent in the strength of ceramics that there will be a statistical variation in strength.
There is no single “tensile strength”; but there is a certain, definable, probability that a
given sample will have a given strength.
The distribution of crack lengths has other consequences. A large sample will fail at
a lower stress than a small one, on average, because it is more likely that it will contain
one of the larger flaws (Fig. 18.1). So there is a volume dependence of the strength. For
the same reason, a ceramic rod is stronger in bending than in simple tension: in
tension the entire sample carries the tensile stress, while in bending only a thin layer
close to one surface (and thus a relatively smaller volume) carries the peak tensile
stress (Fig. 18.2). That is why the modulus of rupture (Chapter 17, eqn. 17.2) is larger
than the tensile strength.
The Swedish engineer, Weibull, invented the following way of handling the statist-
ics of strength. He defined the survival probability P
s
(V
0
) as the fraction of identical
samples, each of volume V
0
, which survive loading to a tensile stress
σ
. He then
proposed that
PV
s
m
( ) exp
0
0
=−
σ
σ
(18.2)
where
σ
0
and m are constants. This equation is plotted in Fig. 18.3(a). When
σ
= 0 all
the samples survive, of course, and P
s
(V
0
) = 1. As
σ
increases, more and more samples
fail, and P
s
(V
0
) decreases. Large stresses cause virtually all the samples to break, so
P
s
(V
0
) → 0 and
σ
→ ∞.
If we set
σ
=
σ
0
in eqn. (18.2) we find that P
s
(V
0
) = 1/e (=0.37). So
σ
0
is simply the
tensile stress that allows 37% of the samples to survive. The constant m tells us how
The statistics of brittle fracture and case study 187
Fig. 18.2. Ceramics appear to be stronger in bending than in tension because the largest flaw may not be
near the surface.
Fig. 18.3. (a) The Weibull distribution function. (b) When the modulus,
m
, changes, the survival probability
changes as shown.
rapidly the strength falls as we approach
σ
0
(see Fig. 18.3b). It is called the Weibull
modulus. The lower m, the greater the variability of strength. For ordinary chalk, m is
about 5, and the variability is great. Brick, pottery and cement are like this too. The
engineering ceramics (e.g. SiC, Al
2
O
3
and Si
3
N
4
) have values of m of about 10; for these,
the strength varies rather less. Even steel shows some variation in strength, but it is
small: it can be described by a Weibull modulus of about 100. Figure 18.3(b) shows
that, for m ≈ 100, a material can be treated as having a single, well-defined failure
stress.
σ
0
and m can be found from experiment. A batch of samples, each of volume V
0
, is
tested at a stress
σ
1
and the fraction P
s1
(V
0
) that survive is determined. Another batch
is tested at
σ
2
and so on. The points are then plotted on Fig. 18.3(b). It is easy to
determine
σ
0
from the graph, but m has to be found by curve-fitting. There is a better
way of plotting the data which allows m to be determined more easily. Taking natural
logs in eqn. (18.2) gives
ln
()
1
00
PV
s
m
=
σ
σ
. (18.3)
188 Engineering Materials 2
Fig. 18.4. Survival probability plotted on “Weibull probability” axes for samples of volume
V
0
. This is just
Fig. 18.3(b) plotted with axes that straighten out the lines of constant
m
.
And taking logs again gives
ln ln
()
ln .
1
00
PV
m
s
=
σ
σ
(18.4)
Thus a plot of ln {ln (1/P
s
(V
0
)) } against 1n (
σ
/
σ
0
) is a straight line of slope m. Weibull-
probability graph paper does the conversion for you (see Fig. 18.4).
So much for the stress dependence of P
s
. But what of its volume dependence? We
have already seen that the probability of one sample surviving a stress
σ
is P
s
(V
0
). The
probability that a batch of n such samples all survive the stress is just {P
s
(V
0
)}
n
. If these
n samples were stuck together to give a single sample of volume V = nV
0
then its
survival probability would still be {P
s
(V
0
)}
n
. So
PV PV PV
ss
n
s
VV
() {( )} {( )} .==
00
0
/
(18.5)
This is equivalent to
ln ( ) ln ( )PV
V
V
PV
ss
=
0
0
(18.6)
or
PV
V
V
PV
ss
( ) exp ln ( ) .=
0
0
(18.7)
The Weibull distribution (eqn. 18.2) can be rewritten as
ln ( ) .PV
s
m
0
0
=−
σ
σ
(18.8)
The statistics of brittle fracture and case study 189
If we insert this result into eqn. (18.7) we get
P V
V
V
s
m
( ) exp ,=−
00
σ
σ
(18.9)
or
ln ( ) PV
V
V
s
m
=−
00
σ
σ
.
This, then, is our final design equation. It shows how the survival probability depends
on both the stress
σ
and the volume V of the component. In using it, the first step is to
fix on an acceptable failure probability, P
f
: 0.3 for chalk, 10
−2
for the cutting tool, 10
−6
for the vacuum-chamber window. The survival probability is then given by P
s
= 1 − P
f
.
(It is useful to remember that, for small P
f
, 1n P
s
= ln (1 − P
f
) ≈ −P
f
.) We can then
substitute suitable values of
σ
0
, m and V/V
0
into the equation to calculate the design
stress.
The time-dependence of ceramic strength
Most people, at some point in their lives, have been startled by the sudden disintegra-
tion, apparently without cause, of a drinking glass (a “toughened” glass, almost always),
or the spontaneous failure of an automobile windshield. These poltergeist-like happen-
ings are caused by slow crack growth.
To be more specific, if a glass rod at room temperature breaks under a stress
σ
in a
short time t, then an identical rod stressed at 0.75
σ
will break in a time of order 10t.
Most oxides behave like this, which is something which must be taken into account in
engineering design. Carbides and nitrides (e.g. SiC or Si
3
N
4
) do not suffer from this
time-dependent failure at room temperature, although at high temperatures they may do
so. Its origin is the slow growth of surface microcracks caused by a chemical interac-
tion between the ceramic and the water in its environment. Water or water vapour
reaching the crack tip reacts chemically with molecules there to form a hydroxide,
breaking the Si–O–Si or M–O–M bonds (Fig. 18.5). When the crack has grown to the
critical length for failure at that stress level (eqn. 17.1) the part fails suddenly, often
after a long period. Because it resembles fatigue failure, but under static load, it is
sometimes called “static fatigue”. Toughened glass is particularly prone to this sort of
failure because it contains internal stresses which can drive the slow crack growth, and
which drive spontaneous fast fracture when the crack grows long enough.
Fracture mechanics can be applied to this problem, much as it is to fatigue. We use
only the final result, as follows. If the standard test which was used to measure
σ
TS
takes a time t(test), then the stress which the sample will support safely for a time t is
σ
σ
TS
(test)
=
n
t
t
(18.10)
190 Engineering Materials 2
where n is the slow crack-growth exponent. Its value for oxides is between 10 and 20
at room temperature. When n = 10, a factor of 10 in time reduces the strength by 20%.
For carbides and nitrides, n can be as large as 100; then a factor of 10 in time reduces
the strength by only 2%. (Data for n are included in Table 15.7) An example of the use
of this equation is given in the following case study.
C
ASE
STUDY
:
THE
DESIGN
OF
PRESSURE
WINDOWS
Glass can support large static loads for long times. Aircraft windows support a pres-
sure difference of up to 1 atmosphere. Windows of tall buildings support wind loads;
diving bells have windows which support large water pressures; glass vacuum equip-
ment carries stress due to the pressure differences at which it operates. In Cambridge
(UK) there is a cake shop with glass shelves, simply supported at both ends, which on
weekdays are so loaded with cakes that the centre deflects by some centimetres. The
owners (the Misses Fitzbillies) say that they have loaded them like this, without
mishap, for decades. But what about cake-induced slow crack growth? In this case
study, we analyse safe design with glass under load.
Consider the design of a glass window for a vacuum chamber (Fig. 18.6). It is a
circular glass disc of radius R and thickness t, freely supported in a rubber seal around
its periphery and subjected to a uniform pressure difference ∆p = 0.1 MPa (1 atmo-
sphere). The pressure bends the disc. We shall simply quote the result of the stress
analysis of such a disc: it is that the peak tensile stress is on the low-pressure face of
the window and has magnitude
σ
max
(
.=
+33
8
2
2
v
p
R
t
)
∆
(18.11)
Fig. 18.5. Slow crack growth caused by surface hydration of oxide ceramics.
The statistics of brittle fracture and case study 191
Table 18.1 Properties of soda glass
Modulus
E
(GPa) 74
Compressive strength s
c
(MPa) 1000
Modulus of rupture s
r
(MPa) 50
Weibull modulus
m
10
Time exponent
n
10
Fracture toughness
K
IC
(MPa m
1/2
) 0.7
Thermal shock resistance D
T
(K) 84
Fig. 18.6. A flat-faced pressure window. The pressure difference generates tensile stresses in the low-
pressure face.
Poisson’s ratio v for ceramics is close to 0.3 so that
σ
max
.≈∆p
R
t
2
2
(18.12)
The material properties of window glass are summarised in Table 18.1. To use these
data to calculate a safe design load, we must assign an acceptable failure probability to
the window, and decide on its design life. Failure could cause injury, so the window is
a critical component: we choose a failure probability of 10
−6
. The vacuum system is
designed for intermittent use and is seldom under vacuum for more than 1 hour, so
the design life under load is 1000 hours.
The modulus of rupture (
σ
r
= 50 MPa) measures the mean strength of the glass in a
short-time bending test. We shall assume that the test sample used to measure
σ
r
had
dimensions similar to that of the window (otherwise a correction for volume is neces-
sary) and that the test time was 10 minutes. Then the Weibull equation (eqn. 18.9) for
a failure probability of 10
−6
requires a strength-reduction factor of 0.25. And the static
fatigue equation (eqn. 18.10) for a design life of 1000 hours [t/t(test) ≈ 10
4
] requires
a reduction factor of 0.4. For this critical component, a design stress
σ
= 50 MPa × 0.25
× 0.4 = 5.0 MPa meets the requirements. We apply a further safety factor of S = 1.5
to allow for uncertainties in loading, unforeseen variability and so on.
192 Engineering Materials 2
We may now specify the dimensions of the window. Inverting eqn. (18.12) gives
t
R
Sp
. .=
∆
=
σ
12
017
/
(18.13)
A window designed to these specifications should withstand a pressure difference of
1 atmosphere for 1000 hours with a failure probability of better than 10
−6
– provided,
of course, that it is not subject to thermal stresses, impact loads, stress concentrations
or contact stresses. The commonest mistake is to overtighten the clamps holding
the window in place, generating contact stresses: added to the pressure loading, they
can lead to failure. The design shown in Fig. 18.6 has a neoprene gasket to distribute
the clamping load, and a large number of clamping screws to give an even clamping
pressure.
If, for reasons of weight, a thinner window is required, two options are open to the
designer. The first is to select a different material. Thermally toughened glass (quenched
in such a way as to give compressive surface stress) has a modulus of rupture which is
3 times greater than that of ordinary glass, allowing a window
3
times thinner than
before. The second is to redesign the window itself. If it is made in the shape of a
hemisphere (Fig. 18.7) the loading in the glass caused by a pressure difference is
purely compressive (
σ
max
= [∆pR/2t]). Then we can utilise the enormous compressive
strength of glass (1000 MPa) to design a window for which t/R is 7 × 10
−5
with the
same failure probability and life.
There is, of course, a way of cheating the statistics. If a batch of components has a
distribution of strengths, it is possible to weed out the weak ones by loading them all
up to a proof stress (say
σ
0
); then all those with big flaws will fail, leaving the fraction
which were stronger than
σ
0
. Statistically speaking, proof testing selects and rejects the
low-strength tail of the distribution. The method is widely used to reduce the prob-
ability of failure of critical components, but its effectiveness is undermined by slow
crack growth which lets a small, harmless, crack grow with time into a large, dangerous
Fig. 18.7. A hemispherical pressure window. The shape means that the glass is everywhere in compression.
The statistics of brittle fracture and case study 193
one. The only way out is to proof test regularly throughout the life of the structure
– an inconvenient, often impractical procedure. Then design for long-term safety is
essential.
Further reading
R. W. Davidge, Mechanical Properties of Ceramics, Cambridge University Press, 1979.
W. E. C. Creyke, I. E. J. Sainsbury, and R. Morrell, Design with Non-ductile Materials, Applied
Science Publishers, 1982.
D. W. Richardson, Modern Ceramic Engineering, Marcel Dekker, 1982.
Problems
18.1 In order to test the strength of a ceramic, cylindrical specimens of length 25 mm
and diameter 5 mm are put into axial tension. The tensile stress σ which causes
50% of the specimens to break is 120 MPa. Cylindrical ceramic components of
length 50 mm and diameter 11 mm are required to withstand an axial tensile
stress σ
1
with a survival probability of 99%. Given that m = 5, use eqn. (18.9) to
determine σ
1
.
Answer: 32.6 MPa.
18.2 Modulus-of-rupture tests were carried out on samples of silicon carbide using the
three-point bend test geometry shown in Fig. 17.2. The samples were 100 mm
long and had a 10 mm by 10 mm square cross section. The median value of the
modulus of rupture was 400 MPa. Tensile tests were also carried out using
samples of identical material and dimensions, but loaded in tension along their
lengths. The median value of the tensile strength was only 230 MPa. Account in a
qualitative way for the difference between the two measures of strength.
Answer: In the tensile test, the whole volume of the sample is subjected to a
tensile stress of 230 MPa. In the bend test, only the lower half of the sample is
subjected to a tensile stress. Furthermore, the average value of this tensile stress
is considerably less than the peak value of 400 MPa (which is only reached at
the underside of the sample beneath the central loading point). The probability of
finding a fracture-initiating defect in the small volume subjected to the highest
stresses is small.
18.3 Modulus-of-rupture tests were done on samples of ceramic with dimensions
l = 100 mm, b = d = 10 mm. The median value of
σ
r
(i.e.
σ
r
for P
s
= 0.5) was
300 MPa. The ceramic is to be used for components with dimensions l = 50 mm,
b = d = 5 mm loaded in simple tension along their length. Calculate the tensile
stress σ that will give a probability of failure, P
f
, of 10
–6
. Assume that m = 10. Note
that, for m = 10,
σ
TS
=
σ
r
/1.73.
Answer: 55.7 MPa.
194 Engineering Materials 2
Chapter 19
Production, forming and joining of ceramics
Introduction
When you squeeze snow to make a snowball, you are hot-pressing a ceramic. Hot-
pressing of powders is one of several standard sintering methods used to form ceramics
which require methods appropriate to their special properties.
Glass, it is true, becomes liquid at a modest temperature (1000°C) and can be cast
like a metal. At a lower temperature (around 700°C) it is very viscous, and can again
be formed by the methods used for metals: rolling, pressing and forging. But the
engineering ceramics have high melting points – typically 2000°C – precluding the
possibility of melting and casting. And they lack the plasticity which allows the wide
range of secondary forming processes used for metals: forging, rolling, machining and
so forth. So most ceramics are made from powders which are pressed and fired, in
various ways, to give the final product shape.
Vitreous ceramics are different. Clay, when wet, is hydroplastic: the water is drawn
between the clay particles, lubricating their sliding, and allowing the clay to be formed
by hand or with simple machinery. When the shaped clay is dried and fired, one com-
ponent in it melts and spreads round the other components, bonding them together.
Low-grade ceramics – stone, and certain refractories – are simply mined and shaped.
We are concerned here not with these, but with the production and shaping of high-
performance engineering ceramics, clay products and glasses. Cement and concrete
are discussed separately in Chapter 20. We start with engineering ceramics.
The production of engineering ceramics
Alumina powder is made from bauxite, a hydrated aluminium oxide with the formula
Al(OH)
3
, of which there are large deposits in Australia, the Caribbean and Africa.
After crushing and purification, the bauxite is heated at 1150°C to decompose it to
alumina, which is then milled and sieved
2Al(OH)
3
= Al
2
O
3
+ 3H
2
O. (19.1)
Zirconia, ZrO
2
, is made from the natural hydrated mineral, or from zircon, a silicate.
Silicon carbide and silicon nitride are made by reacting silicon with carbon or nitro-
gen. Although the basic chemistry is very simple, the processes are complicated by the
need for careful quality control, and the goal of producing fine (<1
µ
m) powders
which, almost always, lead to a better final product.
These powders are then consolidated by one of a number of methods.
Production, forming and joining of ceramics 195
Fig. 19.2. The microscopic mechanism of sintering. Atoms leave the grain boundary in the neck between two
particles and diffuse into the pore, filling it up.
Fig. 19.1. Powder particles pressed together at (a) sinter, as shown at (b), reducing the surface area (and
thus energy) of the pores; the final structure usually contains small, nearly spherical pores (c).
Forming of engineering ceramics
The surface area of fine powders is enormous. A cupful of alumina powder with a
particle size of 1
µ
m has a surface area of about 10
3
m
2
. If the surface energy of alumina
is 1 J m
−2
, the surface energy of the cupful of powder is 1 kJ.
This energy drives sintering (Fig. 19.1). When the powder is packed together and
heated to a temperature at which diffusion becomes very rapid (generally, to around
2
3
T
m
), the particles sinter, that is, they bond together to form small necks which then
grow, reducing the surface area, and causing the powder to densify. Full density is not
reached by this sort of sintering, but the residual porosity is in the form of small,
rounded holes which have only a small effect on mechanical strength.
Figure 19.2 shows, at a microscopic level, what is going on. Atoms diffuse from the
grain boundary which must form at each neck (since the particles which meet there
have different orientations), and deposit in the pore, tending to fill it up. The atoms
move by grain boundary diffusion (helped a little by lattice diffusion, which tends to be
slower). The reduction in surface area drives the process, and the rate of diffusion
controls its rate. This immediately tells us the two most important things we need to
know about solid state sintering:
(a) Fine particles sinter much faster than coarse ones because the surface area (and
thus the driving force) is higher, and because the diffusion distances are smaller.