Engineering Materials Vol II (microstructures processing design) 2nd ed. - M. Ashby_ D. Jones (1999) Episode 11 ppt
Bạn đang xem bản rút gọn của tài liệu. Xem và tải ngay bản đầy đủ của tài liệu tại đây (1.09 MB, 30 trang )
Design with materials 291
be designed to snap together, making assembly fast and cheap. And by accurately
sizing the mould, and using pre-coloured polymer, no finishing operations are neces-
sary. So great economies of manufacture are possible: polymer parts really can be
cheap. But are they inferior? Not necessarily. Polymer densities are low (all are near
1 Mg m
−3
); they are corrosion-resistant; they have abnormally low coefficients of fric-
tion; and the low modulus and high strength allows very large elastic deformations.
Because of these special properties, polymer parts may be distinctly superior.
Composites overcome many of the remaining deficiencies. They are stiff, strong and
tough. Their problem lies in their cost: composite components are usually expensive,
and they are difficult and expensive to form and join. So, despite their attractive
properties, the designer will use them only when the added performance offsets the
added expense.
New materials are appearing all the time. New polymers with greater stiffness and
toughness appear every year; composites are becoming cheaper as the volume of their
production increases. Ceramics with enough toughness to be used in conventional
design are becoming available, and even in the metals field, which is a slowly devel-
oping one, better quality control, and better understanding of alloying, leads to
materials with reliably better properties. All of these offer new opportunities to the
designer who can frequently redesign an established product, making use of the prop-
erties of new materials, to reduce its cost or its size and improve its performance and
appearance.
Design methodology
Books on design often strike the reader as vague and qualitative; there is an implica-
tion that the ability to design is like the ability to write music: a gift given to few. And
it is true that there is an element of creative thinking (as opposed to logical reasoning
or analysis) in good design. But a design methodology can be formulated, and when
followed, it will lead to a practical solution to the design problem.
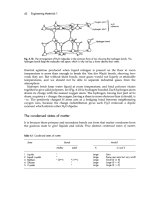
Figure 27.1 summarises the methodology for designing a component which must
carry load. At the start there are two parallel streams: materials selection and com-
ponent design. A tentative material is chosen and data for it are assembled from data
sheets like the ones given in this book or from data books (referred to at the end of this
chapter). At the same time, a tentative component design is drawn up, able to fill the
function (which must be carefully defined at the start); and an approximate stress
analysis is carried out to assess the stresses, moments, and stress concentrations to
which it will be subjected.
The two streams merge in an assessment of the material performance in the tentat-
ive design. If the material can bear the loads, moments, concentrated stresses (etc.)
without deflecting too much, collapsing or failing in some other way, then the design
can proceed. If the material cannot perform adequately, the first iteration takes place:
either a new material is chosen, or the component design is changed (or both) to
overcome the failing.
The next step is a detailed specification of the design and of the material. This may
require a detailed stress analysis, analysis of the dynamics of the system, its response
292 Engineering Materials 2
Fig. 27.1. Design methodology.
Design with materials 293
to temperature and environment, and a detailed consideration of the appearance and
feel (the aesthetics of the product). And it will require better material data: at this point
it may be necessary to get detailed material properties from possible suppliers, or to
conduct tests yourself.
The design is viable only if it can be produced economically. The choice of produc-
tion and fabrication method is largely determined by the choice of material. But the
production route will also be influenced by the size of the production run, and how
the component will be finished and joined to other components; each class of material
has its own special problems here; they were discussed in Chapters 14, 19, 24 and 25.
The choice of material and production route will, ultimately, determine the price of the
product, so a second major iteration may be required if the costing shows the price to
be too high. Then a new choice of material or component design, allowing an altern-
ative production path, may have to be considered.
At this stage a prototype product is produced, and its performance in the market is
assessed. If this is satisfactory, full-scale production is established. But the designer’s
role does not end at this point. Continuous analysis of the performance of a compon-
ent usually reveals weaknesses or ways in which it could be improved or made more
cheaply. And there is always scope for further innovation: for a radically new design,
or for a radical change in the material which the component is made from. Successful
designs evolve continuously, and only in this way does the product retain a competit-
ive position in the market place.
Further reading
(a) Design
G. Pahl and W. Beitz, Engineering Design, The Design Council, 1984.
V. Papanek, Design for the Real World, Random House, 1971.
(b) Metals
ASM Metals Handbook, 8th edition, American Society for Metals, 1973.
Smithells’ Metals Reference Book, 7th edition, Butterworth-Heinemann, 1992.
(c) Ceramics
W. E. C. Creyke, I. E. J. Sainsbury, and R. Morrell, Design with Non-Ductile Materials, Applied
Science Publishers, 1982.
D. W. Richardson, Modern Ceramic Engineering, Marcel Dekker, 1982.
(d) Polymers
DuPont Design Handbooks, DuPont de Nemours and Co., Polymer Products Department,
Wilmington, Delaware 19898, USA, 1981.
ICI Technical Services Notes, ICI Plastics Division, Engineering Plastics Group, Welwyn Garden
City, Herts., England, 1981.
294 Engineering Materials 2
(e) Materials selection
J. A. Charles and F. A. A. Crane, Selection and Use of Engineering Materials, 2nd edition, Butterworth-
Heinemann, 1989.
M. F. Ashby, Materials Selection in Mechanical Design, Pergamon, 1992.
M. F. Ashby and D. Cebon, Case Studies in Materials Selection, Granta Design, 1996.
Problems
27.1 You have been asked to prepare an outline design for the pressure hull of a deep-
sea submersible vehicle capable of descending to the bottom of the Mariana Trench
in the Pacific Ocean. The external pressure at this depth is approximately 100 MPa,
and the design pressure is to be taken as 200 MPa. The pressure hull is to have
the form of a thin-walled sphere with a specified radius r of 1 m and a uniform
thickness t. The sphere can fail in one of two ways:
external-pressure buckling at a pressure p
b
given by
pE
t
r
b
.,=
03
2
where E is Young’s modulus; yield or compressive failure at a pressure p
f
given
by
p
t
r
ff
,=
2
σ
where
σ
f
is the yield stress or the compressive failure stress as appropriate.
The basic design requirement is that the pressure hull shall have the min-
imum possible mass compatible with surviving the design pressure.
By eliminating t from the equations, show that the minimum mass of the hull is
given by the expressions
mrp
E
b
b
.,
.
.
=
22 9
305
05
ρ
for external-pressure buckling, and
mrp
ff
f
,=
2
3
π
ρ
σ
for yield or brittle compressive failure. Hence obtain a merit index to meet the
design requirement for each of the two failure mechanisms. [You may assume
that the surface area of the sphere is 4
π
r
2
.]
Answers: E
0.5
/
ρ
for external-pressure buckling;
σ
f
/
ρ
for yield or brittle compressive
failure.
27.2 For each material listed in the following table, calculate the minimum mass and
wall thickness of the pressure hull of Problem 27.1 for both failure mechanisms at
the design pressure.
Design with materials 295
Material
E
(GPa)
s
f
(MPa) Density,
r
(kg m
−
3
)
Alumina 390 5000 3900
Glass 70 2000 2600
Alloy steel 210 2000 7800
Titanium alloy 120 1200 4700
Aluminium alloy 70 500 2700
Hence determine the limiting failure mechanism for each material. [Hint: this is
the failure mechanism which gives the larger of the two values of t.]
What is the optimum material for the pressure hull? What are the mass, wall
thickness and limiting failure mechanism of the optimum pressure hull?
Answers:
Material
m
b
(tonne)
t
b
(mm)
m
f
(tonne)
t
f
(mm) Limiting failure mechanism
Alumina 2.02 41 0.98 20 Buckling
Glass 3.18 97 1.63 50 Buckling
Alloy steel 5.51 56 4.90 50 Buckling
Titanium alloy 4.39 74 4.92 83 Yielding
Aluminium alloy 3.30 97 6.79 200 Yielding
The optimum material is alumina, with a mass of 2.02 tonne, a wall thickness of
41 mm and a limiting failure mechanism of external-pressure buckling.
27.3 Briefly describe the processing route which you would specify for making the
pressure hull of Problem 27.2 from each of the materials listed in the table. Com-
ment on any particular problems which might be encountered. [You may assume
that the detailed design will call for a number of apertures in the wall of the
pressure hull.]
296 Engineering Materials 2
Chapter 28
Case studies in design
1. D
ESIGNING
WITH
METALS
:
CONVEYOR
DRUMS
FOR
AN
IRON
ORE
TERINAL
Introduction
The conveyor belt is one of the most efficient devices available for moving goods over
short distances. Billions of tons of minerals, foodstuffs and consumer goods are
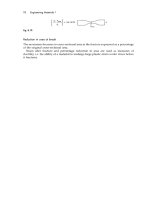
handled in this way every year. Figure 28.1 shows the essentials of a typical conveyor
system. The following data are typical of the largest conveyors, which are used for
handling coal, iron ore and other heavy minerals.
Capacity: 5000 tonne h
−1
Belt speed: 4 m s
−1
Belt tension: 5 tonne
Motor rating: 250 k W
Belt section: 1.5 m wide × 11 mm thick
Distance between centres of tail drum and drive drum: 200 m
Fig. 28.1. Schematic of a typical conveyor system. Because the belt tends to sag between the support rollers
it must be kept under a constant tension
T
. This is done by hanging a large weight on the tension drum. The
drive is supplied by coupling a large electric motor to the shaft of the drive drum
via
a suitable gearbox and
overload clutch.
Case studies in design 297
It is important that conveyor systems of this size are designed to operate continuously
for long periods with minimum “down-time” for routine maintenance: the unsched-
uled breakdown of a single unit in an integrated plant could lead to a total loss of
production. Large conveyors include a number of critical components which are
designed and built essentially as “one-offs” for a particular installation: it is doubly
important to check these at the design stage because a failure here could lead to a
damagingly long down-time while a harassed technical manager phones the length
of the country looking for fabrication shops with manoeuvrable capacity, and steel
merchants with the right sections in stock.
Tail drum design
The tail drum (Fig. 28.1) is a good example of a critical component. Figure 28.2 shows
the general arrangement of the drum in its working environment and Fig. 28.3 shows
a detailed design proposal. We begin our design check by looking at the stresses in the
shaft. The maximum stress comes at the surface of the shaft next to the shaft-plate
weld (Fig. 28.4). We can calculate the maximum stress from the standard formula
σ
max
=
Mc
I
(28.1)
where the bending moment M is given by
M = Fx (28.2)
and the second moment of area of the shaft is given by
I
c
.=
π
4
4
(28.3)
Using values of F = 5000 × 9.81 N, x = 380 mm, and c = 75 mm, we get a value for
σ
max
of 56 MPa.
This stress is only a quarter of the yield stress of a typical structural steel, and the
shaft therefore has an ample factor of safety against failure by plastic overload.
Fig. 28.2. Close-up of the tail drum. The belt tension applies a uniformly distributed sideways loading
to the drum.
298 Engineering Materials 2
Fig. 28.3. Cross-section through the tail drum. All dimensions are in mm. We have assumed a belt tension
of 5 tonnes, giving a total loading of 10 tonnes.
Fig. 28.4. Shaft-plate detail.
The second failure mode to consider is fatigue. The drum will revolve about once
every second, and each part of the shaft surface will go alternately into tension and
compression. The maximum fatigue stress range (of 2 × 56 = 112 MPa) is, however,
only a quarter of the fatigue limit for structural steel (Fig. 28.5); and the shaft should
therefore last indefinitely. But what about the welds? There are in fact a number of
reasons for expecting them to have fatigue properties that are poorer than those of the
parent steel (see Table 28.1).
Figure 28.6 shows the fatigue properties of structural steel welds. The fatigue limit
stress range of 120 MPa for the best class of weld is a good deal less than the limiting
range of 440 MPa for the parent steel (Fig. 28.5). And the worst class of weld has a
limiting range of only 32 MPa!
Case studies in design 299
Fig. 28.5. Fatigue data for a typical structural steel in dry air. Note that, if the fatigue stress range is less
than 440 MPa (the
fatigue limit
) the component should last indefinitely. The data relate to a fatigue stress cycle
with a
zero
mean stress, which is what we have in the case of our tail drum.
The shaft-plate weld can be identified as a class E/F weld with a limiting stress
range of 69 to 55 MPa. This is a good deal less than the stress range of 112 MPa
experienced by the shaft. We thus have the curious situation where a weld which is
merely an attachment to the shaft has weakened it so much that it will only last for
about 2 × 10
6
cycles – or 1 month of operation. The obvious way of solving this problem
is to remove the attachment weld from the surface of the shaft. Figure 28.7 shows one
way of doing this.
Gives stress concentration. In the case of butt welds this
can be removed by grinding back the weld until flush
with the parent plates. Grinding marks must be
parallel to loading direction otherwise they can
initiate fatigue cracks.
Helps initiate fatigue cracks. Improve finish by grinding.
Weld liable to fatigue
even when applied stress cycle is
wholly compressive
. Reduce residual stresses by stress
relieving, hammering or shot peening.
Help initiate fatigue cracks. Critical welds must be tested
non-destructively and defects must be gouged out.
Sharp changes in mechanical properties give local
stress concentrations.
Table 28.1. Weld characteristics giving adverse fatigue properties
Characteristic Comments
Change in section at weld bead.
Poor surface finish of weld bead.
Contain tensile residual stresses which are usually
as large as the yield stress.
Often contain defects (hydrogen cracks, slag
inclusions, stop–start marks).
Large differences in microstructure between parent
metal, heat-affected zone and weld bead.
300 Engineering Materials 2
Fig. 28.6. Fatigue data for welded joints in clean air. The class given to a weld depends critically on the
weld detail and the loading direction. Classes B and C must be free from cracks and must be ground flush
with the surface to remove stress concentrations. These conditions are rarely met in practice, and most welds
used in general construction have comparatively poor fatigue properties.
Fig. 28.7. Modification to remove attachment weld from surface of shaft. The collar can be pressed on to the
shaft and secured with a feather key, but we must remember that the keyway will weaken the shaft.
Case studies in design 301
Fig. 28.8. Exaggerated drawing of the deflections that occur in the loaded drum. The shaft deflects under
four-point loading. This in turn causes the end plates to deflect out of plane, creating tensile (+) and
compressive (−) stresses in the weld.
We have seen that welds can be very weak in a fatigue situation, and we would be
wise to check that the modified weld in Fig. 28.7 is adequate for the job. Although it is
difficult to spot immediately, the weld is in fact subjected to large bending stresses
(Fig. 28.8). These can be calculated as follows.
We begin by equating moments in Fig. 28.8 to give
F × 0.4 m = M
A
+ M
B
. (28.4)
Here M
A
is the couple which must be applied at the mid span of the shaft to make
(dy/dx)
x=0
= 0; and M
B
is the couple that is needed to cause the out-of-plane deflection
of the end discs. Using the standard beam-bending formula of
d
d
2
y
x
M
EI
2
=
(28.5)
302 Engineering Materials 2
we can write
d
d
d
d
d
0
lm
y
x
y
x
M
EI
x
BA
−
=
∫
.
(28.6)
Setting
d
d
d
d
y
x
y
x
B
B
A
=
= , ,
θ
0
and M (0 ഛ x ഛ 1 m) = M
A
then gives
θ
B
B
FM
EI
( . )
.=
×−04 1mm
(28.7)
We can now turn our attention to the end plate. The standard formulae are
σ
max
=
β
M
at
B
2
(28.8)
and
θ
α
B
B
M
Et
=
3
(28.9)
where
σ
max
is the maximum stress at the inner circumference of the plate, a is the outer
radius of the plate and t is the plate thickness.
β
and
α
are dimensionless constants
Table 28.2. Design modifications to overcome over-stressing of collar-plate weld
Modification Comments
Make end plate thicker (increase
t
in eqn. 28.10).
Make end plate thinner (decrease
t
in eqn. 28.10).
Increase shaft diameter and decrease end plate .
thickness
Remove weld altogether. Make plate a running fit on
shaft and drive it using splines.
Make shaft stiffer by supporting it with intermediate
plates welded to both shaft and shell.
Decrease shaft overhang – move bearings next to
end plates.
Use fixed (non-rotating) shaft and mount bearings in
end plates.
Plate would have to be 70 mm thick: heavy; difficult
to weld to collar; might overstress plate-shell weld;
collar would become irrelevant.
Plate would have to be 2 mm thick: too thin to carry
normal loading without risk of buckling.
Increases
I
and decreases
t
in eqn. 28.10. Would
need 250 mm diameter shaft + 15 mm thick end
plate: very heavy and expensive. Would still need
to check plate-shell weld.
Allows shaft to flex without bending plate. Continual
flexing will wear the contacting surfaces and may
lead to fretting fatigue.
Alignment and assembly problems and higher cost.
Requires major modifications to support framing or
over-long shells.
Probably the best solution, but no good for drive
drums.
Case studies in design 303
whose value depends on the ratio of the inner to the outer radius, b/a. Equations (28.7),
(28.8) and (28.9) can be combined to give
σ
max
=
β
α
( .
(
.
Ft
aI t
××
+×
04
1
3
m 1 m)
m)
(28.10)
Values for
α
and
β
can be found from standard tables: for our value of b/a of 0.31 they
are 0.46 and 2.8 respectively. Equation (28.10) then tells us that
σ
max
= 142 MPa (28.11)
for our current values of F = 5000 × 9.81 N, t = 20 mm, a = 400 mm and I = (
π
/4)(75 mm)
4
.
This stress gives a fatigue range of 284 MPa which is about five times the limiting
range for an E/F weld. This is obviously a case of going back to the drawing board! In
fact, as Table 28.2 shows, the solution to this design problem is far from straightforward.
Conclusions
Structural steelwork – from small items like our conveyor drums to large structures
like ships and bridges – is usually fabricated by welding. It is relatively easy to design
structures so that the parent material has an adequate resistance to elastic deformation,
plastic collapse, fast fracture or fatigue. But the welds – with their stress concentrations,
residual stresses, microstructural variations and hidden defects – are the Achilles heel
of any design. It has long been known that welds can be potent initiators for fast
fracture. But it is less commonly known that most welds have abysmal fatigue strengths.
Designers beware!
Further reading
Roark’s Formulas for Stress and Strain, 6th edition, McGraw-Hill, 1989.
J. G. Hicks, Welded Joint Design, Granada Publishing, 1982.
Smithells’ Metals Reference Book, 7th edition, Butterworth-Heinemann, 1992 (for data on steels).
British Standards Institution, BS 5400, 1980: Steel, Concrete and Composite Bridges. Part 10: Code of
Practice for Fatigue.
2. D
ESIGNING
WITH
CERAMICS
:
ICE
FORCES
ON
OFFSHORE
STRUCTURES
Introduction
To recover oil from the continental shelf of arctic Canada and Alaska, drilling and
production platforms must be built some miles offshore, in roughly 40 m of water.
This is not a great depth, and would present no new problems were it not that the sea
freezes in winter to a depth of around 2 m. Wind blowing across the surface of the ice
sheet causes it to move at speeds up to 1 m s
−1
, pressing it against the structure. Ice is
304 Engineering Materials 2
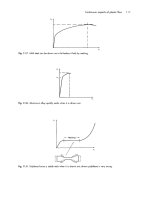
Fig. 28.9. Two alternative designs for oil production platforms in ice-covered sea: a monopod and an
artificial island.
a ceramic. Like all ceramics it is weak in tension, but strong in compression. So the
structure must be designed to withstand large ice forces.
Two possible structures are shown in Fig. 28.9. The first is a monopod: a slender
pillar with a broad foot, presenting a small section (perhaps 10 m wide) at the water
surface. The second (and favoured) design is a gravel island, with a width of 100 to
200 m. In both cases it is essential to compute the maximum force the ice can exert on
the structure, and to design the structure to withstand it. We are concerned here with
the first problem: the ice force.
Material properties of ice
Winter temperatures in the arctic range between −50°C and −4°C. Expressed as a frac-
tion of the melting point T
m
of sea ice, these correspond to the range 0.82 to 0.99 T
m
.
Case studies in design 305
Table 28.3. Properties of ice
Modulus
E
(GPa) 9.1
Tensile strength s
TS
(MPa) 1
Compressive strength s
c
(MPa) 6
Fracture toughness
K
IC
(MPa m
1/2
) 0.12
Above 0.5 T
m
ceramics creep in exactly the same way that metals do. The strain-rate
increases as a power of the stress. At steady state (see Chapter 17, eqn. 17.6) this rate is
˙
exp(– ).
εσ
ss
/= AQRT
n
(28.12)
When the ice moves slowly it creeps around the structure. The greater the velocity,
the greater is the strain-rate of the ice as it deforms around the structure, and (from
eqn. 28.12) the greater is the stress, and thus the load on the structure. But ice, like all
ceramics, is a brittle solid. If deformed too fast, grain-size cracks nucleate throughout
the body of ice, and these cracks propagate and link to give a crushing fracture (Chap-
ter 17, Fig. 17.3). In practice, a rubble pile of broken ice blocks (Fig. 28.9) develops
around test structures and natural and artificial islands in ice-covered seas, showing
that the ice velocity is usually large enough to cause crushing. Then it is the crushing
strength (not the creep strength) of the ice which determines the force on the structure.
Material properties for ice are listed in Table 28.3. The fracture toughness is low
(0.12 MPa m
1/2
). The tensile strength of ice is simply the stress required to propagate a
crack of dimensions equal to the grain size d, with
σ
TS
=
K
d
IC
/2
π
.
(28.13)
Natural ice has large grains: typically 10 mm or more (it is like a casting which has
solidified very slowly). Then this equation gives a tensile fracture strength of 1 MPa –
precisely the observed strength. So when ice is loaded in tension, it creeps when the
stresses are less than 1 MPa; the strength is limited to a maximum of 1 MPa by fast
fracture.
In compression, of course, the strength is greater. Most ceramics are about fifteen
times stronger in compression than in tension, for the reasons given in Chapter 17. For
ice the factor is smaller, typically six, probably because the coefficient of friction across
the crack faces (which rub together when the ceramic is loaded in compression) is
exceptionally low. At stresses below 6 MPa, ice loaded in compression deforms by
creep; at 6 MPa it crushes, and this is the maximum stress it can carry.
Forces on the structures
It is now easy to calculate the force on the narrow structure. If the pillar has a width
w = 10 m where it passes through the ice sheet (thickness t = 2 m), it presents a section
of roughly 20 m
2
on which ice presses. The maximum stress the ice can take is 6 MPa,
so the maximum force it can exert on the structure is
306 Engineering Materials 2
Fig. 28.10. Successive contact profiles of a brittle sheet moving against a rigid structure. At any instant,
contact is only made at discrete places.
F = tw
σ
c
= 120 MN (12,000 tonne). (28.14)
This is a large force – enough to demolish a structure which was merely designed to
withstand large waves. Lighthouses have been lost in northern Sweden and arctic
Canada in just this way.
The ice force on the large structure with a width w of 100–200 m would just seem, at
first sight, to be that for the narrow structure, scaled up by the width. But gravel
islands exist which (it is now known) could not take such a large force without shear-
ing off, yet they have survived. The ice force on a large structure, evidently, is less
than the simple crushing–strength argument predicts.
The force on the larger structure is less than expected because of non-simultaneous
failure. As the ice pushes against the structure one heavily loaded corner of the ice
breaks off (forming rubble). This allows others to come into contact with the structure,
take up the load, and in turn break off (Fig. 28.10). The process involves a sequence of
fractures and fragment movements, occurring at different points along the contact
zone. You can reproduce the same effect by pressing a piece of rye crispbread, laid flat
on a table, against the edge of an inverted coffee cup. First one fragment breaks away,
then another, then a third. The contact remains jagged and irregular. The load on the
structure (or the coffee cup) fluctuates violently, depending on how many contacts
there are at any given moment. But it is never as large as tw
σ
c
(the section times the
crushing strength) because the brittle ice (or crispbread) never touches the structure
(or the cup) simultaneously along its entire length.
Case studies in design 307
This is another feature of brittleness. If the ice were ductile, point contacts would
bed down by plastic flow until the ice sheet pressed uniformly along the entire contact
zone. But because it is brittle some bits break off, leaving a gap, before other bits have
yet come into contact. The force on the structure now depends on the probability of
contact; that measures the number of true contacts per unit length of the contact zone. In
Fig. 28.10 there are, on average, five contacts; though of course the number (and thus
the total force) fluctuates as the brittle sheet advances. The peak force depends on the
brittle process by which chunks break away from the ice sheet, since this determines
the jagged shape and the number of contacts (it is probably a local bending-fracture).
The point is that it is the local, not the average, strength which is important. It is a
“weakest link” problem again: there are five contact points; the failure of the weakest one
lets the entire ice-sheet advance. The statistics of “weakest link” problems was devel-
oped in Chapter 18. This problem is the same, except that the nominal area of contact
A = tw (28.15)
replaces the volume V. Then, by analogy with eqn. (18.9), the probability of survival is
given by
PA
A
A
m
s
( ) exp =−
00
σ
σ
(28.16)
where
σ
and
σ
0
are nominal section stresses. Data for the crushing of thin ice sheets by
indenters of varying contact section A fit this equation well, with m = 2.5.
We can now examine the effect of structure size on the ice force. If the ice is to have
the same survival probability at the edge of each structure then
exp exp−
=−
tw
A
tw
A
mm
1
0
1
0
2
0
2
0
σ
σ
σ
σ
(28.17)
or
σ
σ
1
2
2
1
1
=
.
/
w
w
m
(28.18)
Thus
σ
1
= 6 MPa
10
200
125
.
m
m
/
= 1.8 MPa. (28.19)
These lower strengths give lower ice forces, and this knowledge is of immense
importance in designing economic structures. Building large structures in the arctic,
under difficult conditions and large distances from the source of raw materials, is very
expensive. A reduction by a factor of 3 in the design load the structures must with-
stand could be worth $100,000,000.
308 Engineering Materials 2
3. D
ESIGNING
WITH
POLYMERS
:
A
PLASTIC
WHEEL
Introduction
Small rotating parts – toy wheels, gears, pulleys – have been made of plastic for some
years. Recently the use of polymers in a far more demanding application – wheels for
bicycles, motorcycles and even automobiles – is receiving serious consideration. The
design of heavily loaded plastic wheels requires careful thought, which must include
properly the special properties of polymers. But it also presents new possibilities,
including that of a self-sprung wheel. This case study illustrates many general points
about designing with polymers.
Mould design
Polymers are not as stiff as metals, so sections have to be thicker. The first rule of
mould design is to aim for a uniform section throughout the component. During mould-
ing, hot polymer is injected or pressed into the mould. Solidification proceeds from the
outside in.
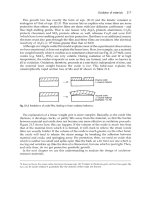
Abrupt changes of section cause poor flow and differential shrinkage, giving sink
marks (Fig. 28.11 – you can find them on the surface of many small polymer parts),
distortion, and internal stress which can lead to cracks or voids. The way out is to
design in the way illustrated in Fig. 28.12. Ribs, which are often needed to stiffen
polymer parts, should have a thickness of no more than two-thirds of the wall thick-
ness, and a height no more than three times the wall thickness. Corners are profiled to
give a uniform section round the corner.
Polymers have a low fracture toughness. This is not as great a problem as it sounds:
their moduli are also low, so (to avoid excessive deflections) the designer automatic-
ally keeps the stresses much lower than in a metal part. But at sharp corners or sudden
changes of section there are stress concentrations, and here the (local) stress can be ten
or even a hundred times greater than the nominal (average) level. So the second rule
of mould design is to avoid stress concentrations. Figure 28.13 shows an example: a
cantilever beam with a change in section which has local radius R. The general rule for
Fig. 28.11. Changes of section cause distortion, sink-marks and internal stresses in moulded plastic parts.
Case studies in design 309
Fig. 28.12. Example of good and bad design with polymers.
Fig. 28.13. A sharp change of section induces stress concentrations. The local stress can be many times
greater than the nominal stress.
310 Engineering Materials 2
estimating stress concentrations is that the local stress is bigger than the nominal stress
by the factor
S ≈ 1 +
t
R
12/
(28.20)
where t is the lesser of the section loss (t
2
) and the section thickness (t
1
). As the fillet
becomes sharper, the local stress rises above that for a uniform beam, and these local
stresses cause fracture. The rule-of-thumb is that radii should never be less than 0.5 mm.
The allowable dimensional variation (the tolerance) of a polymer part can be larger
than one made of metal – and specifying moulds with needlessly high tolerance raises
costs greatly. This latitude is possible because of the low modulus: the resilience of the
components allows elastic deflections to accommodate misfitting parts. And the ther-
mal expansion of polymers is almost ten times greater than metals; there is no point in
specifying dimensions to a tolerance which exceeds the thermal strains.
Web and spoke design
From a moulder’s viewpoint, then, the ideal wheel has an almost constant wall thick-
ness, and no sharp corners. In place of spokes, the area between the hub and the rim
can be made a solid web to give even flow of polymer to the rim and to avoid weld
lines (places where polymer flowing down one channel meets polymer which has
flowed down another). The wheel shown in Fig. 28.14 typifies this type of design. It
replaces a die-cast part, saving both cost and weight. While the web is solid, axial
stability is provided by the corrugated surface. The web is a better solution than ribs
attached to a flat disc because the changes in section where the ribs meet the disc give
shrinkage problems.
But in a large wheel (like that for a bicycle) spokes may be unavoidable: a solid web
would be too heavy and would give too much lateral wind pressure. A design with
few spokes leaves relatively large sectors of the rim unsupported. As the wheel rotates,
the contact load where it touches the ground will distort the rim between spokes, but
not beneath a spoke, giving a bumpy ride, and possible fatigue failure of the rim.
Doubling the number of spokes reduces the rim deflection (since it is just a bending
beam) by a factor of 8; and, of course, the spokes must be ribbed in a way which gives
Fig. 28.14. A design for a small plastic wheel. The upper, corrugated, web profile is better than the lower,
ribbed, one because the section is constant.
Case studies in design 311
Fig. 28.15. Rim design. The left-hand design is poor because the large bending moments will distort the rim
by creep. The right-hand design is better: the bending moments are less and the ribs stiffen the rim.
a constant thickness, equal to the rim thickness; and the spokes must be contoured into
the rim and the hub to avoid stress concentrations.
Rim design
Polymers, loaded for a long time, suffer creep. If a pneumatic tyre is used, the rim will
be under constant pressure and the effect of creep on rim geometry must be taken into
account. The outward force per unit length, F, exerted on the rim (Fig. 28.15) is roughly
the product of the pressure p in the tyre and the radius of the tyre cross-section, R. This
force creates bending stresses in the rim section which can be minimised by keeping
the rim height H as small as possible: the left-hand design of Fig. 28.15 is poor; the
right-hand design is better. Radial ribbing, added as shown, further stiffens the rim
without substantially affecting the cross-section wall thickness.
Innovative design
Polymers have some obvious advantages for wheels. The wheel can be moulded in
one operation, replacing a metal wheel which must be assembled from parts. It re-
quires no further finishing, plating or painting. And its naturally low coefficient of
friction means that, when loads are low, the axle may run on the polymer itself.
But a polymer should never be regarded simply as an inexpensive substitute for a
metal. Its properties differ in fundamental ways – most notably its modulus is far
lower. Metal wheels are designed as rigid structures: it is assumed that their elastic
deflection under load is negligible. And – thus far – we have approached the design of
a polymer wheel by assuming that it, too, should be rigid.
A good designer will think more broadly than this, seeking to exploit the special
properties of materials. Is there some way to use the low modulus and large elastic
deflections of the polymer? Could (for instance) the deflection of the spoke under
radial load be made to compensate for the deflection of the rim, giving a smooth,
sprung, ride, with fewer spokes? One possible resolution of such an assignment, for a
bicycle wheel, is shown in Fig. 28.16. Each arc-shaped spoke is designed to deflect by
the maximum amount acceptable to the wheel manufacturer (say 2.5 mm) when it is
vertical, carrying a direct load. Of course, when two of the spokes straddle the vertical
312 Engineering Materials 2
Fig. 28.16. Tentative design for a self-sprung wheel. The spokes and the rim both deflect. The design
ensures that the sum of the deflections is constant.
and share the load, the deflection would be only one-half this amount (1.3 mm). The
cross-section of the rim could then be sized to deflect as a beam between spokes,
providing the extra 1.3 mm of deflection necessary for a smooth ride. If the stresses are
kept well below yield, permanent deflection and fatigue should not be a problem.
Stiffness, low creep and maximum toughness, are requirements for this application.
Table 21.5 shows that nylon and polypropylene are tougher than most other polymers.
The modulus of polypropylene is low, roughly one-third that of nylon; and its glass
temperature is low also, so that it will creep more than nylon. PMMA has a modulus
and glass temperature comparable with nylon, but is much less tough. The best choice
is nylon, a thermoplastic, which can conveniently be moulded or hot-pressed. And
that is the choice of most manufacturers of wheels of this sort. To improve on this it
would be necessary to use a composite (Chapter 25) and then the entire design must
be rethought, taking account of the strengths and weaknesses of this material.
Further reading
DuPont Design Handbooks, DuPont de Nemours and Co., Polymer Products Department,
Wilmington, Delaware 19898, USA, 1981.
4. D
ESIGNING
WITH
COMPOSITES
:
MATERIALS
FOR
VIOLIN
BODIES
Introduction
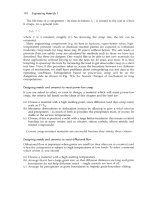
The violin (Fig. 28.17) is a member of the family of musical instruments which we call
“string” instruments. Table 28.4 shows just how many different types of string instru-
ments there are of European origin alone – not to mention the fascinating range that
we can find in African, Asian or Oriental cultures.
String instruments all work on the same basic principle. A thin string, of gut or
metal, is stretched tightly between two rigid supports. If the string is plucked, or hit,
or bowed, it will go into sideways vibrations of precisely defined frequency which can
Case studies in design 313
Fig. 28.17. A young child practises her violin.
be used as musical notes. But a string vibrating on its own can hardly be heard – the
sideways-moving string cuts through the air as a cheesewire cuts through cheese and
the pressure wave that reaches our eardrums has scarcely any amplitude at all. For
this reason all string instruments have a soundboard. This is forced into vibration by the
strings and radiates strong pressure waves which can be heard easily.
But soundboards are much more than just radiating surfaces. They have their own
natural frequencies of vibration and will respond much better to notes that fall within
the resonance peaks than notes which fall outside. The soundboard acts rather like a
selective amplifier, taking in the signal from the string and radiating a highly modified
output; and, as such, it has a profound effect on the tone quality of the instrument.
Table 28.4. Some European string instruments
Violin family Viol family Guitar family Harp family Keyboard family
Violin Treble Guitar Modern harp Piano
Viola Tenor Lute Folk harps Harpsichord
Cello Bass Zither Clavichord
Double bass Balalaika
314 Engineering Materials 2
Soundboards are traditionally made from wood. The leading violin makers can
work wonders with this material. By taking a thin plate of wood and hollowing it out
here and there they can obtain a reasonably even response over a frequency range
from 200 to 5000 Hz. But the process of adjusting a soundboard is so delicate that a
trained listener can tell that 0.1 mm has been removed from an area of the soundboard
measuring only 20 mm × 20 mm.
Such skills are rare, and most students today can only afford rather indifferent
mass-produced instruments. But the music trade is big business and there is a power-
ful incentive for improving the quality of the mass-market product.
One obvious way of making better violins would be to dismantle a fine instrument,
make accurate thickness measurements over the whole of the soundboard, and mass-
produce sound-boards to this pattern using computer-controlled machine tools. But
there is a problem with this approach: because wood is a natural material, soundboard
blanks will differ from one another to begin with, and this variability will be carried
through to the finished product. But we might be able to make a good violin every
time if we could replace wood by a synthetic material having reproducible properties.
This case study, then, looks at how we might design an artificial material that will
reproduce the acoustically important properties of wood as closely as possible.
Soundboard vibrations
In order to design a replacement for wood we need to look at the vibrational behavi-
our of soundboards in more detail. As Fig. 28.17 shows, the soundboard of a violin has
quite an ornate shape and it is extremely difficult to analyse its behaviour mathematic-
ally. But an adequate approximation for our purposes is to regard the soundboard as
a rectangular panel simply supported along two opposing edges and vibrating from
side to side as shown in Fig. 28.18.
The natural frequencies are then given by
fn
l
EI
bd
n
/
=
2
2
12
2
π
ρ
(28.21)
where E is Young’s modulus, I (=bd
3
/12) is the second moment of area of the section,
and
ρ
is the density of the soundboard material. We get the lowest natural frequency
when the panel vibrates in the simplest possible way (see Fig. 28.18 with n = 1). For
more complex vibrations, with mode numbers of 2, 3, 4 and so on, f scales as the
square of the mode number.
Making the soundboard out of wood introduces a complication. As we can see in
Chapter 26, wood has a much bigger modulus along the grain than across the grain.
A wooden soundboard therefore has both along-grain and across-grain vibrations
(Fig. 28.19).
The frequencies of these vibrations are then
fn
l
EI
bd
ww
ww
||
||
||
||
/
=
2
2
12
2
π
ρ
(28.22)
Case studies in design 315
Fig. 28.18. Idealized vibration modes of a soundboard. The natural frequencies of the modes are
proportional to
n
2
.
and
fn
l
EI
bd
ww
ww
⊥
⊥
⊥
⊥
=
/
2
2
12
2
π
ρ
(28.23)
where E
w||
is the axial modulus and E
w⊥
is the radial modulus.
In order to estimate the soundboard frequencies, we set d
w
= 3 mm, l
||
= 356 mm, and
l
⊥
= 93 or 123 mm (Fig. 28.20). Violin soundboards are usually made from spruce,
Fig. 28.19. A wooden soundboard has both along-grain and across-grain vibrations. Although not shown
here, both types of vibration have a full set of modes, with
n
= 1, 2, 3 . . .